The charcoal agar resazurin assay (CARA) is a semi-quantitative, medium-throughput method to assess activity of test agents against mycobacteria that are replicating, non-replicating, or both. The CARA permits rapid evaluation of time- and concentration-dependent activity and identifies parameters to pursue by colony forming unit (CFU) assays.
Method Article
Visualization of the Charcoal Agar Resazurin Assay for Semi-quantitative, Medium-throughput Enumeration of Mycobacteria
* These authors contributed equally
Opens in a new tab
In This Article
Summary
Loading...
$$\rightleftharpoonup{xx}$$
$$\longleftharp{xx}$$,
$$\longrightharp{xx}$$,
Abstract
Loading...
$$\rightleftharpoonup{xx}$$
$$\longleftharp{xx}$$,
$$\longrightharp{xx}$$,
There is an urgent need to discover and progress anti-infectives that shorten the duration of tuberculosis (TB) treatment. Mycobacterium tuberculosis, the etiological agent of TB, is refractory to rapid and lasting chemotherapy due to the presence of bacilli exhibiting phenotypic drug resistance. The charcoal agar resazurin assay (CARA) was developed as a tool to characterize active molecules discovered by high-throughput screening campaigns against replicating and non-replicating M. tuberculosis. Inclusion of activated charcoal in bacteriologic agar medium helps mitigate the impact of compound carry-over, and eliminates the requirement to pre-dilute cells prior to spotting on CARA microplates. After a 7-10 day incubation period at 37 °C, the reduction of resazurin by mycobacterial microcolonies growing on the surface of CARA microplate wells permits semi-quantitative assessment of bacterial numbers via fluorometry. The CARA detects approximately a 2-3 log10 difference in bacterial numbers and predicts a minimal bactericidal concentration leading to ≥99% bacterial kill (MBC≥99). The CARA helps determine whether a molecule is active on bacilli that are replicating, non-replicating, or both. Pilot experiments using the CARA facilitate the identification of which concentration of test agent and time of compound exposure require further evaluation by colony forming unit (CFU) assays. In addition, the CARA can predict if replicating actives are bactericidal or bacteriostatic.
Introduction
Loading...
$$\rightleftharpoonup{xx}$$
$$\longleftharp{xx}$$,
$$\longrightharp{xx}$$,
Mycobacterium tuberculosis, the etiological agent of tuberculosis, can survive in a host in a latent state that is refractory to antibiotic eradication. Phenotypic (non-genetic) resistance of M. tuberculosis during infection is believed to be due, in part, to populations of non-replicating bacilli1,2. Class I persisters displaying phenotypic drug resistance arise via rare stochastic mechanisms amongst large populations of drug sensitive cells3,4. Class II persisters are rendered non-replicating by factors of host immunity, including external stresses in microenvironments encountered during infection. We recently developed an in vitro model of Class II non-replicating persistence to mimic conditions confronted by M. tuberculosis in activated macrophages and granulomas. The multi-stress model of Class II persistence includes conditions that slow growth, such as a fatty acid carbon source, and completely halt growth, such as mild acidity (pH 5.0), hypoxia (1% O2), and nitric oxide and other reactive nitrogen intermediates5-9. Large-scale screening employing this multi-stress model of non-replication, and other Class II non-replicating models, has yielded diverse molecules whose activity is directed against the non-replicating state5-7,9-18. The same non-replicating screens also revealed a category of molecules that possess activity against both replicating and non-replicating bacilli, termed "dual actives"7,10,12,19,20.
Antibacterial drug discovery in the hit-to-lead phase entails extensive characterization of candidate molecules to choose leads for hit expansion, preliminary pharmacologic characterization, target identification, and preliminary in vivo efficacy studies. As an early step, anti-infectives are classified by their bacteriostatic or bactericidal mechanism of action and, if bactericidal, whether bacterial kill is time- and/or concentration-dependent. The colony forming unit (CFU) assay is the classical, gold standard method to address these questions. In the CFU assay, bacteria are exposed to a test agent, after which aliquots are removed, serially diluted, and aliquots of dilutions are spread on solid bacteriologic medium and incubated to permit growth of surviving cells. Finally, bacterial colonies are enumerated. The CFU assay requires large numbers of microtiter plates to dilute cells and agar-containing Petri-plates to enumerate surviving colonies. The CFU assay for slow growing mycobacteria is hampered by their slow generation time (18-24 hr), which requires approximately 3 weeks for colonies to appear on plates. Furthermore, incubator space is often limited in specialized biosafety-level-3 facilities.
While cumbersome, CFU assays are the gold standard to characterize the impact of non-replicating and dual-active molecules on mycobacteria. Non-replicating assays are subject to high false-positive rates as many are coupled to replicating assays to assess cellular viability6-8. For example, a compound that has potent activity against replicating M. tuberculosis (a "replicating active") may fail to kill during the non-replicating assay, yet can still kill by virtue of carry-over from the non-replicating phase of the assay to the recovery phase of the assay, which is conducted under conditions that support replication ("replicating conditions"). Compound carry over further complicates analysis of dual active molecules, making it difficult to distinguish whether activity was replicating, non-replicating, or dual.
To address the issues described above, we developed the charcoal agar resazurin assay (CARA) for rapid, semi-quantitative enumeration of mycobacterial species such as M. tuberculosis, M. bovis BCG, and M. smegmatis7 (Figures 1 and 2). In buffer solutions in vitro, activated charcoal rapidly sequesters most of the standard drugs used to treat tuberculosis7. Activated charcoal in CARA microplates binds compounds that may carry over from an assay microplate, and this feature of the CARA eliminates the requirement to serially dilute assay well contents prior to enumeration7,21,22. The number of mycobacterial microcolonies on the agar surface of CARA microplates is estimated by the addition of resazurin, a blue dye, whose reduced form, resorufin, is a pink molecule whose fluorescence is measured by a spectrophotometry23. CARA microplates are incubated for 1-2 days for M. smegmatis and 7-10 days for slow growing mycobacteria such as M. tuberculosis and M. bovis BCG. The CARA has a narrow dynamic range of ~2-3 log10 difference in CFU. When used instead of a CFU assay, a single CARA microplate replaces approximately five 96-well plates used for serial dilutions and 120 tri-style agar plates used for plating. Interpretation of CARA data helps guide subsequent studies by determining which incubation times and compound concentrations to test in more laborious CFU-based assays.
Protocol
Loading...
$$\rightleftharpoonup{xx}$$
$$\longleftharp{xx}$$,
$$\longrightharp{xx}$$,
1. Preparation of CARA Microplates
- Autoclave 900 ml of Middlebrook 7H11 agar containing 0.2% glycerol and 0.4% activated charcoal in a 2 L Erlenmeyer flask, or alternatively, 450 ml in a 1 L glass beaker. Include a large autoclavable stir bar in the flask or beaker. Cover the opening of the flask or beaker with aluminum foil and attach to glass with autoclave tape.
- Cool to touch (approximately 55-65 °C) on a magnetic stir plate set at a low speed to maintain the charcoal in suspension.
- Perform all subsequent steps aseptically in a biosafety hood that has a magnetic stir plate.
- Remove foil. Add 100 ml OADC supplement (OADC supplement, when used at 10%, yields final media concentrations of 0.2% dextrose, 0.5% albumin, 0.085% NaCl, 0.0005% oleic acid, and 0.4 mg/ml catalase) to the 2 L Erlenmeyer flask, or 50 ml OADC to the 1 L beaker, and continue mixing.
- If using an Erlenmeyer flask, pour approximately 25-40 ml of 7H11-OADC-charcoal into a sterile reagent reservoir. If using the beaker, it is not necessary to use a reagent reservoir.
- Fill a 96-well microplate with 200 μl/well of 7H11-OADC-charcoal from the reagent reservoir or beaker. Work quickly to avoid agar solidification and introduction of bubbles. Avoid splashing solid medium outside of the wells, as that can be a source of fungal contamination. Using a multichannel pipette, use one set of 12 filter tips for the transfer of 7H11-OADC-charcoal to the 8 rows (A-H) of the 96-well plate.
NOTE: The medium solidifies quickly. To avoid clogging pipette tips, change them frequently. - Alternatively, pour CARA microplates using a p1000 electronic multichannel pipette with filter tips to assist in preparing numerous plates.
NOTE: Due to the low volume of microplate wells, the agar in CARA microplates solidifies within minutes of pouring. - Place stacks of CARA microplates in resealable plastic bags to avoid drying out.
- Store CARA microplates at 4 °C.
2. Setting Up Replicating and Non-replicating MIC90 Assays
- Inoculate M. tuberculosis, M. bovis BCG or M. smegmatis at an OD580 of 0.01-0.1 and expand to mid-log phase (OD580 ~0.5) in Middlebrook 7H9-ADN (Middlebrook 7H9 containing 0.2% glycerol, 0.2% dextrose, 0.5% albumin, and 0.085% NaCl) or 7H9-OADC (Middlebrook 7H9 containing 0.2% glycerol and 10% OADC supplement).
- Grow M. tuberculosis and M. bovis BCG as ~20 ml standing cultures in cell culture flasks and M. smegmatis with shaking in polypropylene round-bottom (4 ml culture) or 50 ml conical centrifuge tubes (10-20 ml culture). Incubate pathogenic mycobacteria at 37 °C with 20% O2 and 5% CO2, and M. smegmatis at 37 °C with 20% O2.
- Set up a minimal-inhibitory concentration (MIC90)-style experiment under replicating and non-replicating conditions (Figure 2).
NOTE: Test agents are usually assayed in duplicates or quadruplicates to permit testing 4, or 2 compounds, respectively, per 96-well microplate. For example, in a 96-well plate, one test agent can be assayed in rows A-D and another in rows E-H. The DMSO (vehicle) is in columns 1, 2, and 12, and the test agent dilution series runs from column 3 (lowest concentration) to column 11 (highest concentration). MIC90-style assays typically employ 2-fold dilution series. There are numerous non-replicating models available for mycobacteria14-16,18,24,25 and for illustrative purposes, we are using a multi-stress model of non-replication6,8,9.- For the replicating assay, distribute 200 μl cells in 7H9-ADN at an OD580 of 0.01 into all wells of a clear-bottomed, tissue culture treated 96-well plate.
- For the non-replicating assay, wash cells twice in phosphate buffered saline (PBS) containing 0.02% tyloxapol, and resuspend cells in non-replicating medium (0.05% KH2PO4, 0.05% MgSO4, 0.005% ferric ammonium citrate, 0.0001% ZnCl2, 0.1% NH4Cl, 0.5% BSA, 0.085% NaCl, 0.02% tyloxapol, 0.05% butyrate; pH adjusted to 5.0 with 2 N NaOH).
- Dilute cells to an OD580 of 0.1 in non-replicating medium and add NaNO2 from a freshly prepared 1 M stock to a final concentration of 0.5 mM.
- Distribute 200 μl cells at an OD580 of 0.1 into all wells of a clear-bottomed, tissue culture treated 96-well plate.
NOTE: Prepare compound dilutions as 100-fold stock solutions in DMSO. Thus, a typical MIC plate testing the impact of a molecule at a final concentration 0.4-100 μg/ml would require stock solutions of 0.04-10 mg/ml in DMSO.
- Add 2 μl of dilutions of test agent 1 into rows A-E and 2 μl of dilutions of test agent 2 into rows E-H. Mix thoroughly.
- Add 2 μl vehicle control (usually DMSO) into control wells, columns 1, 2, 12 (rows A-H). Mix thoroughly.
- For each experiment, include at least one positive control such as rifampicin from 0.004 to 1 μg/ml (replicating assay) and/or 0.08 to 20 μg/ml (non-replicating assay).
NOTE: The use of 6-bromo-1H-indazol-3-amine9 at 0.1 to 25 μg/ml is recommended as a control compound that has selective, NaNO2-dependent activity in the multi-stress model of non-replication. - For replicating assays, incubate microplates at 37 °C at 20% O2 and 5% CO2 for 7 days (M. tuberculosis and M. bovis BCG) or 1-48 hr (M. smegmatis). For the multi-stress model of non-replication, incubate microplates for 7 days at 37 °C at 1% O2 and 5% CO2 (M. tuberculosis and M. bovis BCG).
3. Inoculation of CARA Microplates
- At time points in which the CARA will be used as a read-out, carefully resuspend well contents of the MIC90-style assay plate using a p200 multichannel pipette set at 50-75 μl. Pipette up and down at least 5-10 times and gently swirl the well contents in a circular motion using the pipette tips.
- Transfer 10 μl of assay well contents to the CARA microplate. Ensure that the order of the well contents on the assay plate matches the order of the well contents of the CARA microplate. Avoid splashing during the transfers and make sure the 10 μl are spotted into the middle of the CARA microplate wells. Confirm the 10 μl absorbs into the CARA microplate.
NOTE: There are no dilutions required prior to spotting cells on the CARA microplates. - Bind stacks of CARA microplates with plate tape and then place into a resealable plastic bag. Incubate CARA microplates at 37 °C with 20% O2 (M. smegmatis) or 1% O2 and 5% CO2 (M. tuberculosis and M. bovis BCG).
- For M. tuberculosis and M. bovis BCG, replicating assays: incubate for 7 days; for M. tuberculosis and M. bovis BCG non-replicating assays, incubate for 10 days; for M. smegmatis, replicating assays, incubate for 1-2 days; for M. smegmatis, non-replicating assays, incubate 2-3 days.
NOTE: Times are estimates and may be modified accordingly for different replicating, non-replicating, and stress conditions.
4. Developing CARA Microplates
- Develop the CARA microplates when a film of bacterial growth, or larger, macroscopic colonies, are visible on the negative (vehicle) control wells.
NOTE: After prolonged incubation, CARA microplate wells often appear dry and we recommend pre-wetting well contents with sterile PBS. This serves to prevent the charcoal from absorbing resazurin, which can lead to low fluorescence or well-to-well variation. - Using a single set of 12 p200 tips with a multichannel pipette, dispense 40 µl of sterile PBS along the side of the wells and allow the PBS to distribute across the top of the agar/bacterial microcolonies.
- Prepare CARA developing reagent by mixing 5 mg resazurin (0.01% final) and 50 ml of 5% Tween80 in PBS. Vortex and sterile filter.
NOTE: An alternative CARA developing reagent can be prepared by mixing commercially prepared resazurin liquid solution at 1:1 (vol/vol) with 10% Tween80 in PBS. - Add 50 µl of freshly prepared CARA developing reagent to each well of the CARA microplate using a 12-channel pipette. Rock plates back and forth a few times to help distribute reagent across the agar and bacterial mat in each well.
- Place the plates in a resealable plastic bag and incubate at 37 °C for at least 30 min for M. smegmatis and 45-60 min for M. tuberculosis or M. bovis BCG.
NOTE: If the vehicle control wells fail to turn pink within the first hour, the plates can be re-bagged and incubated for longer periods of time. - Prior to reading fluorescence, place CARA microplates in a biosafety hood for 15 min at room temperature with their lids removed. When using BSL3 spectrophotometers outside of a biosafety cabinet, adhere an optical quality PCR sticker over the plate and seal tightly by pressing gently on the sticker surface with a soft paper towel.
- Determine fluorescence via top read with excitation at 530 nm and emission at 590 nm. It is not necessary to blank the plate.
5. Data Analysis
- Plot inhibitor concentration on the X-axis on a log10 scale and fluorescence on the Y-axis on a linear scale. Use a scatter plot employing a curve fit such as "log inhibitor versus response-variable slope (4 parameters)". Plot data points as means ± standard error.
Results
Loading...
$$\rightleftharpoonup{xx}$$
$$\longleftharp{xx}$$,
$$\longrightharp{xx}$$,
Anticipated CARA results are described in Figure 2 and summarized in Table 1. For replicating cells, the CARA is run in parallel with a standard MIC90 assays, and for non-replicating assays, the CARA is run in parallel with an adapted MIC90 assay that is coupled to an outgrowth phase. The concentration of test agent that results in failure of CARA-fluorescence to rise above background levels is the CARA-MBC≥99 (Figure 3a). The "≥99" subscript indicates that the CARA-MBC provides an estimated concentration of test agent that gives rise to ≥2 log10 bacterial kill (≥99% kill).
The liquid broth MIC90 assay is unable to discriminate between bactericidal and bacteriostatic activity and this distinction has to be resolved by a CFU assay. By convention, the threshold that distinguishes bactericidal from bacteriostatic activity for slow-growing mycobacteria is approximately 2-3 log10 kill over 7 days7,26. Since the dynamic range of the CARA is also 2-3 log10 kill, the CARA can provide an estimate of bactericidal or bacteriostatic activity. The CARA easily identifies some replicating actives as bacteriostatic due to failure of these compounds to decrease CARA fluorescence to background levels (Figure 2). However, some compounds with bacteriostatic activity against replicating M. tuberculosis have a potent post-antibiotic effect, meaning that they continue to inhibit regrowth of bacteria during the recovery phase even in the absence of compound carry-over. This effect can be difficult to recognize in the CARA assay. Compounds are suspected of exerting a post-antibiotic effect if they display a "static window", defined as a >4-fold shift to the right between the MIC and CARA curves (Figure 3b). The static window indicates that a molecule active against replicating M. tuberculosis may be bacteriostatic instead of bactericidal. In some cases, the static windows are apparent only after inspection of an expanded Y-axis for CARA fluorescence (Figure 3c and 3d).
CARA and MIC90 data are usually plotted together (Figure 4). Representative data for replicating- and non-replicating-active molecules tested by MIC90 and CARA are shown in Figure 4. There are 4 major activity classes for molecules: 1) replicating bactericidal (demonstrated with isoniazid, Figure 4a); 2) replicating bacteriostatic (demonstrated with linezolid, Figure 4b); 3) non-replicating bactericidal (demonstrated with oxyphenbutazone, Figure 4c); and, 4) replicating-active (bacteriostatic or bactericidal) and non-replicating bactericidal (demonstrated with PA-824, Figure 4d). Importantly, Figures 4a and 4b demonstrate that while isoniazid and linezolid appear to have activity against non-replicating bacteria by the MIC90 assay, the CARA suggests they are inactive under the non-replicating conditions tested. To test the utility of the CARA in predicting a molecule's time- and concentration-dependent impact, replicating M. smegmatis was exposed to increasing concentrations of rifampicin (Figures 5a-d), and at various times between 1-24 hr, aliquots were spotted onto CARA plates. These data indicated that rifampicin exerted an impact as early as 1 hr (Figure 5a), displayed increasing bactericidal activity between 3 and 24 hr (Figures 5b-d), and killed ≥2-3 log10 at ~10 μg/ml by 24 hr (Figure 5d). A similar experiment testing quadruplicates of a vehicle control and 9 drug concentrations, and at 4 time points, would be prohibitive by a standard CFU-based assay.
Thus, the CARA has a role in drug discovery as a medium-throughput, rapid mechanism to identify a molecule's activity profile. CARA predictions should be rigorously evaluated using a standard CFU assay. The addition of 0.4% activated charcoal to Petri plates for CFU analysis may help improve correlation to CARA data, and may result in more accurate CFU counts, the magnitude of the correction generally being proportional to the compound's potency21,22.
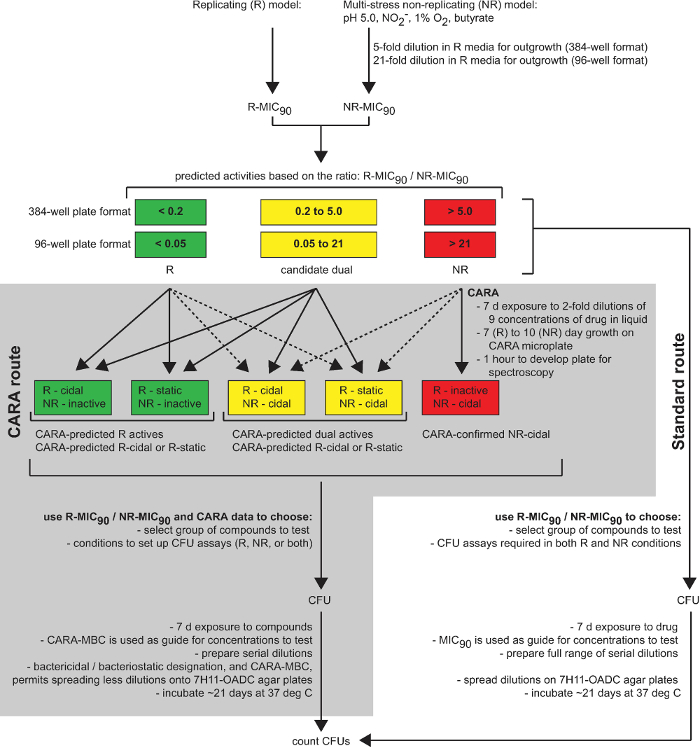
Figure 1: The CARA is a predictive tool in drug discovery. This diagram summarizes the utility of the CARA as an intermediate stage between drug screening (single point screening, cherry-picking, and dose-response assays) and time-consuming hit-to-lead assays (CFU assays and target identification). [Adapted with permission from Gold et al., Antimicrobial Agents and Chemotherapy, 2015 7] Please click here to view a larger version of this figure.
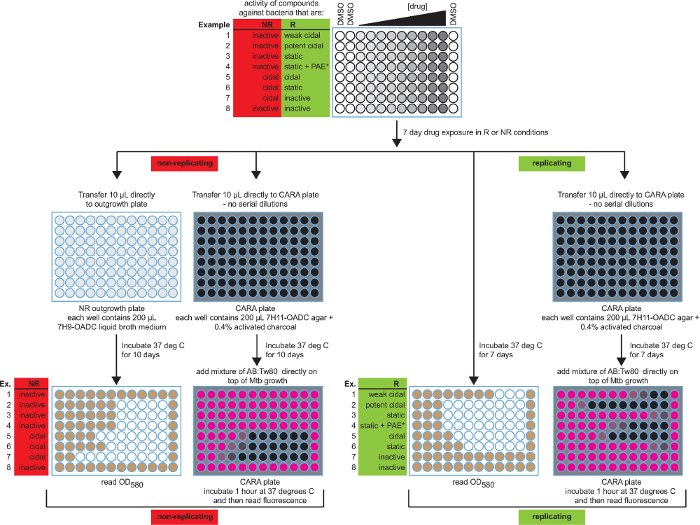
Figure 2: Schematic of the broth MIC90 assay and CARA with anticipated results. Both MIC90 and CARA results are presented for 8 possible activities. The color-coding for MIC90 microplate wells is white (no growth) and brown (growth), and for CARA microplates is black (no fluorescence) and pink (resorufin fluorescence). Data are hypothetical. [Adapted with permission from Gold et al., Antimicrobial Agents and Chemotherapy, 2015 7] Please click here to view a larger version of this figure.
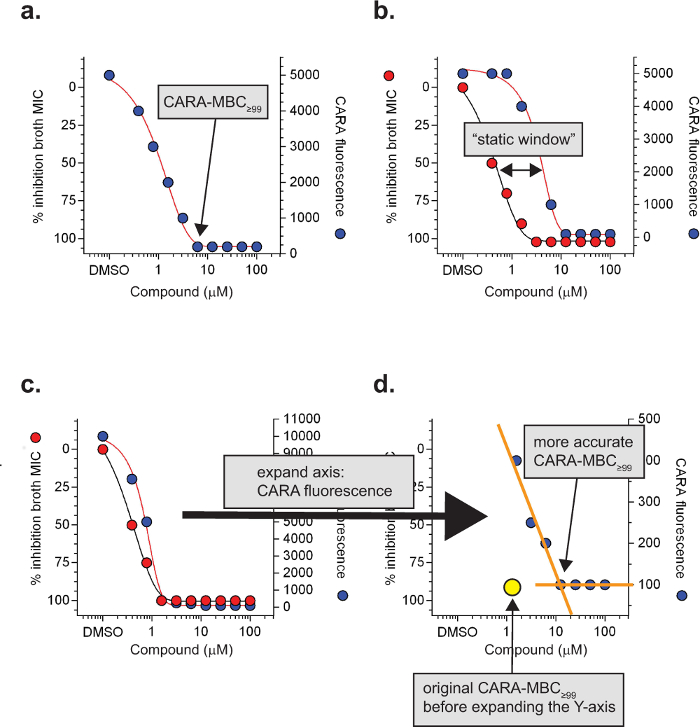
Figure 3: Specialized CARA terms and definitions. The minimal bactericidal concentration of a molecule resulting in background levels of CARA fluorescence is the CARA-MBC≥99 (a). Under replicating conditions, a ≥4-fold shift of the CARA-MBC≥99 to the right of the MIC90 often indicates bacteriostatic activity and is called a "static window" (b). For molecules with a potent post-antibiotic effect, static windows may be difficult to observe (c) and require expansion of the Y-axis (CARA fluorescence) to visualize (d). Data are hypothetical. [Adapted with permission from Gold et al., Antimicrobial Agents and Chemotherapy, 2015 7] Please click here to view a larger version of this figure.
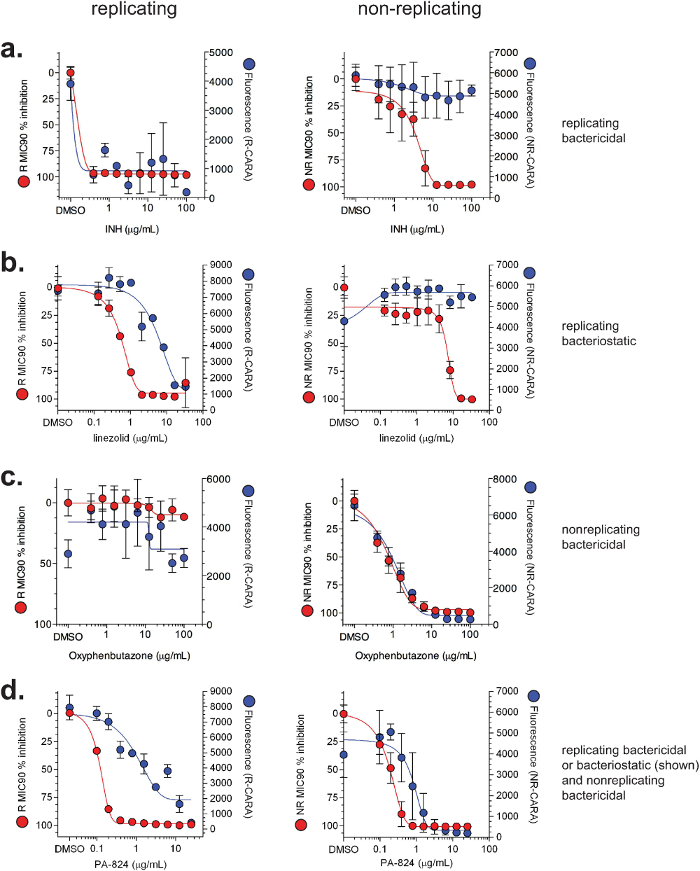
Figure 4: Illustrative MIC90 and CARA results for select compounds. Data for MIC90 (red) and CARA (blue) are demonstrated for (a) isoniazid (INH), (b) linezolid, (c) oxyphenbutazone, and (d) PA-824. Wild-type M. tuberculosis H37Rv was exposed to compounds for 7 days under standard replicating conditions or the multi-stress model of non-replication7-9. MIC90 assays and CARA were performed as shown in Figure 2. [Adapted with permission from Gold et al., Antimicrobial Agents and Chemotherapy, 2015 7] Please click here to view a larger version of this figure.
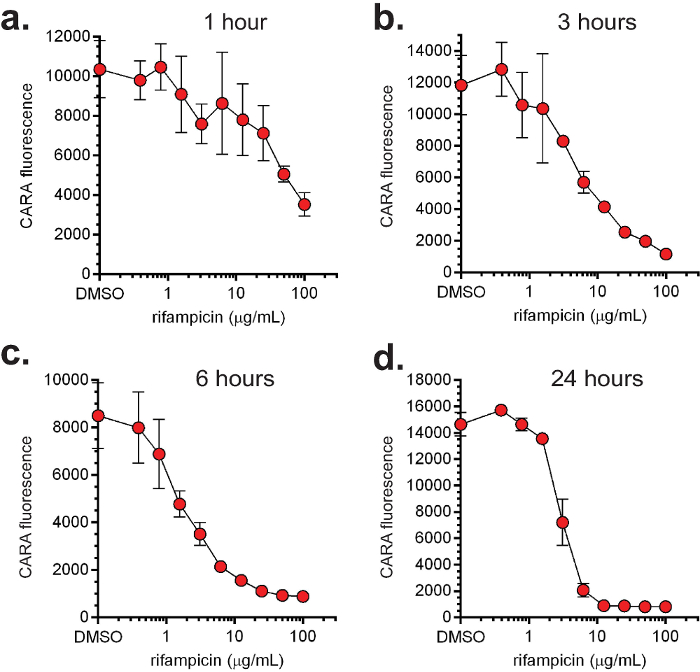
Figure 5: Dose- and time-dependent activity of rifampicin. The non-pathogenic, fast-growing M. smegmatis was exposed to increasing concentrations of rifampicin under replicating conditions and aliquots were sampled for CARA at 1 (a), 3 (b), 6 (c) and 24 (d) hr. [Adapted with permission from Gold et al., Antimicrobial Agents and Chemotherapy, 2015 7] Please click here to view a larger version of this figure.
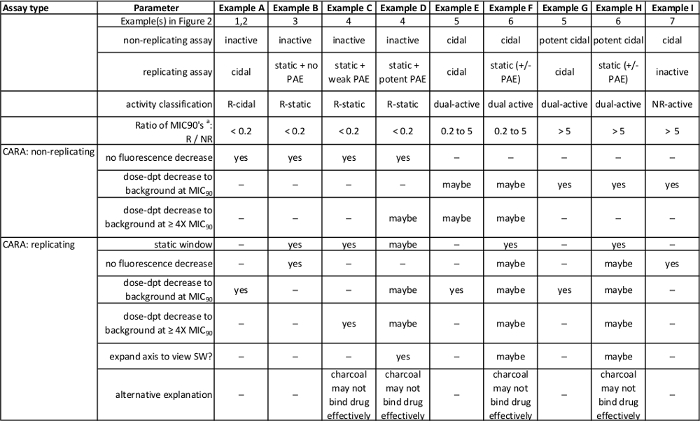
Table 1: Summary of anticipated results in Figure 2. [Adapted with permission from Gold et al., Antimicrobial Agents and Chemotherapy, 2015 7] Please click here to view a larger version of this table.
Discussion
Loading...
$$\rightleftharpoonup{xx}$$
$$\longleftharp{xx}$$,
$$\longrightharp{xx}$$,
The CARA was originally developed to alleviate a bottleneck in progressing non-replicating or dual-active molecules7. The CARA serves as an intermediate step between concentration-response confirmation of primary screening hits and CFU assays (Figure 1). Since a single CARA plate can replace numerous microtiter plates required to prepare serial dilutions, and agar-containing Petri plates used to enumerate surviving bacteria, the CARA provides a simple means to rapidly assess a molecule's activity and test multiple variables at once, including compound concentration and time of exposure to the compound.
In a CFU assay, in addition to serial dilutions that often range up to 106-fold, the agar plate typically dilutes molecules by an additional ~800-fold (10 μl onto 8 ml in a tri-style Petri plate). Our two-stage, multi-stress screening assay for compounds active on non-replicating M. tuberculosis has a carry-over factor of 5-fold, that is, a compound present in the non-replicating stage of the assay is present at one-fifth the original concentration in the outgrowth (replicating) phase of the assay6-9. The CARA mitigates carry-over effects by sequestering small molecules with activated charcoal. The majority of tuberculosis drugs and clinical candidates bind activated charcoal rapidly and completely, with the exception of the aminoglycoside streptomycin7. Inclusion of activated charcoal in agar plates for CFU assays prevented bacterial growth inhibition, or bacterial kill, by carried-over TMC207 and PA-8247,21,22. Thus, by virtue of incorporating activated charcoal in the bacteriologic agar, the CARA is not dependent on serial dilutions of cells and test agent.
The CARA can help predict bacteriostatic or bactericidal impact of replicating actives and bactericidal impact of non-replicating actives. In general, the CARA is used in parallel with standard MIC90 assays. The predictive power of the CARA comes from comparing MIC90 and CARA results (Figure 2 and Table 1). When used to study anti-mycobacterial agents, the CARA can accurately predict activity that is replicating bactericidal (Figure 4a), replicating bacteriostatic (Figure 4b), non-replicating bactericidal (Figure 4c), or dual active (Figure 4d). The CARA also permits simple evaluation of a compound's activity across both dose and time. CFU assays alone require a lot of effort and material to assess activity of a compound over a wide range of doses and times, but the task becomes manageable when CARA results narrow the range of conditions to those in which the compound is demonstrably active (Figure 5).
While the CARA has utility in studying the action of anti-infectives on mycobacteria, the assay has limitations. The CARA has a narrow dynamic range (2-3 log10) and may not be appropriate for conditions in which one anticipates there may not be more than 2 to 3 log10 bacterial kill. CARA predictions require further study using a more stringent and accurate method to enumerate bacterial numbers, such as a CFU assay. The post-antibiotic effect of some anti-infectives, such as PAS, can confound the CARA as a predictive tool to distinguish between compounds with bactericidal and bacteriostatic activity against replicating M. tuberculosis7.
There are two recommendations to improve the quality of the CARA. First, one must pour CARA microplates rapidly before the agar solidifies, while maintaining volumetric accuracy and avoiding splashing outside of microwells. Regardless of the number of plates required, we recommend making 0.5 to 1 L batches of medium to help maintain the medium in liquid form for the duration of the time required to pour plates. Changing tips frequently while filling microplates with medium avoids using partially clogged tips. Second, one must minimize artifactual variability in fluorescence between replicates. Mycobacterial microcolonies, in particular for pathogenic mycobacteria such as M. tuberculosis, often grow erratically. For example, microcolonies growing on the agar surface may vary in size, shape, height, or may extend up to the interior walls of microplate wells. One challenge is to cover all bacilli uniformly with the developing reagent. Another hurdle is that after prolonged incubation at 37 °C, the solid bacteriologic medium of the CARA microplates may become dry and prone to absorbing the developing reagent. Since activated charcoal can bind resazurin and quench fluorescence7, there may be well-to-well variation due to dry wells absorbing the resazurin developing solution and the activated charcoal quenching resazurin fluorescence. Pre-wetting the surface of all CARA microplate wells with PBS immediately before adding the developing reagent mitigates both of these problems — the developing reagent will reach all mycobacterial colonies equally, and the resazurin remains safely above the activated charcoal. The CARA may have applications in identifying and characterizing phenotypes of mycobacterial mutants, or in medium-throughput drug discovery assays for other bacterial species.
Disclosures
Loading...
$$\rightleftharpoonup{xx}$$
$$\longleftharp{xx}$$,
$$\longrightharp{xx}$$,
There are no conflicts of interest to disclose.
Acknowledgements
Loading...
$$\rightleftharpoonup{xx}$$
$$\longleftharp{xx}$$,
$$\longrightharp{xx}$$,
We are grateful to Kristin Burns-Huang for expert review of the manuscript and J. David Warren (Weill Cornell Medical College) for chemistry assistance while developing the CARA. This work was supported by the TB Drug Accelerator Program of the Bill and Melinda Gates Foundation, the Abby and Howard P. Milstein Program in Translational Medicine, and an NIH TB Research Unit (U19 AI111143). The Department of Microbiology and Immunology is supported by the William Randolph Hearst Foundation. SSK was supported by NIH grant K08AI108799.
Materials
| Name | Company | Catalog Number | Comments |
|---|---|---|---|
| Middlebrook 7H9 | Beckton Dickinson | 271310 | |
| Middlebrook 7H11 | Beckton Dickinson | 298810 | |
| Middlebrook OADC | Beckton Dickinson | 212351 | |
| BSA, heat shock | Roche | 3118958001 | |
| activated charcoal | Sigma | C5510 | |
| PBS, Dulbecco's Ca2+ and Mg2+ free | Life Technologies / Invitrogen | 14190-144 | |
| tween 80 | Sigma | P8074 | |
| tyloxapol | Sigma | T8761 | |
| sodium nitrite | Sigma | 2252 | |
| rifampicin | Sigma | R3501 | |
| 6-bromo-1H-indazol-3-amine | Alfa Aesar | H34095 | |
| potassium phosphate monobasic | Sigma | P0662 | |
| magnesium sulfate, heptahydrate | Sigma | M1880 | |
| ferric ammonium citrate | Sigma | F5879 | |
| zinc sulfate, heptahydrate | Sigma | Z0251 | |
| ammonium chloride | Sigma | A9434 | |
| butyric acid, liquid | Sigma | B103500 | |
| resazurin powder | Sigma | R7017 | |
| sodium chloride | J.T. Baker | 4058-01 | |
| prepared resazurin solution | Invitrogen | DAL1100 | |
| PCR stickers | Denville | B1212-5 | |
| spectrophotometer | Molecular Devices | M5 | |
| 96-well, tissue culture treated microplates | Corning | 3595 | |
| reagent reservoirs | VWR | 89094-678 | |
| resealable plastic bags | VWR | 395-94602 | |
| 14 ml Polypropylene round-bottom tubes | Corning | 352059 | |
| 50 ml conical centrifuge tube | Corning | 352070 | |
| 75 cm2 Cell culture flask | Corning | 431464U | |
| clear, flat bottom tissue culture treated 96-well microplate | Costar | 3595 | |
| Prism 6 for OS X | GraphPad | http://www.graphpad.com/scientific-software/prism/ |
References
Loading...
$$\rightleftharpoonup{xx}$$
$$\longleftharp{xx}$$,
$$\longrightharp{xx}$$,
- Nathan, C. Fresh approaches to anti-infective therapies. Sci. Transl. Medicine. 4 (140), 140-142 (2012).
- Gomez, J. E., McKinney, J. D. M. tuberculosis persistence, latency, and drug tolerance. Tuberculosis (Edinb). 84, 29-44 (2004).
- Balaban, N. Q., Merrin, J., Chait, R., Kowalik, L., Leibler, S. Bacterial persistence as a phenotypic switch. Science. 305, 1622-1625 (2004).
- Bigger, J. Treatment of staphylococcal infections with penicillin by intermittent sterilisation. Lancet. , 497-500 (1944).
- Bryk, R., et al. Selective killing of nonreplicating mycobacteria. Cell Host Microbe. 3, 137-145 (2008).
- Gold, B., et al. Nonsteroidal anti-inflammatory drug sensitizes Mycobacterium tuberculosis to endogenous and exogenous antimicrobials. Proc. Natl. Acad. Sci. U.S.A. 109, 16004-16011 (2012).
- Gold, B., et al. Rapid, semi-quantitative assay to discriminate among compounds with activity against replicating or non-replicating Mycobacterium tuberculosis. Antimicrob. Agents Chemother. 59, 6521-6538 (2015).
- Gold, B., Warrier, T., Nathan, C. Mycobacteria Protocols, Methods in Molecular Biology. Parish, T., Roberts, D. 1285, Springer. 293-315 (2015).
- Warrier, T., et al. Identification of Novel Anti-mycobacterial Compounds by Screening a Pharmaceutical Small-Molecule Library against Nonreplicating Mycobacterium tuberculosis. ACS Infect. Dis. , 580-585 (2015).
- Zheng, P., et al. Synthetic Calanolides with Bactericidal Activity Against Replicating and Nonreplicating Mycobacterium tuberculosis. J. Med. Chem. Chem, J. .M. ed. , (2014).
- Darby, C. M., et al. Whole cell screen for inhibitors of pH homeostasis in Mycobacterium tuberculosis. PLoS One. 8, e68942(2013).
- Darby, C. M., Nathan, C. F. Killing of non-replicating Mycobacterium tuberculosis by 8-hydroxyquinoline. J. Antimicrob. Chemother. 65, 1424-1427 (2010).
- de Carvalho, L. P., Darby, C. M., Rhee, K., Nathan, C. Nitazoxanide Disrupts Membrane Potential and Intrabacterial pH Homeostasis of Mycobacterium tuberculosis. ACS Med. Chem. Lett. 2, 849-854 (2011).
- Xie, Z., Siddiqi, N., Rubin, E. J. Differential antibiotic susceptibilities of starved Mycobacterium tuberculosis isolates. Antimicrob. Agents Chemother. 49, 4778-4780 (2005).
- Grant, S. S., et al. Identification of novel inhibitors of nonreplicating Mycobacterium tuberculosis using a carbon starvation model. ACS Chem. Biol. 8, 2224-2234 (2013).
- Zhang, M., et al. Streptomycin-starved Mycobacterium tuberculosis 18b, a drug discovery tool for latent tuberculosis. Antimicrob. Agents Chemother. 56, 5782-5789 (2012).
- Mak, P. A., et al. A high-throughput screen to identify inhibitors of ATP homeostasis in non-replicating Mycobacterium tuberculosis. ACS Chem. Biol. 7, 1190-1197 (2012).
- Cho, S. H., et al. Low-oxygen-recovery assay for high-throughput screening of compounds against nonreplicating Mycobacterium tuberculosis. Antimicrob. Agents Chemother. 51, 1380-1385 (2007).
- Franzblau, S. G., et al. Comprehensive analysis of methods used for the evaluation of compounds against Mycobacterium tuberculosis. Tuberculosis (Edinb). 92, 453-488 (2012).
- Rebollo-Lopez, M. J., et al. Release of 50 new, drug-like compounds and their computational target predictions for open source anti-tubercular drug discovery. PLoS One. 10, e0142293(2015).
- Tasneen, R., et al. Contribution of the nitroimidazoles PA-824 and TBA-354 to the activity of novel regimens in murine models of tuberculosis. Antimicrob. Agents Chemother. 59, 129-135 (2015).
- Grosset, J. H., et al. Assessment of clofazimine activity in a second-line regimen for tuberculosis in mice. Am. J. Respir. Crit. Care Med. 188, 608-612 (2013).
- Shiloh, M. U., Ruan, J., Nathan, C. Evaluation of bacterial survival and phagocyte function with a fluorescence-based microplate assay. Infect. Immun. 65, 3193-3198 (1997).
- Wang, F., et al. Identification of a small molecule with activity against drug-resistant and persistent tuberculosis. Proc. Natl. Acad. Sci. U.S.A. 110, E2510-E2517 (2013).
- Wayne, L. G., Hayes, L. G. An in vitro model for sequential study of shiftdown of Mycobacterium tuberculosis through two stages of nonreplicating persistence. Infect. Immun. 64, 2062-2069 (1996).
- Barry, A. L., et al. Methods for determining bactericidal activity of antimicrobial agents: approved guideline. 19, National Committee for Clinical Laboratory Standards. (1999).
Reprints and Permissions
Request permission to reuse the text or figures of this JoVE article
Request Permission