This manuscript describes how to screen for thermostabilizing mutations, purify the human serotonin transporter, generate high affinity antibodies, and crystallize the serotonin transporter-antibody complex bound to the antidepressant drug S-citalopram. This protocol can be adapted to the study of other challenging membrane transporters, receptors, and channels.
Method Article
Thermostabilization, Expression, Purification, and Crystallization of the Human Serotonin Transporter Bound to S-citalopram
In This Article
Summary
Abstract
The serotonin transporter is a sodium and chloride-coupled transporter that "pumps" extracellular serotonin into cells. S-citalopram is a drug used to treat depression and anxiety by binding to the serotonin transporter with high-affinity, blocking serotonin reuptake. Here we report an efficient procedure and a set of tools to stabilize, express, purify, and crystallize serotonin transporter-antibody complexes bound to S-citalopram and other antidepressants. Mutations which stabilize the serotonin transporter were identified using an S-citalopram binding assay. Serotonin transporter expressed in baculovirus-transduced HEK293S GnTI- cells, was reconstituted into proteoliposomes and used to raise high-affinity antibodies. We have developed a strategy to discover antibodies that are useful for structural studies. A straightforward approach for the expression of antibody fragments in Sf9 cells has also been established. Transporter-antibody complexes purified using this procedure are well-behaved and readily crystallize, producing complexes with S-citalopram that diffract X-rays to 3-4 Å resolution. The strategies developed here can be utilized to determine the structure of other challenging membrane proteins.
Introduction
The serotonin transporter (SERT) is an integral membrane protein that facilitates the transport of serotonin across cellular membranes1. SERT belongs to a family of Neurotransmitter Sodium Symporters (NSSs) which also includes the dopamine and norepinephrine transporters2. SERT is the molecular target of widely prescribed antidepressant and anti-anxiety drugs which act to competitively inhibit serotonin transport3. SERT exploits the energetically favorable cotransport of sodium to remove neurotransmitter from the synaptic cleft. Extensive characterization of the serotonergic system has shown that changes in serotonin metabolism appear to influence virtually all neurological processes including mood, sleep, pain, cognition, and aggression behaviors4. SERT function can be modified through the use of antidepressants and Selective Serotonin Reuptake Inhibitors (SSRIs) like S-citalopram, as well as by psychostimulants and drugs of addiction such as amphetamine and 3,4-methylenedioxy-N-methylamphetamine or "ecstasy"1,2.
SSRIs are tremendously important for the treatment of mood disorders, yet the precise structural basis for their action is not well understood. WT SERT is unstable in detergent micelles, thus impeding progress towards a three-dimensional (3D) structure of SERT5,6. Recently, we developed variants of SERT which are robustly stable in a wide range of detergents and retain SSRI binding activity6. These thermostable SERT variants were selected using a scintillation proximity-based thermostability assay. Here we describe a procedure for the generation of high-affinity antibodies which can bind SERT, and the purification and crystallization of thermostable SERT, in complex with antibody and S-citalopram.
This protocol assumes that the SERT and 8B6 genes have been successfully cloned into the BacMam7 and insect expression vectors, respectively. To generate antibodies, cDNA encoding residues 73-616 of WT SERT was cloned into the BacMam vector with a C-terminal Strep II tag (SERTIC). For the thermostability screen, SERT residues 73-616 with C-terminal GFP, Strep II, and 10-His tags (SERTTC) was used. Individual point mutations were generated in the SERTTC background. For the crystallization protocol, the SERT-GFP fusion protein was used with Twin-Strep [TrpSerHisProGlnPheGluLys(GlyGlyGlySer)2GlyGlySerAlaTrpSerHisProGlnPheGluLys] and 10-His tags, carrying the thermostable mutants, Y110A, I291A, and T439S and mutations of surface cysteines C554A, C580A, and C622A (SERTCC). Thrombin cleavage sequences (LVPRGS) were also inserted in the SERTCC after Q76 and T618 to allow removal of the N- and C-termini. The plasmid encoding the 8B6 Fab was engineered to express both the heavy and light chains of the antibody with GP67 secretion sequences under the control of two separate polyhedrin promoters. The C-terminus of the heavy chain of the 8B6 antibody was tagged with an 8-His tag and a thrombin cleavage site was inserted between the heavy chain and the tag.
Protocol
1. Transfection of Adherent HEK293S GnTI- Cells for Thermostability Screen
- Prepare Poly-D-Lysine (PDL)-coated 96-well plates. Perform all work in a sterile laminar flow hood.
- Filter a 25 µg/mL solution of (PDL), molecular weight 70,000-150,000 Da, using a 0.2 µm sterile filter. Add 50 µL of PDL to each well of a 96-well Tissue Culture (TC) plate, ensuring the bottom is evenly coated, and incubate at RT for 30 min.
- Aspirate PDL solution and wash with 200 µL of sterile water.
- Allow plate to air dry for 2 h prior to storage at 4 °C. PDL coated plates can be stored at 4 °C for several weeks.
- Trypsinization of adherent HEK293S cells.
- Grow HEK293S to 80% confluency in a 10 cm dish maintained at 37 °C with 8% CO2. A single 10 cm dish should have approximately 10 million HEK293S cells. Do not use cells after 30 passages!
- Aspirate media and wash with 5 mL of Phosphate-Buffered Saline (PBS). Add 1 mL of Trypsin-EDTA solution (0.25% trypsin, 0.02% EDTA) to cells and incubate for 2 min at 37 °C.
- Add 10 mL of Dulbecco's Modified Eagle Medium (DMEM) supplemented with 10% Fetal Bovine Serum (FBS) and resuspend cells by repeatedly pipetting up and down using a serological pipette.
- Pipette 10 µL of cells and mix with 10 µL of Trypan Blue solution (0.4%). Determine cell density using a hemocytometer and a light microscope. Do not count cells that are stained blue as they are dead. Ensure that cell viability is above 90%.
- Thoroughly resuspend trypsinized HEK293S GnTI- cells in DMEM supplemented with 10% FBS to a density of 0.5 x 10⁶ cells/mL in a disposable pipette reservoir. Approximately 5 million HEK293S cells will be needed for each plate. A total of 24 constructs can be transfected on each plate using this protocol.
- Using a multichannel pipette, add 100 µL of cells to each well of a PDL coated plate. Resuspend cells in the pipette reservoir after filling each plate to ensure an even distribution of cells. Incubate cells in a 37 °C incubator with 8% CO2. After 24 h, cells should reach approximately 80% confluency.
- 1 h prior to transfection replace media. Prepare DNA-transfection reagent complexes for transfection.
- For each construct in the SERTTC background to be screened, mix 450 ng DNA with 45 µL of serum-free DMEM and mix. Add 1.6 µL of the transfection reagent to 45 µL of serum-free DMEM and mix.
- Immediately add diluted transfection reagent solution to DNA solution and mix. Do not mix solutions in the reverse order. Wait 10 - 15 min and add 20 µL of transfection reagent/DNA mixture to 4 wells.
- Once all wells have been transfected, mix plate by gently rocking back and forth and return to the 37 °C incubator.
- After 16 - 24 h replace media with DMEM containing serum and 10 mM sodium butyrate.
- Approximately 48 h post transfection remove media and either immediately proceed with thermostability screen or freeze cells at -80 °C to be used later. Cells can be stored at -80 °C for several weeks.
2. Scintillation Proximity-based Thermostability Screen with S-citalopram
- Incubate cells with 200 nM S-citalopram in 25 µL of TBS (Tris-Buffered Saline — 20 mM Tris, pH 8, 100 mM NaCl) for 5 min at RT.
- Solubilize cells by adding 25 µL of 8 mM n-dodecyl-β-D-maltopyranoside (C12M), 1 mM cholesteryl hemmisuccinate (CHS), protease inhibitor cocktail (2 mM phenylmethanesulfonyl fluoride (PMSF), 0.1 mg/mL aprotinin, 4 g/mL pepstatin A, and 4 µg/mL leupeptin) in TBS, and incubating for 1 h at RT.
- Add 50 µL of TBS with 20 nM [3H]citalopram (81.7 Ci/mmol), 0.1% bovine serum albumin, and 2 mg/mL His-tag affinity scintillation proximity assay (SPA) beads to three wells for each construct. For the last well add the same solution listed but supplement with 100 µM sertraline to determine nonspecific binding. Ensure that His-tag affinity SPA beads are thoroughly mixed when adding to the 96-well plate.
- Measure [3H]citalopram binding using a 96-well scintillation counter at RT with a 1 min count time per well. Continue counting plates until total counts plateau (approximately after 36 h).
- Heat plates for 15 min in a heating block with a heated lid at 33 °C. Measure [3H]citalopram binding again after heating as described in 2.4.
- Repeat step 2.4 - 2.5 and change the heating step to 36 °C, 39 °C, 45 °C, 48 °C, and 51 °C. Adjust heating temperatures depending on the apparent melting temperature (Tm) of the target protein and the thermostability of the most stable construct. Continue to heat plates until all constructs have low specific counts.
- Analyze data to determine Tm values.
- Determine the average total counts per min (CPM) of each construct for wells that do not contain sertraline by averaging the 3 replicate wells. Determine the nonspecific CPM by averaging the CPM of each well containing sertraline in a single plate.
- Calculate specific CPM by subtracting the nonspecific CPM from the total CPM.
- Calculate the Tm by a non-linear fit to a Boltzmann sigmoidal function. Constructs with low specific CPM at RT (<10% of WT) generally do not have accurate Tm values. Mutations from the most thermostable constructs can be combined together and screened for additive increases in thermostability.
3. Expression of the Human Serotonin Transporter in HEK293S GnTI- Cells
- Transform chemically competent DH10Bac cells with 1 ng of plasmid.
- Add plasmid to 50 µL of DH10Bac cells and incubate on ice for 30 min.
- Heat shock DH10Bac cells at 42 °C for 30 sec. Add 200 µL of SOC medium and incubate at 37 °C for 4 h with shaking.
- Plate all of the bacteria onto a Luria Broth (LB) plate containing 50 µg/mL kanamycin, 7 µg/mL gentamicin, 10 µg/mL tetracycline, 100 µg/mL 5-bromo-3-indolyl β-D-galactopyranoside, and 40 µg/mL isopropyl β-D-1-thiogalactopyranoside (IPTG).
- Isolate lacZ- colonies (white colonies) grown at 37 °C for 2 d on LB agar plates.
- Grow several colonies O/N at 37 °C in 5 mL of LB containing antibiotics and isolate bacmid DNA.
- Spin down bacteria at 1,000 x g in a centrifuge for 5 min. Discard supernatant. Resuspend bacteria with 200 µL of miniprep resuspension buffer.
- Lyse bacteria by adding 200 µL of miniprep lysis buffer and inverting tube gently 10 times. Add 200 µL of neutralization buffer.
- Remove insoluble fraction by spinning at 14,000 x g for 10 min in a centrifuge. Add 1 mL of isopropanol to supernatant and chill at -20 °C for 20 min to precipitate DNA.
- Spin at 14,000 x g for 15 min in a centrifuge and discard supernatant.
- Wash DNA pellet with 70% EtOH and spin again at 14,000 x g for 15 min. Discard supernatant. Air dry DNA until all EtOH has evaporated and resuspend in 50 µL of water.
NOTE: Bacmid DNA should be transfected into Sf9 cells immediately for best results but may also be stored at -20 °C for several weeks.
- Transfect bacmid DNA into 1x10⁶ cells of adherent Sf9 grown in a humidified chamber at 27 °C in a 6-well dish. Perform all cell culture manipulations in a sterile laminar flow hood.
- Remove media from cells and add 2 mL of fresh Sf9 media. Add 5 µg of bacmid DNA to 100 µL of Sf9 media (Solution A).
- Add 8 µL of a cationic-lipid Sf9 transfection reagent to 100 µL of Sf9 media (Solution B). Incubate tube containing Solution B for 5 min.
- Mix tube containing Solution A with Solution B and incubate at RT for 30 min and add all of the solution to the Sf9 cells.
- After 96 h, harvest supernatant (P1 virus) by passing through a 0.2 µm filter. The P1 virus may be stored for several months at 4 °C in the dark and reused to make P2 virus as needed.
- Add 100 µL of P1 virus to 1 L of Sf9 cells at a density of 1 x 10⁶ cells/mL in Sf9 media. Infect cells for 96 h, growing at 27 °C on a shaker at 100 rpm.
- Spin down cells in a centrifuge at 4,000 x g for 15 min and filter supernatant containing virus particles through a 0.2 µm filter. Discard cell pellet. Determine viral density using a viral plaque assay or a virus counter. The virus density should be >1 x 10⁸ virus particles per milliliter. P2 virus can be stored at 4 °C in the dark and used for several months.
- Infect 10 L of HEK293S GnTI- cells7 growing in suspension at 37 °C with 8% CO2 and 85% humidity on a shaker at 130 rpm in 293 expression media supplemented with 2% FBS at a multiplicity of infection (MOI) of 2 and a density of 3 x 10⁶ cells/mL, typically 30 - 50 mL of P2 virus per 800 mL of cells in a 2 L baffled flask.
NOTE: It is not recommended to use more than 80 mL of P2 virus since the HEK293S GnTI- cells will grow slowly and may become unviable due to a change in pH. Sf9 media is more acidic than the 293 expression media. - 12 - 16 h post-infection, add sodium butyrate to a concentration of 10 mM from a 1 M stock. 48 - 60 h post-infection, harvest cells by centrifugation at 4,000 x g for 15 min. Remove the supernatant.
- Resuspend cells in 150 mL of TBS, 2 µM S-citalopram or other SERT inhibitors and store at -80 °C until ready for purification.
4. Affinity Purification of the Serotonin Transporter for Immunization and Crystallization
- Thaw cells from 10 L of culture in warm water (approximately 30 °C) and resuspend by rapidly passing through a 10 mL pipette until homogeneous.
- Prepare detergent solution for solubilization (150 mL): 80 mM Tris, pH 8, 150 mM NaCl containing 40 mM C12M, 5 mM CHS, and protease inhibitor cocktail.
- Add all of the cells to a beaker with a stir bar and add all of the detergent solution to the cells while stirring. Solubilize at 4 °C for 1 h with stirring.
- Spin lysate at 8,000 x g for 15 min at 4 °C. Discard pellet and decant supernatant into clean ultracentrifuge tubes. Spin at 100,000 x g for 1 h in an ultracentrifuge. Discard pellet and filter supernatant through a 0.2 µm filter.
- Pass lysate over 10 mL of Strep affinity resin packed into a column using a peristaltic pump equilibrated in wash buffer: 1 mM C12M, 0.2 mM CHS, 5% glycerol, 25 µM lipid (1-palmitoyl-2-oleoyl-sn-glycero-3-phosphocholine, 1-palmitoyl-2-oleoyl-sn-glycero-3-phosphoethanolamine, and 1-palmitoyl-2-oleoyl-sn-glycero-3-phosphoglycerol at a molar ratio of 1:1:1), and 1 µM S-citalopram or SSRI in TBS.
- Connect Strep affinity column to a Fast Protein Liquid Chromatography (FPLC) system and wash column at 2 mL/min with 66 mL (6.6 column volumes) of wash buffer. Elute purified protein in same buffer supplemented with 5 mM desthiobiotin at 0.5 mL/min using 33 mL (3.3 column volumes) of buffer. Collect 1 mL fractions; the peak fractions will be ~10 mL. Purified protein may be stored at 4 °C for 2 - 3 d if desired.
NOTE: Total yield will be 3 - 4 mg of SERTCC and 1 mg of SERTIC. An absorbance of 2 AU at 280 nm is equal to 1 mg/mL SERT.
5. Reconstitution of Transporter into Liposomes for Immunization
- Prepare liposomes containing asolectin:cholesterol:lipid A:brain polar lipid (molar ratio 60:17:3:20). Dissolve lipids in 1 mL of chloroform and add 40 mg of total lipid to a 100 mL glass round bottom flask at the indicated molar ratio.
- Evaporate chloroform for at least 1 h under vacuum with the round bottom flask rotating in warm water, approximately 30 °C.
- Rehydrate lipids by adding 10 mL of TBS. Incubate in buffer for 10 min.
- Freeze the lipid by placing the flask in liquid N2.
- Thaw. Immerse spherical bottom of the flask in a beaker filled with warm water, approximately 30 °C. Sonicate in a bath sonicator for 5 min.
- Vortex and repeat steps 5.1.3 - 5.1.4 10 times or until the lipid is completely resuspended from the bottom and forms a cloudy suspension.
- Extrude the entire lipid mixture twice through 200 nm filters. The lipid will appear as a milky suspension prior to extrusion; afterward it will be translucent. Do not add the entire lipid mixture to the extruder at once as it can become clogged, resulting in loss of sample.
- Spin lipids at 100,000 x g for 20 min and resuspend in 0.5 - 1 mL of TBS at a concentration of 40 mg/mL.
- Concentrate purified SERTIC to 250 - 500 µL using a 100 kDa MWCO centrifuge protein concentrator to 2 - 4 mg/mL and saturate liposomes with 5 mM C12M. Add purified SERT to the detergent:lipid mixture in 1 mL final volume.
- Remove C12M by 3 successive additions of 80 mg/mL hydrophobic absorption resin. For the first 2 additions, incubate with resin with rotation for 2 h at 4 °C. Remove resin by passing through glass wool. Perform the final incubation with resin overnight.
- Concentrate proteoliposomes by centrifugation at 100,000 x g for 20 min. Discard supernatant and resuspend pellet in 250 - 500 µL of TBS.
- Add 10 µM final concentration of S-citalopram to the reconstituted protein following the final removal of resin.
- Solubilize 2.5 µL of the proteoliposomes in SDS-PAGE loading buffer (62.5 mM Tris, pH 6.8, 10% glycerol, 2% SDS, 0.01% bromophenol blue, 100 mM DTT) and run on a SDS-PAGE gel at 200 V for 1 h to ensure that SERT has been successfully reconstituted. Proteoliposomes can be stored at -80 °C in aliquots for long term storage and thawed on ice prior to each immunization.
6. Screening for Antibodies Recognizing 3D Epitopes
- Screen hybridoma cell lines by western blot. Antibodies which recognize SERT by western blot likely bind linear epitopes and will likely not be useful for structural studies.
- Mix 1 µg of purified SERTIC or SERTCC and run on a 4 - 15% SDS-PAGE gel at 200 V for 1 h.
- Transfer to a nitrocellulose membrane at 200 mA for 30 min using Towbin buffer (25 mM Tris, 192 mM glycine, 20% (v/v) methanol, 0.1% SDS). The membrane can be dried and stored indefinitely at room temperature.
- Rewet membrane with 10% methanol, and wash with PBS (10 mM phosphate, pH 7.4, 137 mM NaCl, 2.7 mM KCl).
- Block with 5% powdered milk in PBS for 30 min at RT.
- Wash with PBS and incubate with 1 µg/mL of antibody in PBS with 0.1% milk.
- Wash extensively with PBS containing 0.1% Tween-20.
- Incubate with goat anti-mouse antibody conjugated to an IR dye diluted 1:10,000 in PBS with 0.1% Tween 20 and 0.1% milk.
- Wash extensively and scan using an imaging system.
- Mix hybridoma supernatant containing western negative antibodies with 100 nM SERTCC protein using a molar ratio of 1:2 (SERT:mAb) in 200 µL TBS with 1 mM C12M, 0.2 mM CHS, and 1 µM S-citalopram. Centrifuge at 100,000 x g for 20 min. Analyze supernatant containing SERT-mAb complexes and analyze by Fluorescence-detection Size Exclusion Chromatography (FSEC)8. Discard the pellet.
- Run 100 µL of supernatant on a size exclusion column at 0.5 mL/min using a High Performance Liquid Chromatography (HPLC) system equipped with a fluorescence detector (Excitation: 480 nm, Emission: 510 nm) using a running buffer containing TBS, 0.4 mM lauryl maltose neopentyl glycol, and 1 µM S-citalopram. Antibodies which form complexes will cause the GFP-fusion protein to elute earlier than the free transporter from the size-exclusion column.
- Dilute complexes to 10, 1, 0.1 nM in 200 µL TBS with 1 mM C12M, 0.2 mM CHS, and 1 µM S-citalopram and rerun FSEC. Antibodies which can still shift the transporter peak at low nanomolar concentrations are high affinity binders and good candidates for structural studies.
- Retest binding by FSEC in the presence of 1 mM serotonin. Antibodies which specifically recognize the SSRI bound conformation will not bind in the presence of the substrate. Antibodies which recognize a 3D epitope which does not change as a result of conformation will bind regardless of the ligand present.
- Mix pairwise different combinations of antibodies and test binding by FSEC. Antibodies which recognize distinct epitopes will cause SERT to elute earlier when combined together compared to binding of a single antibody.
- For initial structural studies, select the highest affinity antibodies which recognize 3D epitopes.
7. Expression of Antibody Fragment in Sf9 Cells
- Clone variable and constant domains of Fab by PCR into the insect expression system for expression in Sf9 cells using standard protocols.
- Transfect 1 x 10⁶ Sf9 cells with 5 µg of Bacmid DNA encoding the light and heavy chains of the 8-His tagged 8B6 Fab with a GP67 secretion sequence (as per section 3.4).
- Harvest P1 virus 96 h posttransfection and add 500 µL of P1 virus to 1 L of Sf9 cells at a density of 1 x 10⁶ cells/mL in a 2 L flask to make P2 virus. Infect cells for 96 h at 27 °C.
- Harvest P2 virus (as per section 3.6).
- Infect 6 L of Sf9 cells at a density of 2 - 3 x 10⁶ cells/mL with an MOI of 2 with P2 virus, typically 40 - 50 mL per flask with 1 L of Sf9 cells in each 2 L flask.
- Harvest cells approximately 96 h postinfection. Add 50 mL of phosphate buffer, pH 8 at a final concentration of 50 mM to the cells and spin at 4,000 x g for 20 min. Discard the cell pellet and filter supernatant through a 0.2 µm filter tangential flow cell. Collect supernatant and store at 4 °C for 2 - 3 days if desired.
8. Purification of Antibody Fragments from Sf9 Supernatant
- Concentrate Sf9 supernatant using a 30 kDa Molecular Weight Cut Off (MWCO) tangential flow cell to approximately 400 - 800 mL.
- Add imidazole, pH 8 at a final concentration of 10 mM and 10 mL of His-tag affinity resin. Stir in a beaker for 1 h at 4 °C.
- Collect His-tag affinity resin by centrifugation at 2,000 x g for 5 min. Discard supernatant.
- Pack His-tag affinity resin into a column and connect to an FPLC.
- Wash His-tag affinity resin at 2 mL/min with 66 mL (6.6 column volumes) of 50 mM phosphate pH 8, 150 mM NaCl, 25 mM imidazole.
- Elute 8B6 Fab in 33 mL of 50 mM phosphate pH 8, 150 mM NaCl, 250 mM imidazole. Collect 1 mL fractions.
- Dilute affinity purified Fab with a 10-fold volume of ice-cold 20 mM acetate, pH 5.
- Bind Fab to a 1 mL cation exchange column using a peristaltic pump at 1 mL/min.
- Separate Fab using a 30 mL linear gradient of NaCl (0 - 500 mM) in 20 mM acetate pH 5.5 using an FPLC. Fab will elute as a single peak at ~300 mM NaCl.
- Analyze on a 12.5% SDS-PAGE gel using sample buffer containing 100 mM DTT. The heavy and light chains of the 8B6 Fab will run at 27 and 25 kDa, respectively, on a reducing SDS-PAGE gel.
- Pool fractions containing Fab and concentrate to at least 10 - 15 mg/mL using a 30 kDa MWCO protein concentrator in a swinging bucket centrifuge at 3,000 x g.
- Adjust to pH 8 by adding 1 M Tris pH 8 to a final concentration of 50 mM and store purified Fab for long term at 4 °C. Total yield will be 25 - 30 mg. An absorbance of 1.4 AU at 280 nm is equal to 1 mg/mL of 8B6 Fab.
9. Formation of Transporter-antibody Complexes and Separation by Size Exclusion Chromatography
- For crystallization, purify the SERTCC by Strep affinity chromatography in C12M as described earlier (section 4).
- Digest with thrombin to remove tags (1:100 w/w) and EndoH (1:10 w/w) O/N at RT. Concentrate to 250 - 300 µL using a 100 kDa MWCO centrifuge protein concentrator to a protein concentration of 10 mg/mL.
- Mix concentrated SERT with Fab at a molar ratio of 1:1.2 in a volume less than 500 µL. Centrifuge at 100,000 x g at 4 °C for 20 min. Collect supernatant containing SERT-Fab complex. Discard pellet.
- Separate by Size Exclusion Chromatography (SEC) using an FPLC on a size exclusion column equilibrated in TBS supplemented with 40 mM n-octyl-β-D-maltoside (C8M), 0.5 mM CHS, 5% glycerol, 25 µM lipid (same as in step 4.5), and 1 µM S-citalopram at 0.5 mL/min.
- Collect 0.5 mL fractions and analyze on 4 - 15% SDS-PAGE gels as well as by tryptophan fluorescence by SEC. GFP tagged SERT will run at approximately 80 kDa on a SDS-PAGE gel. After removal of the termini and N-linked sugars it will run as a 45 kDa protein.
- Determine which fractions to combine by pooling only the fractions which are monodisperse as judged by analysis of the fractions by tryptophan fluorescence SEC (Excitation: 280, Emission: 335 nm).
- Store purified SERT-8B6 complex at 4 °C for up to 1 week.
10. Crystallization of Transporter-antibody Complexes by Hanging Drop
- Prior to crystallization, concentrate peak fractions from the SEC separation of the SERT-8B6 complex to 2 mg/mL using a 100 kDa MWCO centrifuge protein concentrator. An absorbance of 2 AU at 280 nm is equal to 1 mg/mL.
- Add additional Fab at a ratio of 1:0.05 complex:free Fab. Add 10 µM free S-citalopram.
- Centrifuge at 100,000 x g at 4 °C for 20 min. Collect supernatant containing the SERT-Fab complex. Discard pellet.
- Set up a hanging drop 24-well screen at 4 °C according to Table 1. Grow diffraction quality crystals over reservoir solutions containing 100 mM Tris-NaOH, pH 8.5, 25 - 125 mM KCl, 32.5 - 34% PEG 400, and 0.5% 6-aminohexanoic acid.
NOTE: Use Tris adjusted with NaOH to pH 8.5 as a buffer. Do not use Tris base adjusted with HCl. The screen may be prepared in 2 mL tubes and used until finished. Take care to accurately pipette PEG 400 using a positive displacement pipette as it is extremely viscous!- Pipette 500 µL of each reservoir solution in a low profile 24-well plate with sealant applied to each well. Pipette 1.5, 1.75, and 2 µL of the SERT-8B6 complex onto an 18 mm siliconized glass cover slip. Pipette 1 µL of reservoir solution on top of the protein sample.
NOTE: The plate was purchased with sealant already applied to the rim of the wells. - Apply cover slide to the 24-well with the drops facing the reservoir solution and seal immediately by pressing cover slip onto sealant pre-applied to each well.
- Continue until all 24-wells have been set up.
- Leave the finished plate in a well-insulated room at 4 °C. Do not disturb plates for at least 3 days
NOTE: Single crystals will appear within approximately 3 days and grow to 100-175 µm after 14 days.
- Pipette 500 µL of each reservoir solution in a low profile 24-well plate with sealant applied to each well. Pipette 1.5, 1.75, and 2 µL of the SERT-8B6 complex onto an 18 mm siliconized glass cover slip. Pipette 1 µL of reservoir solution on top of the protein sample.
- Harvest crystals in cryoloops and directly flash-cool in liquid N2 prior to X-ray diffraction data collection.
- If necessary, find additional crystallization conditions by broad screening with hanging drops. Use three drops with protein:precipitant ratios of 2:1, 1.5:1, 1:1. If a robot is available, then set up 100-150 nL drops over 70 µL of reservoir solution in a 96-well plate. Larger 3D crystals can be grown in 24-wells.
- Score based on the appearance of the drop: 0, clear; 1, dust; 2, granular precipitate; 3, phase separation; 4, microcrystalline; 5, needles; 6, plates; 7, 3D crystals.
- Set up crystallization by hanging drop methods in 24-wells as described above around newly identified conditions.
Results
A library of single point mutants in the SERTTC background was created to screen for thermostabilizing mutations. Individual mutants were generated using standard mutagenesis. The screening protocol utilizes transiently transfected HEK293S cells and a scintillation proximity-based thermostability screen to rapidly identity useful mutations for crystallization as outlined in Figure 1A. Plotting Tm values versus bound [3H]citalopram at RT reveals constructs with high thermostability and expression levels suitable for protein purification (Figure 1B). Three mutants (Y110A, I291A, and T439S) were combined to generate a highly stable construct (Figure 1C). Thermostability is also correlated with increased stability in short chain detergents necessary for the crystallization of the SERT-Fab complex.
The large scale expression of human SERT using baculovirus-transduced HEK293S GnTI- cells can take less than 2 weeks and can produce milligram quantities, as illustrated in Figure 2A. Use of the GFP-tagged SERTCC protein allows SERT to be conveniently followed during expression and purification by fluorescence (Figure 2B). Our purification strategy involved 1) solubilization of SERT bound to S-citalopram from HEK293S GnTI- cells in C12M in the presence of CHS as a stabilizing lipid; 2) binding of SERT to a Strep affinity matrix; 3) removal of contaminant proteins by extensive washing; and 4) elution of the functional SERT with buffer containing desthiobiotin (Figure 2C). The eluted protein is largely free of other detectable proteins by Coomassie blue staining and monodisperse as judged by FSEC (Figure 2D, E).
A similar strategy was taken to purify SERT with a Strep II tag which was used for reconstitution and immunization (Figure 3A, B). Incorporation of SERT into proteoliposomes boosts the serum half-life and stability of SERT and improves the likelihood of isolation of high-affinity antibodies. Furthermore, inclusion of lipid A, a component of the bacterial cell wall, serves as a potent adjuvant9. Multilamellar liposomes were prepared by the addition of buffer to a dried lipid mixture in glass tubes and resuspended in buffer. Extrusion of the liposomes through 200 nm pore size filters produces monodisperse unilamellar liposomal suspensions. The liposomes are then saturated with detergent followed by the addition of purified SERT in detergent. Finally, detergent is removed by addition of hydrophobic absorption resin to the lipid:detergent mixture. Additional ligand should be added to the reconstituted sample to select for antibodies that recognize the antidepressant bound conformation. The presence of SERT in the proteoliposomes should be confirmed by solubilizing a small sample with SDS-PAGE loading dye or C12M and running on SDS-PAGE and FSEC (Figure 3C, D).
Hybridoma cell lines expressing SERT antibodies can be screened for high-affinity binders which recognize 3D epitopes. These properties are crucial to the eventual success of crystallization, as the antibody must remain firmly bound to a structured region to promote crystal packing of homogeneous, well-ordered domains. In the first step, antibodies which recognize unstructured regions are identified. SERT is denatured and blotted onto a nitrocellulose membrane; antibodies which bind denatured SERT will be western-positive and likely recognize linear epitopes. In Figure 4A, we show 2 examples of antibodies which are western-positive and likely not useful to promote crystallogenesis. In Figure 4B, the remaining western-negative antibodies are incubated with 100 nM SERT-GFP and separated by FSEC. Antibodies which bind SERT will shift the GFP-positive peak to an earlier position. The SERT-antibody complexes may be diluted further in detergent to determine if they can bind with nanomolar affinity followed by analysis by FSEC. Addition of serotonin results in conformational changes in the transporter and thus the antibodies can be rescreened to determine if they can specifically recognize the SSRI-bound conformation. In Figure 4C, the antibodies are shown to bind SERT in the presence of serotonin, showing that the epitope(s) do not change from the SSRI to substrate bound state. Finally, in Figure 4D combinations of antibodies are tested for their ability to bind distinct epitopes, resulting in a further leftward shift. Here the 15B8 or 8A11 antibodies recognize an epitope which is different from 8B6.
The 8B6 antibody was chosen for further structural analysis based on preliminary crystal screening with papain treated Fab. The genes of the 8B6 Fab were cloned into an insect cell expression vector. Fab can be expressed and secreted from Sf9 cells growing in suspension. The 8B6 Fab can be purified from Sf9 cell supernatant by His-tag affinity (Figure 5A, B) and cation exchange chromatography (Figure 5C, D) resulting in protein which appears free of contaminants on SDS-PAGE gels. In Figure 5E, the recombinant 8B6 Fab is shown to bind SERT and is used in subsequent biochemical and biophysical experiments.
The affinity purified SERTCC is digested with thrombin and EndoH and mixed with 8B6 Fab to form a complex in the presence of S-citalopram. The transporter-antibody complex is then separated by SEC in C8M (Figure 6A) and the peak fractions contain both SERT and Fab as shown by SDS-PAGE (Figure 6B). Use of C8M is crucial for crystal formation probably because the short chain detergent allows better packing between molecules in the crystal lattice. FSEC is employed to determine which fractions should be pooled for crystallization (Figure 6C); fractions which are not monodisperse and/or contain large amounts of free SERT or Fab should not be combined.
Prism shaped SERT-antibody crystals can be grown in the presence of S-citalopram using this protocol by hanging drop vapor diffusion (Figure 7A). The resulting crystals diffract X-rays to a resolution of 3.15 Å10 (Figure 7B).
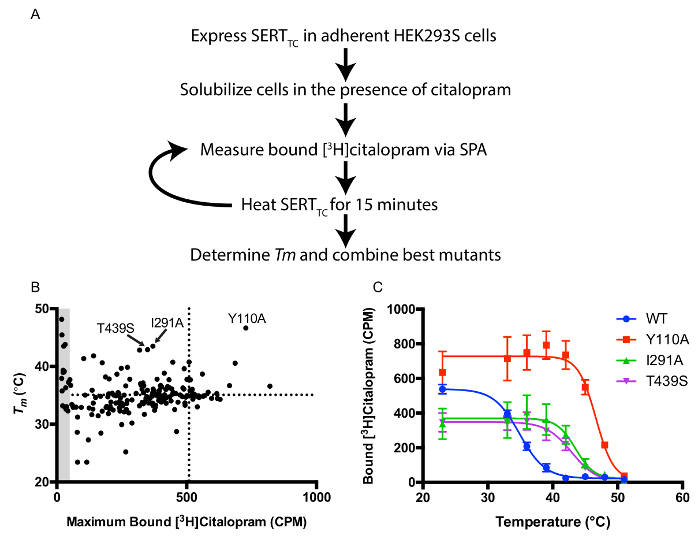
Figure 1: Scintillation Proximity-based Thermostability Assay. A. Overview of protocol for screening thermostability in the presence of [3H]citalopram. B. Maximum bound [3H]citalopram versus apparent melting temperature (Tm). Dotted lines represent values for the WT transporter. The 3 most thermostable mutants are labeled. Grey area represents mutants that have less than 10% of [3H]citalopram binding relative to WT and thus inaccurate Tm values due to a low signal-to-noise. C. Thermostability curves for WT SERTTC and the top 3 mutants. Error bars represent standard deviation (S.D.). Please click here to view a larger version of this figure.

Figure 2: Overview of Mammalian Heterologous Protein Expression. A. Schematized overview of BacMam virus generation and expression of SERT in HEK293S GnTI- cells. B. HEK293S GnTI- cells expressing the SERTCC (GFP fluorescence). C. Elution profile of SERTCC on Strep affinity resin. Green trace represents the concentration of desthiobiotin, 0 - 100% (0 - 5 mM). D. Analysis of affinity purified SERTCC on a 4 - 15% SDS-PAGE gel. E. FSEC of affinity purified SERTCC detected by GFP fluorescence (Excitation: 480 nm; Emission: 510 nm). The peak eluting at 15 mL is SERT (#) and 18 mL is free GFP (*). Please click here to view a larger version of this figure.
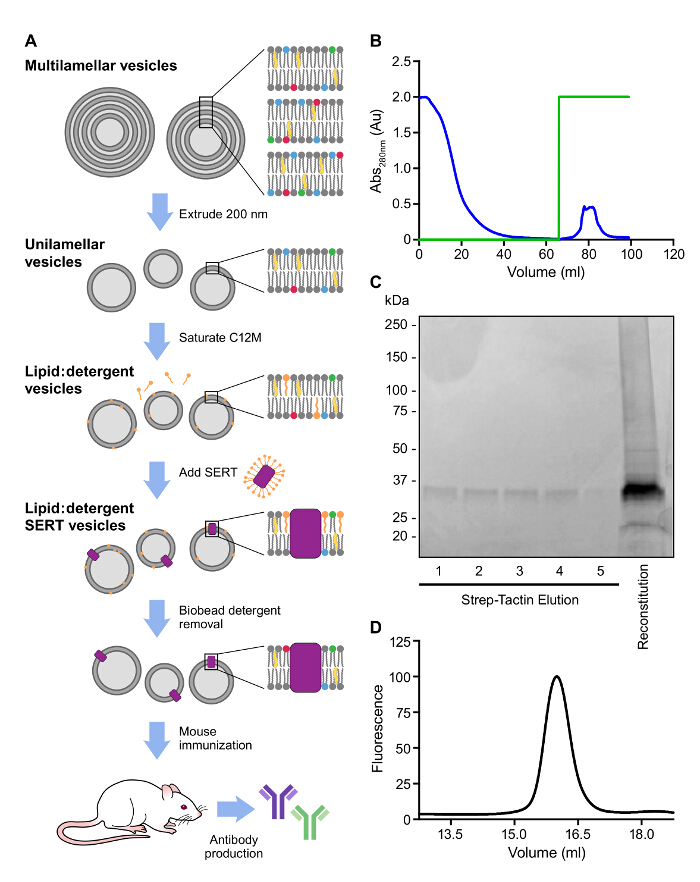
Figure 3: Representative Affinity Purification and Reconstitution of the SERTIC. A. Schematic overview of antibody generation. B. Elution profile observed at 280 nm of the affinity purification of SERTIC on Strep affinity resin. Green trace represents the concentration of desthiobiotin, 0 - 100% (0 - 5 mM). C. Analysis of affinity purified and reconstituted SERT on a 4 - 15% SDS-PAGE gel. D. FSEC of solubilized SERT following reconstitution. The fluorescence of tryptophan residues was used to detect SERT (Excitation: 280 nm; Emission: 335 nm). Please click here to view a larger version of this figure.
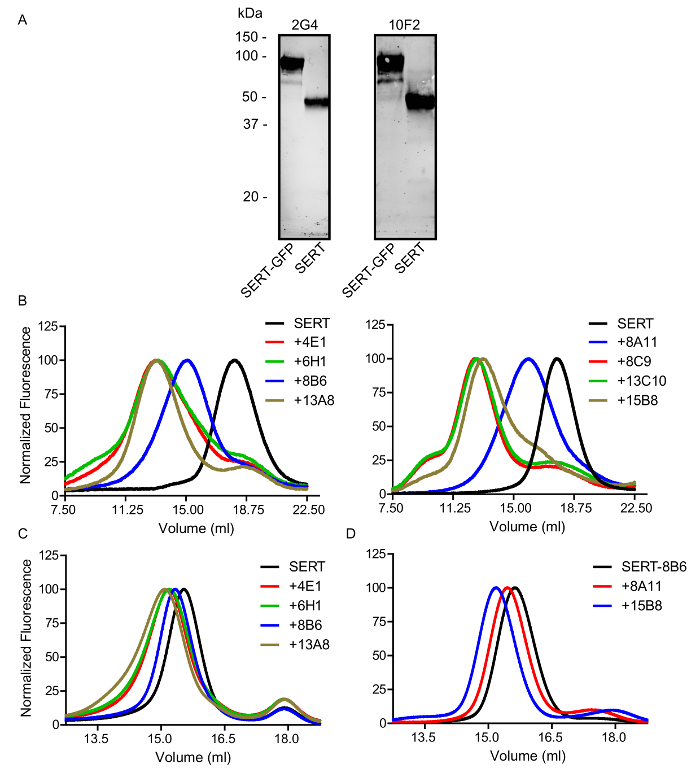
Figure 4: Analysis of Representative SERT Antibodies. A. Screening of antibodies by western blot. Approximately 1 µg of SERTCC with or without GFP was applied to a 4 - 15% SDS-PAGE gel and blotted onto a nitrocellulose membrane. Binding was detected using a goat anti-mouse antibody conjugated to IR Dye. 2G4 and 10F2 are western positive. B. Binding of antibodies to 100 nM GFP-tagged SERT and detection by FSEC detected using GFP fluorescence. C. Binding of selected Fabs to 100 nM GFP-tagged SERT in the presence of 1 mM serotonin. D. Binding of 8A11 or 15B8 Fabs to SERT-8B6 Fab. Minor peaks eluting at 18 mL are free GFP. Please click here to view a larger version of this figure.
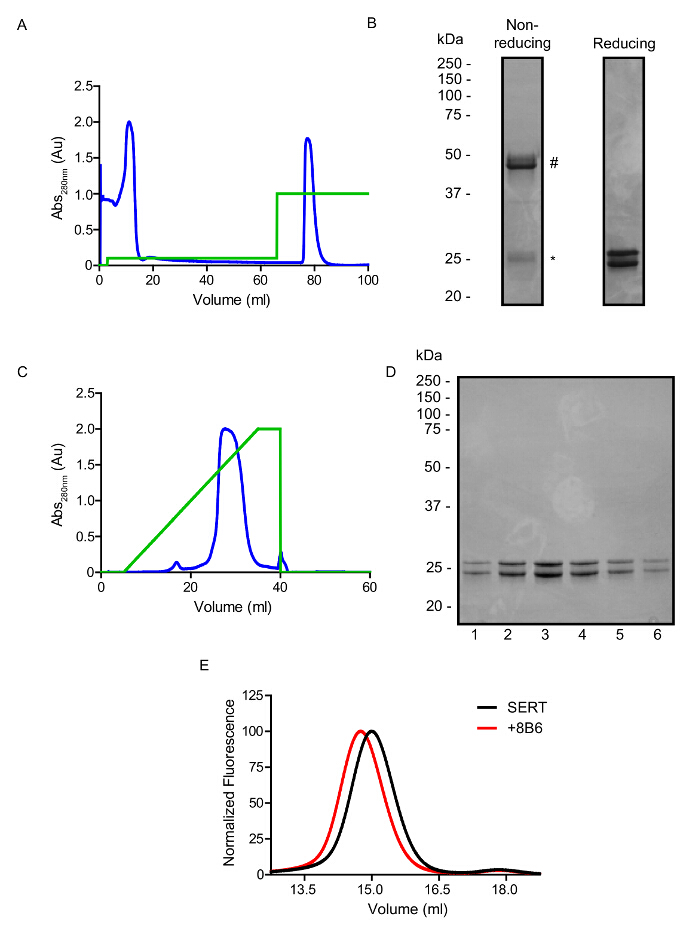
Figure 5: Representative Purification of the 8B6 Fab from Sf9 Cells. A. Elution profile observed at 280 nm of the purification of the 8B6 Fab by His-tag affinity chromatography. Green trace represents the concentration of imidazole, 0 - 50% (0 - 250 mM). B. Non-reducing and reducing SDS-PAGE gel after His-tag affinity purification. Protein which runs near 50 kDa is non-reduced Fab (#) and minor species at 25 kDa is reduced Fab (*). C. Elution profile observed at 280 nm of the purification of the 8B6 Fab by cation exchange displaying a single symmetrical peak which elutes under a linear sodium chloride gradient. Green trace represents the concentration of NaCl, 0 - 100% (0 - 500 mM). D. Analysis of the 8B6 Fab on a 12.5% SDS-PAGE gel following purification by cation exchange. E. Binding of the 8B6 Fab to 10 nM GFP-tagged SERT, detected using fluorescence of GFP. Please click here to view a larger version of this figure.
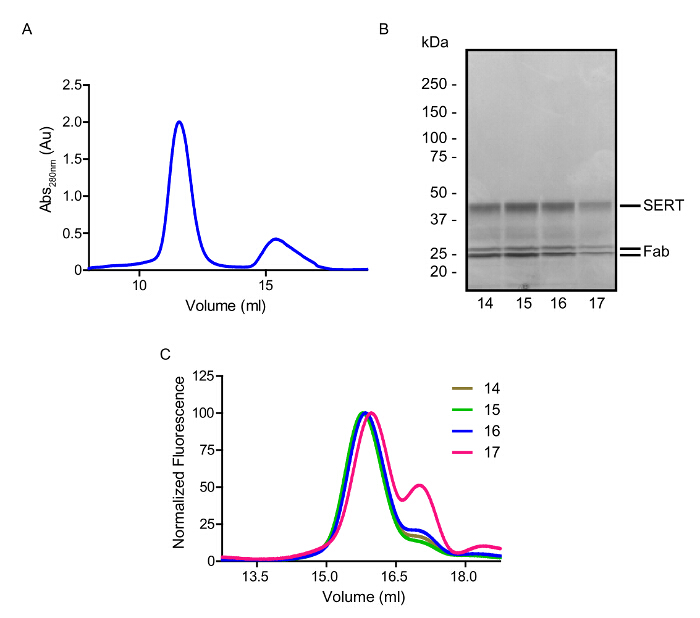
Figure 6: Representative Gel Filtration Chromatography of the SERT-8B6 Complex in the Presence of S-citalopram. A. Gel filtration elution profile of purified SERT-8B6 complex. Main peak eluting at 11.5 mL is the SERT-8B6 complex. Peak at 15 - 17 mL contains GFP and Fab. B. Analysis of the purified SERT-8B6 complex on a 4 - 15% SDS-PAGE gel. The positions of SERT and the heavy and light chains of the Fab are shown by a dash. C. FSEC of the size-separated fractions. SERT-8B6 complexes were detected using tryptophan fluorescence. Fraction 17 contains a larger amount of SERT which did not complex with Fab. Please click here to view a larger version of this figure.
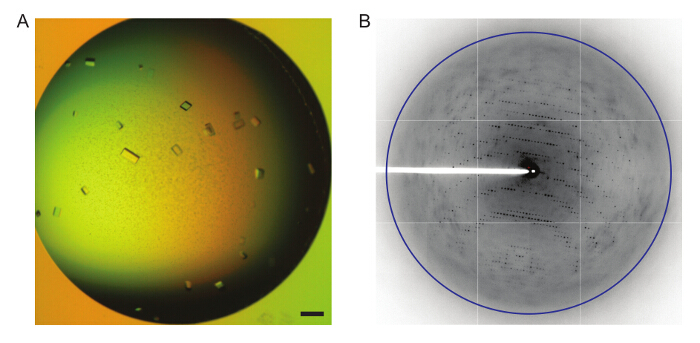
Figure 7: Crystallization of the SERT-8B6 Complex Bound to S-citalopram. A. Light microscopy of parallelepiped shaped crystals of the SERT-8B6 complex after 2 weeks of growth. Scale bar equals 200 µm. B. SERT-8B6 crystals diffract X-rays to 3.15 Å. Blue ring represents 3.15 Å. Please click here to view a larger version of this figure.
Table 1: A Crystallization Screen for the SERT-8B6 Complex Bound to S-citalopram. Please click here to download this table.
Discussion
Determination of membrane protein structure by biophysical techniques remains a daunting undertaking for many medically significant transporters, receptors, and channels11. Here we share detailed expertise developed for the structure determination of the human serotonin transporter bound to S-citalopram. We anticipate that these methods will be useful to determine structures of SERT in other conformational states as well as structures of other difficult membrane proteins. Furthermore, the biochemical techniques described here can also be used to study function of purified SERT in detergent and a near-native lipid environment.
SERT crystallization hinged upon the development of several tools and techniques. First, improvements in transporter thermostability produced SERT variants which were well-behaved in various detergent micelles following extraction of the transporter from membranes6. Second, the use of the high-affinity ligand S-citalopram throughout purification and crystallization further improved stability and reduced conformational heterogeneity. Third, the development of the BacMam expression system7 allowed for production of large amounts of SERT in a short period of 2 weeks, facilitating both immunization and crystallization. Finally, the development of strategies to select for high-affinity antibodies which recognize 3D epitopes allowed for the discovery of the 8B6 antibody which promotes well-ordered packing of SERT-antibody complexes into crystals.
There are a number of critical steps and reagents as well as common problems which often occur throughout the protocol. First, the generation of high titer SERT P2 virus can be problematic. Adding low concentrations of P1 virus to generate P2 virus as described in this protocol usually mitigates this problem, and in cases where the P2 virus titer is low, P3 virus can be made using virus at an MOI of 0.0001. Viruses with a titer less than 1 x 10⁸ virus particles/mL should not be used and will almost always result in low protein yields. For expression, HEK293S GnTI- cells were chosen since they lack N-acetylglucosaminyltransferase I activity and thus cannot synthesize complex N-glycans, instead producing only high mannose N-glycans. EndoH cleaves N-linked glycosylation of high mannose glycans at two sites in extracellular loop 2 (EL2), leaving an N-acetylglucosamine attached to asparagine. Digestion of N-linked sugars reduces surface entropy of EL2 which is likely important for crystallization. For the generation of antibodies, the SERTIC should be used for immunization. GFP is highly immunogenic12 and should not be used as a fusion tag to generate antibodies since it is difficult to completely remove by SEC. The flexible N- and C-terminus of SERT were also not included in the construct in order to avoid antibodies against these regions. Mice can be immunized with 30 µg of reconstituted protein; continue immunizing mice until high serum concentrations of antibodies can be detected and produce hybridoma cells as described13. A thermostabilized construct is usually the best choice for immunization; if the transporter is well behaved and retains biological activity following purification, this is often sufficient to raise antibodies. The 8B6 antibody was raised against WT SERT. For crystallization, only the peak fractions from SEC containing monodisperse complex as judged by FSEC should be combined and concentrated. SERT-8B6 crystals grow in a narrow range of conditions and there are a number of steps which should be taken to troubleshoot problems specifically related to SERT crystal growth. Tris base adjusted with HCl should not be used in the reservoir solution, since this buffer does not support crystal growth; it is thus critical to instead use Tris adjusted with NaOH. SERT crystals grow in a narrow concentration range of PEG 400, so if crystals do not grow or if many small crystals are observed, even a small increase or decrease in the PEG 400 concentration would be advised. Furthermore, the additive 6-aminohexanoic acid was also used in the optimized screen to improve nucleation. The drop ratio of protein:well solution is also a key determining factor for crystal growth. Drop ratios of 1.5 - 2:1 are recommended, with drop ratios closer to 2:1 typically supporting the growth of larger 3-dimensional crystals. Finally, the use of low profile 24-well plates is also crucial toward crystal growth, presumably due to modification of the rate of vapor diffusion.
An alternative approach to the SPA method has been developed to screen for mutants which stabilize the rat serotonin transporter in a cocaine-bound conformation using a filter binding assay5. By contrast, the SPA based assay allows for sequential heating steps following by determination of the fraction of SERT which remains bound to ligand. Thus, this allows for the rapid determination of the melting temperature from a small number of samples. The SPA method relies on the availability of a radiolabeled high-affinity ligand and if no ligands are known which bind with submicromolar affinity then an alternative approach will be necessary. Many other methods are commonly used to measure protein stability such as binding of fluorescent dyes and calorimetry14 but are low-throughput and are either unable to directly measure function or require large amounts of protein. If the SPA method cannot be used, one alternative high-throughput approach is an FSEC-based Thermostability Assay15 (FSEC-TS), where the sample is heated followed by separation of the fraction of remaining transporter. FSEC-TS is a useful approach for accessing chromatographic behavior and oligomeric state and is a powerful complementary tool which can be used alongside the SPA method.
A comparison of various common protein expression systems was also found to favor the use of mammalian cells for SERT expression16 and unsurprisingly this is likely the case for many proteins of mammalian origin. The methods which we have used for expression have been tailored for SERT but are likely readily adaptable. Conditions which favor high levels of expression should be carefully identified by varying the time of expression, temperature, virus concentration, and presence of histone deacetylase inhibitors such as sodium butyrate.
We generally favor affinity purification in a mild long-chain detergent such as C12M together with CHS prior to reconstitution to retain high-affinity ligand binding. Reconstitution using hydrophobic absorption is a mild technique which we have found to be effective for several other transporters and receptors. If this is not successful, removal of detergents with high critical micelle concentrations by dialysis, dilution, or SEC can be employed17 provided the antigen is sufficiently stable in such detergents. In cases where no suitable antibodies are found, we almost always find the issue is due to loss of function or denaturation of the antigen and in such cases we successfully performed new immunizations paying special attention to protein biochemistry. Finally, ligands and antibodies which bind with high-affinity should form the basis for a rationally planned crystallization experiment and by taking advantage of a thermostable variant, one can screen a broader range of conditions by varying the properties of different detergents. Furthermore, crystallization in a lipidic mesophase18 or using bicelles19 should always be considered as an alternative to crystallization in micelles.
These principals and methods can be used with some modification for many other transmembrane proteins which are difficult to express and purify from other expression hosts, and will be particularly useful for the structure determination of targets of high-affinity drugs.
Disclosures
The authors have nothing to disclose.
Acknowledgements
We thank D. Cawley for generating monoclonal antibodies. We thank A. Penmatsa and K. Wang for sharing ideas and expertise developed from the dopamine transporter. L. Vaskalis for assistance with figures, H. Owen for help with manuscript preparation and other Gouaux laboratory members for helpful discussions. J.A.C. has support from a Banting postdoctoral fellowship from the Canadian Institutes of Health Research. E.M.G. is supported by the National Science Foundation Graduate Research Fellowship. We are particularly grateful to Bernie and Jennifer LaCroute for their generous support, as well as for funding from the NIH (5R37MH070039). E.G. is an investigator of the Howard Hughes Medical Institute.
Materials
| Name | Company | Catalog Number | Comments |
|---|---|---|---|
| DH10Bac | Invitrogen | 10361-012 | |
| Kanamycin | Fisher | BP906-5 | |
| Gentamicin | Fisher | BP918-1 | |
| Tetracycline | Sigma | T-7660 | |
| Bluo-gal | Invitrogen | 15519-028 | 5-Bromo-3-indolyl β-D-galactopyranoside |
| Isopropyl beta-D-1-thiogalactopyranoside | Anatrace | I1003 | IPTG |
| Miniprep kit | Qiagen | 27106 | |
| Cellfectin II | Invitrogen | 10362-100 | Sf9 transfection reagent |
| Sf9 | ATCC | CRL-1711 | |
| Sf-900 III SFM media | Life Technologies | 12658-027 | |
| HEK-293S GnTI- | ATCC | CRL-3022 | |
| Freestyle 293 media | Life Technologies | 12338-018 | 293 expression media |
| Fetal Bovine Serum (FBS) | Life Technologies | 0984018DJ | |
| Sodium butyrate | Sigma | 303410 | |
| S-citalopram | Sigma | E4786 | Anagrade |
| n-Dodecyl-beta-D-Maltopyranoside | Anatrace | D310 | |
| Cholesteryl hemmisuccinate | Sigma | C6013 | |
| 1-palmitoyl-2-oleoyl-sn-glycero-3-phosphocholine | Avanti Polar Lipids | 850457P | |
| 1-palmitoyl-2-oleoyl-sn-glycero-3-phosphoethanolamine | Avanti Polar Lipids | 850757P | |
| 1-palmitoyl-2-oleoyl-sn-glycero-3-phosphoglycerol | Avanti Polar Lipids | 840457P | |
| Leupeptin | Sigma | L2884 | |
| Pepstatin A | Sigma | P5318 | |
| Aprotinin | Sigma | A1153 | |
| PMSF | Sigma | P7626 | |
| Desthiobiotin | Iba Life Sciences | 2-1000-05 | |
| Asolectin | Sigma | 11145 | |
| Cholesterol | Sigma | C-8667 | |
| Lipid A | Sigma | L5399 | |
| Brain polar lipid | Avanti Polar Lipids | 141101C | |
| Biobeads | Biorad | 152-3920 | Hydrophobic absorption resin |
| Goat anti-mouse IRDye 680RD | Odyssey | 926-68070 | Used as secondary antibody for western blotting |
| Lauryl maltose neopentyl glycol | Anatrace | NG310 | Anagrade |
| Serotonin | Sigma | H9523 | |
| pFastBac 8B6 | Available from authors | ||
| pEG Bacmam SERT Strep II | SERTIC, Available from authors | ||
| pEG Bacmam SERT GFP twin Strep His | SERTTC, Available from authors | ||
| pEG Bacmam SERT ts3 GFP twin Strep His | SERTCC, Available from authors | ||
| Imidazole | Sigma | 56749 | |
| n-Octyl β-D-maltoside | Anatrace | O310 | Anagrade |
| Thrombin | Haematologic Technologies | HCT-0020 | |
| EndoH | New England Biolabs | P0702 | |
| Trizma-HCl | Sigma | T5941 | Tris is used for preparation of crystallization reservoirs |
| PEG 400 | Sigma | 91893 | |
| 6-aminohexanoic acid | Sigma | 7260 | |
| Trypsin-EDTA | Fisher | MT25052CV | |
| Isoplate-96 TC | PerkinElmer | 6005070 | |
| PolyJet | SignaGen | SL100688 | Polymer transfection reagent for mamalian cells |
| Copper HIS-Tag YSI SPA Beads | PerkinElmer | RPNQ0096 | His-tag affinity SPA beads |
| Citalopram, [N-Methyl-3H] | PerkinElmer | NET1039250UC | |
| ThermoMixer C | Eppendorf | 5382000023 | heating block for thermostability assay |
| ThermoTop | Eppendorf | 5308000003 | |
| SmartBlock PCR 96, thermoblock for PCR plates | Eppendorf | 5306000006 | |
| 0.2 µm syringe filter | Olympus Plastics | 25-243 | |
| 1 L filter system | Corning | 430517 | |
| 2 L flat bottom tissue culture flask | Genemate | F-5909-2000 | |
| 2 L baffled tissue culture flask | Genemate | F-5909-2000B | |
| CO2 incubator | Thermo Scientific | 3950 | |
| Forma Orbital Shaker | Thermo Scientific | 416 | |
| Strep-Tactin resin | Iba Life Sciences | 2-1208-025 | Strep affinity resin |
| Extruder | Northern Lipids | ||
| Li-Cor imaging system | Odyssey | western blot imaging system | |
| XK16 column | GE Healthcare | 28-9889-37 | column used for Strep-Tactin and Talon purificaiton |
| 100 kDa MWCO protein concentrator | Millipore | UFC910096 | |
| 30 kDa MWCO protein concentrator | Millipore | UFC903024 | |
| Äkta FPLC | GE Healthcare | UPC-900 | |
| HPLC | Shimadzu | 51476 | |
| Superose 6 (10/300) column | GE Healthcare | 17-5172-01 | Used for FSEC |
| Tangential flow apparatus | Pall Filtron | ||
| 0.2 µm filter tangential flow cell | Pall Filtron | PSM20C11 | |
| 30 kDa MWCO tangential flow concentrator | Pall Filtron | OS030T12 | |
| Talon resin | Clonetech | 635504 | His-tag affinity resin used for Fab purification |
| 1 mL HiTrap SP column | GE Healthcare | 17115101 | Cation exchanger used for Fab purification |
| Superdex 200 10/300 GL column | GE Healthcare | 17-5175-01 | Used for SEC separation of SERT-8B6 |
| 24-well VDXm plate | Hampton Research | HR3-306 | |
| 18 mm coverslips | Hampton Research | HR3-239 | |
| Virocyt virus counter | Virocyt | 2100 | |
| MicroBeta Trilux | PerkinElmer | 1450 | 96-well scintillation counter |
| HiTrap SP column | GE Healthcare | 17115101 | |
| Sertraline | Sigma | S6319 |
References
- Kristensen, A. S., et al. SLC6 neurotransmitter transporters: structure, function, and regulation. Pharmacol Rev. 63 (3), 585-640 (2011).
- Broer, S., Gether, U. The solute carrier 6 family of transporters. Br J Pharmacol. 167 (2), 256-278 (2012).
- Andersen, J., Kristensen, A. S., Bang-Andersen, B., Stromgaard, K. Recent advances in the understanding of the interaction of antidepressant drugs with serotonin and norepinephrine transporters. Chem Commun (Camb). 25 (25), 3677-3692 (2009).
- Hahn, M. K., Blakely, R. D. The functional impact of SLC6 transporter genetic variation. Annu Rev Pharmacol Toxicol. 47, 401-441 (2007).
- Abdul-Hussein, S., Andrell, J., Tate, C. G. Thermostabilisation of the serotonin transporter in a cocaine-bound conformation. J Mol Biol. 425 (12), 2198-2207 (2013).
- Green, E. M., Coleman, J. A., Gouaux, E. Thermostabilization of the human serotonin transporter in an antidepressant-Bound Conformation. Plos One. 10 (12), e0145688(2015).
- Goehring, A., et al. Screening and large-scale expression of membrane proteins in mammalian cells for structural studies. Nat Protoc. 9 (11), 2574-2585 (2014).
- Kawate, T., Gouaux, E. Fluorescence-detection size-exclusion chromatography for precrystallization screening of integral membrane proteins. Structure. 14 (4), 673-681 (2006).
- De Becker, G., et al. The adjuvant monophosphoryl lipid A increases the function of antigen-presenting cells. Int Immunol. 12 (6), 807-815 (2000).
- Coleman, J. A., Green, E. M., Gouaux, E. X-ray structures and mechanism of the human serotonin transporter. Nature. , (2016).
- White, S. H. The progress of membrane protein structure determination. Protein Sci. 13 (7), 1948-1949 (2004).
- Gambotto, A., et al. Immunogenicity of enhanced green fluorescent protein (EGFP) in BALB/c mice: identification of an H2-Kd-restricted CTL epitope. Gene Ther. 7 (23), 2036-2040 (2000).
- Galfre, G., Howe, S. C., Milstein, C., Butcher, G. W., Howard, J. C. Antibodies to major histocompatibility antigens produced by hybrid cell lines. Nature. 266 (5602), 550-552 (1977).
- Deller, M. C., Kong, L., Rupp, B. Protein stability: a crystallographer's perspective. Acta Crystallogr F Struct Biol Commun. 72, 72-95 (2016).
- Hattori, M., Hibbs, R. E., Gouaux, E. A fluorescence-detection size-exclusion chromatography-based thermostability assay for membrane protein precrystallization screening. Structure. 20 (8), 1293-1299 (2012).
- Tate, C. G., et al. Comparison of seven different heterologous protein expression systems for the production of the serotonin transporter. Biochim Biophys Acta. 1610 (1), 141-153 (2003).
- Rigaud, J. L., Levy, D. Reconstitution of membrane proteins into liposomes. Methods Enzymol. 372, 65-86 (2003).
- Caffrey, M., Cherezov, V. Crystallizing membrane proteins using lipidic mesophases. Nat Protoc. 4 (5), 706-731 (2009).
- Faham, S., Bowie, J. U. Bicelle crystallization: a new method for crystallizing membrane proteins yields a monomeric bacteriorhodopsin structure. J Mol Biol. 316 (1), 1-6 (2002).
Reprints and Permissions
