Culturing human Mesenchymal Stromal Cells (hMSCs) with autologous serum, reduces the risks of rejection by xenogeneic material and other negative effects. It also allows for the recovery of a subset of mesodermal progenitors, which can deliver fresh hMSCs. Embedding hMSCs in an autologous fibrin clot enables easy handling and effective surgical implantation.
Method Article
Mesenchymal Stromal Cell Culture and Delivery in Autologous Conditions: A Smart Approach for Orthopedic Applications
In This Article
Summary
Abstract
Human Mesenchymal Stromal Cells (hMSCs) are cultured in vitro with different media. Limits on their use in clinical settings, however, mainly depend on potential biohazard and inflammation risks exerted by xenogeneic nutrients for their culture. Human derivatives or recombinant materials are the first choice candidates to reduce these reactions. Therefore, culture supplements and materials of autologous origin represent the best nutrients and the safest products.
Here, we describe a new protocol for the isolation and culture of bone marrow hMSCs in autologous conditions — namely, patient-derived serum as a supplement for the culture medium and fibrin as a scaffold for hMSC administration. Indeed, hMSC/fibrin clot constructs could be extremely useful for several clinical applications. In particular, we focus on their use in orthopedic surgery, where the fibrin clot derived from the donor's own blood allowed effective cell delivery and nutrient/waste exchanges. To ensure optimal safety conditions, it is of the utmost importance to avoid the risks of hMSC transformation and tissue overgrowth. For these reasons, the approach described in this paper also indicates a minimally ex vivo hMSC expansion, to reduce cell senescence and morphologic changes, and short-term osteo-differentiation before implantation, to induce osteogenic lineage specification, thus decreasing the risk of subsequent uncontrolled proliferation.
Introduction
Human Mesenchymal Stromal Cells (hMSCs) represent one of the best cell sources for use in tissue engineering for promoting osteogenesis1,2. They are easily isolated from bone marrow and other adult tissues, and express typical surface markers such as CD90, CD105, CD731. Moreover, they can differentiate into several cell types, such as osteoblasts, chondrocytes and adipocytes3. Their therapeutic effects are attributed to their regenerative and trophic properties4. hMSCs could be used in orthopedic surgery, as well as in other regenerative clinical applications. They are preferably combined with scaffolds, to improve the clinical outcome5.
Compared to other materials, the fibrin gel shows interesting properties such as adhesiveness, resorption and efficient transport of nutrients, which make it extremely useful for a variety of tissue engineering applications6,7.
The main challenge in translating a tissue engineering approach into clinical applications is obtaining a fully-biocompatible and biosafe scaffold and a xeno-free culture medium that avoids any infective or reactive effect.
In our method, fibrin gel, derived from the patient's own blood, and autologous serum, for in vitro hMSCs culture, were employed as a possible therapeutic solution in the orthopedic field8.
For clinical purposes, hMSCs are usually administrated via two main procedures: (i) the "one-step" procedure (i.e., minimal manipulation), which allows the auto transplant of bone marrow, either whole or concentrated (i.e., mononuclear cells), during surgery; and (ii) the "two-step" procedure (i.e., extensive manipulation), which is based on the ex vivo expansion of hMSCs to increase their yield before implantation, and requires GMP facilities9. Interestingly, culturing cells with human adult serum instead of bovine calf serum allows the recovery, together with hMSCs, of a subset of cells (1 - 10% in mononuclear cultures) called Mesodermal Progenitor Cells (MPCs), capable of in vitro differentiation into fresh hMSCs10,11. Thus, hMPCs may play a significant role in the regenerative process when compared with hMSCs alone12,13. Finally, short-term osteo-induction pushes hMSCs to start their differentiation into the osteogenic lineage without losing their proliferative potential and viability12. These results confirm previous studies that have reported enhanced in vivo bone formation by hMSCs, followed by a preculture in osteogenic medium14. Moreover, an autologous plasma clot as a scaffold for cell delivery can be easily manipulated by the surgeon and molded to fit the shape of the bone cavity13.
Therefore, this method can be extremely useful for those researchers and clinicians who aim at translating their hMSC-based therapy from the bench to the bedside in orthopedic applications.
Protocol
The present protocol was developed in accordance with the World Medical Association's Declaration of Helsinki regarding the ethical conduct of research involving humans. It was approved by the Ethical Committee of the Azienda Ospedaliero-Universitaria Pisana.
NOTE:
Bone marrow was obtained from patients undergoing routine total hip replacement surgery (according to step 1.1)15; plasma for the clot preparation was obtained from autologous peripheral blood13; autologous serum, as a supplement for the culture medium, was collected from an autologous whole-blood apheresis. All the patients received detailed information about the procedure and signed a written consent form.
1. Collection of the Bone Marrow Sample
- Collect bone marrow from the femoral medullary canal after a total hip replacement surgery (for research studies). Briefly, during the surgical preparation of the medullary canal to house the prosthetic stem, collect the marrow blood that overflows (about 10 - 15 mL, depending on the prosthesis size)15.
OR - Collect bone marrow aspirate from the iliac crest under local anesthesia, following standard hematologic procedure about 20 - 30 d in advance (for clinical applications)16.
NOTE: In both cases heparinized syringes (to prevent clot formation) must be used for bone marrow recovery.
2. Preparation of Autologous Plasma
- Collect 20 mL of peripheral blood from the patient in vacuum blood collection tubes containing K3 EDTA (5.4 mg in 3 mL tubes) and centrifuge at 2,400 × g for 15 min.
- Aspirate the plasma component in a 15 mL tube and freeze at -20 °C until usage.
3. Preparation of the Autologous Serum
- Transfer the unit of plasma into a transfer bag using a spike. Disconnect the filled bag by welding and weigh the bag to calculate the volume of plasma (Figure 1A).
- Coagulate the autologous plasma by injecting calcium gluconate 100 mg/mL at 10% w/v through the port connector (Figure 1B). After mixing the bag, place it at 4 °C O/N without shaking to facilitate clot formation.
- Centrifuge the bag at 4,900 × g for 15 min at RT. Take the centrifuge bucket out of the centrifuge and remove the bag carefully (follow the manufacturer's guidelines for the preparation of platelet lysate) (Figure 1C).
- Isolate the clot just above the clamp to facilitate filtration. Connect the filtration kit to the transfer bag using a spike placed into the outlet port of the filtration kit.
- Hang the bag and open the blue clamp to let the serum flow by gravity. Do not apply pressure to the filter to avoid transfer of fibrin into the bag. After filtration, seal the tubing and remove the bag (follow the manufacturer's guidelines for preparation of platelet lysate).
- Connect a dedicated line to the final bag and transfer serum into 50 mL tubes under a laminar flow bench to avoid microbial contamination.
- Take a sample with a syringe to test the absence of fibrinogen and perform a sterility test for aerobic and anaerobic bacterial cultures17. Label the tubes appropriately and freeze them at - 20 °C until usage.
4. Preparation of the Expansion Medium
- Prepare 500 mL of complete proliferation medium. To Dulbecco's Modified Eagle Medium - Low Glucose (DMEM-LG), add 10% autologous serum (obtained as described in section 3), 2 mM glutamine, 1% antibiotic solution and 1% antimycotic solution. Sterile-filter the complete proliferation medium.
5. Isolation of hMSCs from the Bone Marrow
- Transfer the bone marrow sample (5 - 10 mL) from the syringe into a 50 mL conical tube and dilute it with sterile saline (ratio 1:4). Vortex the 50 mL tube for 30 s to disaggregate the cell clusters.
- Warm the density gradient (density 1.077 g/L; see Table of Materials) to RT before usage and layer the diluted bone marrow gently (to prevent mixing both layers) onto the density gradient by adding 20 mL of the sample to 15 mL of density gradient for each 50 mL tube (Figure 2A).
- Centrifuge at 400 × g without brake at 25 °C for 30 min, then collect the mononuclear fraction at the liquid-liquid interface and transfer it to a new 50 mL tube using a sterile 5 mL pipette.
- Wash the collected mononuclear fraction twice with complete proliferation medium and centrifuge the tubes at 400 × g for 10 min at 25 °C to obtain cell pellets.
- Discard the supernatant and gently resuspend each cell pellet in 5 mL of complete proliferation medium. Dilute at a 1:100 ratio for cell counting.
- Count the cells using a hemocytometer after a 1:1 dilution with Trypan Blue staining to evaluate cell viability.
6. Culture of hMSCs in the Presence of Autologous Serum
- Fill two or more 75 cm2 tissue culture (TC) flasks with 15 mL of fresh complete proliferation medium and transfer them to a cell culture incubator at 37 °C and 5% CO2 until usage.
- Seed 0.3 - 0.5 x 10⁶ cells/cm2 (37.5 x 10⁶ cells/15 mL of fresh complete proliferation medium) and incubate at 37 °C and 5% CO2 for 48 h.
- At the same time, seed 1 x 10⁶ cells in a 25 cm2 TC flask with 5 mL of fresh complete proliferation medium for the Colony Forming Unit - Fibroblast (CFU-F) assay. Culture for 2 weeks (to be continued in section 12).
- Discard the medium and gently wash the flasks from step 6.2 with complete proliferation medium to remove nonadherent cells and debris. Add fresh medium to the flasks and replace half of it twice a week, until 70 - 80% confluency (primary culture, Passage 0 (P0)) (Figure 2B).
- Recover the cells by using a specific recombinant animal free protease (see Table of Materials; use 3 mL of the solution per flask as recommended by the manufacturer) and incubate at 37 °C and 5% CO2 for 10 min. Add 6 mL of complete proliferation medium per flask and collect in one 50 mL tube. Repeat step 5.6.
NOTE: IMPORTANT: The use of this protease instead of trypsin allows the recovery of some Mesodermal Progenitors Cells (MPCs) present in the culture, which is trypsin resistant. - For further expansion, replate the cell suspension at 2,000 - 3,000 cells/cm2 in new 75 cm2 TC flasks (P1) (Figure 2C).
- Use aliquots of cells to evaluate the differentiation potentials of MSCs towards osteogenic, adipogenic and chondrogenic lineages. Perform differentiation assays following the manufacturer's recommendations (Figure 2D).
NOTE: Different staining methods can be used to assess multilineage differentiation.
7. Preparation of an Osteogenic Medium with Pharmaceutical Supplements
- Dilute ascorbic acid solution (Solution 1A: ascorbic acid 200 mg/mL (See Table of Materials) 1:10 with DMEM-LG, to obtain a 20 mg/mL solution (Solution 1B, working solution). Stock aliquots of solutions 1A and 1B at -20 °C until usage.
- Resuspend 1 g hydrocortisone in 10 mL of sterile water (Solution 2A: hydrocortisone 100 mg/mL (See Table of Materials). Dilute Solution 2A at 1:1,000 with DMEM-LG to obtain a 100 µg/mL solution (Solution 2B, working solution). Stock aliquots of solutions 2A and 2B at -20 °C until usage.
- Upon usage prepare fresh osteogenic medium as follows: add DMEM-LG with 10% autologous serum, 50 µg/mL ascorbic acid and 0.4 µg/mL hydrocortisone. Sterile-filter the osteogenic medium.
8. Osteogenic Pre-induction and Recovery of hMSCs
- Completely remove the proliferation medium and add osteogenic medium 96 h before cell harvesting (i.e., 80 - 90% confluence is usually reached in 7 d). Provide an additional osteogenic medium change 24 h before cell harvesting.
- Detach the cells as described in step 6.5 and gently resuspend the pellet adding 2 mL of complete proliferation medium in a 50 mL tube.
NOTE: Cell viability may be reduced (about 10%) as a result of osteoinduction. Cellular aggregates can be observed. - After counting, wash the cells with complete proliferation medium and centrifuge at 300 × g for 5 min. Resuspend the pellet gently at 1 - 2 x 10⁶ viable cells/2 mL of autologous plasma (see section 2) per 50 mL tube.
9. Preparation of hMSC/fibrin Clot Constructs
- Add 150 µl of calcium gluconate at 100 mg/mL to each 50 mL tube obtained from step 8.3. and resuspend the cells under gentle shaking.
- Incubate the cells at 37 °C and 5% CO2 for 15 - 30 min to obtain hMSC/fibrin clot constructs (Figure 3A). Prepare a fibrin clot construct without cells to be used as a control.
NOTE: IMPORTANT: It is recommendable to prepare this control clot at least 2 h before the cell viability assay, as it takes 30 min or more to crosslink.
10. Cell Viability Assay
- Remove the liquid from the 50 mL tubes and add 1 mL of complete proliferation medium containing 10% v/v cell viability reagent (AB; see Table of Materials), according to the manufacturer's guidelines.
- Incubate the tubes at 37 °C and 5% CO2 for 3 h. Measure the absorbance at 570 nm with a reference wavelength of 600 nm (AB at time 0; t0).
- Discard the supernatant and add 2 mL of fresh complete proliferation medium. Incubate at 37 °C, 5% CO2 O/N. The next day (AB at time 24 h; t24), repeat steps 10.1 to 10.3 (Figure 3B).
11. Histologic Evaluation of Cell Viability and Calcium Deposition inside Fibrin Clot Constructs
- Fix the hMSC/fibrin clot constructs in 4% w/v neutral buffered formalin O/N at 4 °C. Wash 4x in D-PBS for 15 min and store in 70% ethanol.
- Dehydrate the samples at 40 °C in a series of graded ethanol: 80% once for 30 min, 95% twice for 45 min and 3x 100% for 1 h. Clarify twice in xylene for 45 min at 40 °C.
- Rinse the samples in liquid paraffin at 60 °C for 2 h and embed them. Cut the paraffin block with a microtome and mount the sections (5 µm) on glass slides.
- Stain the deparaffinized sections using the standard Hematoxylin and Eosin (H&E) method (Figure 3C).
- Perform von Kossa staining by treating the sections with 1% silver nitrate for 15 min, 0.5% Pyrogallol for 2 min, and 5% sodium thiosulfate for 2 min. Counterstain the sections with 0.1% nuclear fast red diluted in a solution containing 5 g aluminum sulphate for 5 min and rinse them in tap water for 5 min. Mount the sections with a mounting agent.
- Evaluate the mineral deposition as black granules under light microscope (400X magnification) (Figure 3D).
12. CFU-F Assay
- Wash the 25 cm2 flask (from step 6.3.) with D-PBS. Stain by using the standard May-Grunwald/Giemsa method. Visually quantify hMSC number by scoring individual colonies (Figure 4) under a light microscope.
NOTE: If the bone marrow is taken as in step 1.2. and the sections 2 - 9 are performed in Good Manufacturing Practice (GMP) with the necessary regulatory approval, the hMSC/fibrin clot constructs can be implanted for orthopedic applications.
Results
Preparation of autologous serum
Plasma coagulation, performed by adding calcium gluconate to the transfer bag, allows the recovery of autologous serum in large amounts, as required for the hMSC culture. Indeed, with this technique, it is possible to achieve up to 200 mL of serum (Figure 1).
HMSC isolation, culture and differentiation using autologous serum
Bone marrow mononuclear cells are isolated using a density gradient, which gives rise to an intermediate ring layer (Figure 2A). By plating these cells and removing the nonadherent ones with washing, it is possible to isolate hMSCs (Figure 2B). Under autologous culture conditions, a subset of cells, called MPCs, are detected at P0 and in percentages up to 10%, depending on patient variability (Figure 2B). MPCs are still present after replating (i.e., P1) if the protease is used for cell passaging (Figure 2C). hMSCs isolated and cultured in an autologous setting maintain their capability to differentiate towards the three well-known mesodermal lineages (osteogenic, adipogenic, and chondrogenic). The differentiation assays were performed to compare the hMSC population identity with those obtained using standard (nonautologous) culture conditions. As functionality assays for this protocol, von Kossa staining, osmium tetroxide staining, and Alcian Blue staining at pH 1 were chosen in place of those suggested by the differentiation media manufacturer (see Table of Materials) (Figure 2D).
Preparation, viability and histologic characterization of MSC/fibrin clot constructs
The hMSCs are dispersed in plasma, which is cross-linked by calcium gluconate in a 50 mL tube, leading to the formation of a jelly disc surrounded by its supernatant (Figure 3A). Inside these plasma clots, the hMSCs are viable, as demonstrated by the color change of the cell viability dye t24 from blue (control without cells) to pink (cellularized clot) (Figure 3B). Cell viability inside the clot is confirmed by H&E staining, showing a well-preserved cell morphology (Figure 3C). Furthermore, a minimal osteoinduction just before the second cell harvest gives rise to preliminary calcium deposition by stimulated hMSCs (Figure 3D).
Colony Forming Unit
The presence of hMSC colonies after 2 weeks in culture is shown by the CFU-F assay (Figure 4).
Application of MSC/fibrin clot construct in bone non-union
HMSC/fibrin clot constructs obtained as described in this method (step 1.1) were successfully applied to treat severe upper limb nonunions in 8 compassionate cases13. Long-term (maximum 7.6 months) assessment confirmed successful clinical and functional outcomes for all patients, without evidence of tissue overgrowth or tumor formation.
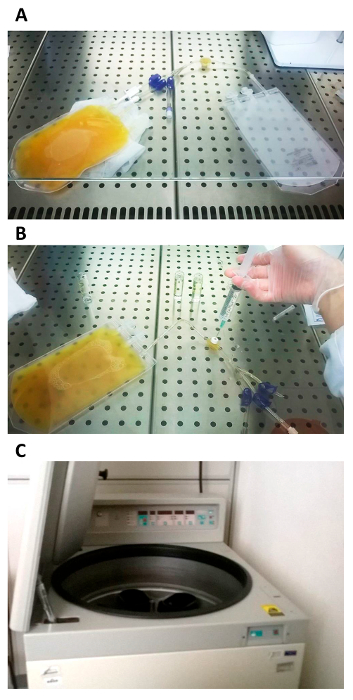
Figure 1. Preparation of Autologous Serum.
(A) The plasma unit is transferred in a transfer bag using the spike; (B) The plasma is coagulated by injecting calcium gluconate through the port connector; (C) A blood-bag centrifuge is used to separate the serum. Please click here to view a larger version of this figure.
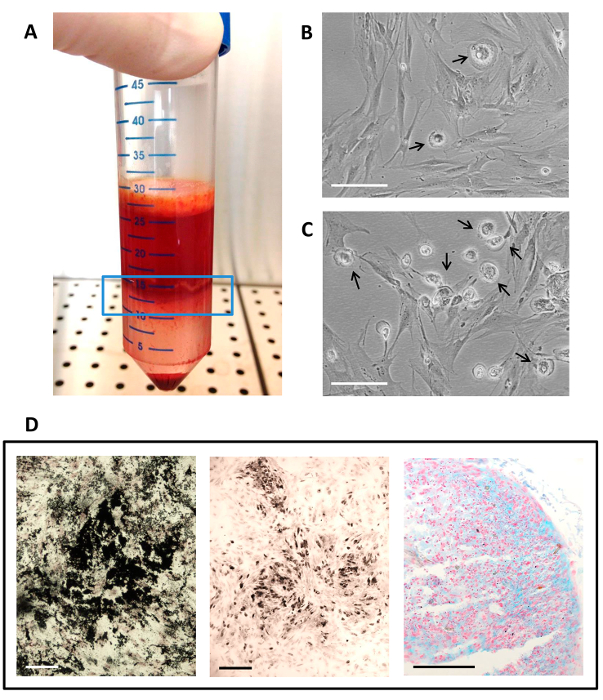
Figure 2. hMSC Isolation, Culture and Differentiation using Autologous Serum.
(A) The mononuclear cell layer (in the blue line window) obtained after bone marrow centrifuging with a density gradient; (B) The cell culture as it appears at P1; (C) Cell culture as it appears at P0 (primary culture); (B - C) Arrows show presence of MPCs in the MSC culture. Scale bar is 100 µm; (D) Histochemical results of multilineage differentiation assays. Osteogenic differentiation is assessed using von Kossa staining for mineral matrix deposition in black, adipogenic differentiation is shown by presence of fatty vacuoles, stained in black by osmium tetroxide, and chondrogenic differentiation is displayed by the presence of sulfated glycosaminoglycans, which are stained in cyan by Alcian Blue staining at pH 1. Scale bar is 50 µm. Please click here to view a larger version of this figure.
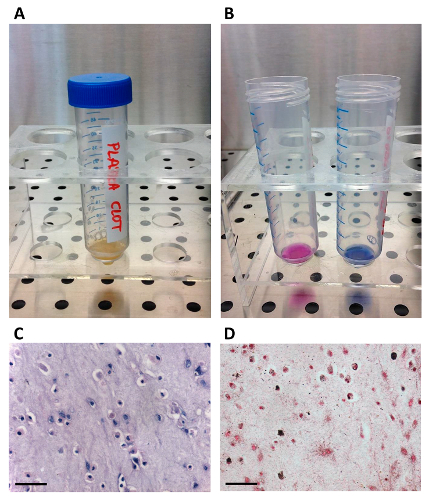
Figure 3. Preparation, Viability and Histologic Characterization of MSC/fibrin Clot Constructs.
(A) The hMSC/fibrin clot construct as it appears after cross-linking; (B) Outcomes of AB assay: the MSCs are viable inside fibrin clot, as demonstrated by the color change of the cell viability dye (t24), from blue (control without cells, on the right) to pink (cellularized clot, on the left). (C - D) Histochemical results of hMSC/fibrin clot constructs. Scale bar is 50 µm. (C) Hematoxylin and Eosin staining showing viable cells embedded in the fibrin matrix; (D) Mineral matrix deposition stained in black by von Kossa staining, which confirms an initial osteogenesis. Please click here to view a larger version of this figure.
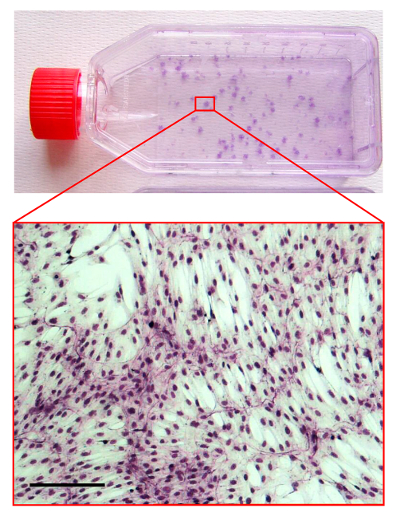
Figure 4. CFU-F Assay.
Picture of a flask cultured with hMSCs stained by May-Grunwald/Giemsa method. The zoomed-in area is a light-micrograph showing the morphology of a hMSC colony. Scale bar is 100 µm. Please click here to view a larger version of this figure.
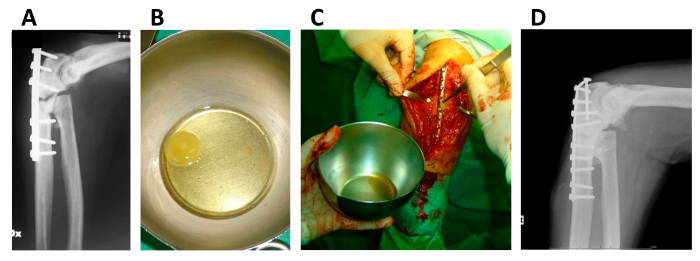
Figure 5. Application of hMSC/fibrin Clot Construct in Bone Nonunion.
(A) X-ray of the upper limb of a patient affected by pseudarthrosis; (B) hMSC/fibrin clot construct just before implantation; (C) Surgical application of the hMSC/fibrin clot construct; (D) X-ray of the upper limb of the same patient after 5 years. This figure is republished from Giannotti S. et al. with minimal modifications13. Please click here to view a larger version of this figure.
Discussion
The critical steps of this protocol concern the use of human adult serum and protease, which allow to obtain a biosafe hMSC therapy. In particular, the human adult serum enables isolation and maintenance, while protease ensures the harvest, of MPCs. These are immature cells present in the bone marrow that can give rise to fresh hMSCs, thus ensuring a reservoir of viable hMSCs along the culture time. Not all the MPCs can be collected, since increasing the exposure time to the protease activity is detrimental to hMSC viability. For this reason, a 10 min protease incubation was selected as optimal compromise between the recovery of MPCs and the viability of hMSCs. Another critical step is osteodifferentiation time. Indeed, an extensive in vitro osteodifferentiation would considerably reduce cell viability, thus affecting the final bone formation in vivo. The last critical step consists in availing of an autologous bioresorbable scaffold, which is obtained by embedding the cells (hMSCs and MPCs) in a fibrin gel from plasma clotting.
A key step to enhance the yield of MPCs is to seed mononuclear cells at higher concentration. Using apheresis procedures to obtain plasma and treating it with calcium gluconate makes it possible to achieve autologous serum in large amounts. It has been observed that human serum as a medium supplement is comparable to Fetal Bovine Serum (FBS) in hMSC cultures. However, in our experience, a complete medium supplemented with FBS contributes to faster senescence than human adult serum. A significant step is that of administering a minimal osteoinduction to hMSCs. Indeed, this treatment leads the cells to easily differentiate towards the osteogenic lineage, thus being useful to avoid further cell transformation in vivo. To maintain a good viability of minimally osteoinduced hMSCs, it is recommended to follow carefully the recommendations described in steps 6.5. and 8.2., including handling, centrifuging and medium amounts to be added. If an apheresis procedure is not available, it is still possible to carry out this protocol by performing multiple blood draws to the patient or, in alternative, by purchasing pooled AB sera. Obviously, in order to bring this protocol from the bench-to-bedside, it is mandatory to have GMP cell factories, or equivalents, available.
Limitations to the application of this technique concern the anemic, hematological-oncology and orthopedic patients affected by osteomyelitis., Drawing large amounts of blood from anemic patients, should be avoided. In oncologic patients, the quality of the cell samples is affected by chemotherapy treatments, whereas in osteomyelitis patients the infection can affect the final outcome. In all the cases in which the autologous serum is insufficient or unsuitable, pooled male AB sera represent a good alternative.
Using cell/fibrin clot constructs for possible clinical applications is crucial to release a completely autologous cell therapy, which could be easy to handle and mold during surgery, resulting in excellent outcomes to treat bone non-unions13. For clinical purposes, hMSCs are usually administered via two main procedures: minimal manipulation and extensive manipulation9. To overcome the problems related to an extensive ex vivo culture, such as abnormalities in cell morphology and size18, we performed a short time ex vivo cell expansion and osteo-differentiation (only 4 d).
The xeno-free protocol described in this paper, together with the short cell expansion and osteodifferentiation times, demonstrated to be relevant in clinics in order to obtain fast bone production in vivo, without evidence of tissue overgrowth and transformation, thus confirming its efficacy and long-term safety in bone repair (Figure 5)13.
The methodology presented in this report is aimed at demonstrating the efficacy and safety of hMSC in vitro expansion in autologous conditions for possible use in orthopedic surgery. This protocol employs hMSCs isolated from bone marrow and cultured in a medium supplemented with autologous serum and embedded in autologous fibrin clot, thus ensuring a completely autologous cell therapy. The two-fold osteogenic induction, just before the second detachment, improves hMSC ability to differentiate into osteoblasts. As a result, this technique is particularly suitable for applications in bone defects, since it is not limited to pseudarthrosis. Possible future applications could involve talus cyst and bone loss management.
Disclosures
The authors have nothing to disclose.
Acknowledgements
This study was funded by the Tuscany Region (grant number 539999_2014_Petrini_CUCCS). The authors would like to thank Prof. S. Berrettini for authorizing the use of the Otolab laboratory and instruments, and the surgery staff from the Orthopedic Clinic II of the University of Pisa, for the fundamental cooperation in sample harvesting. The support provided by Dr. F. Scatena is gratefully acknowledged. Finally, many thanks are due to Mr. J.G. De La Ossa for his precious contribution to histologic processing.
Materials
| Name | Company | Catalog Number | Comments |
|---|---|---|---|
| Triple Select (1x) | GIBCO, LIFE TECHNOLOGIES | 12563-029 | cell culture |
| Trypan blue stain | GIBCO, LIFE TECHNOLOGIES | 15250061 | cell culture |
| DMEM-LG, no glutamine, no phenol red | GIBCO, LIFE TECHNOLOGIES | 11880-028 | cell culture |
| Glutamax (100x) | Gibco, Life Technologies | 35050038 | cell culture |
| Penicillin/Streptomycin sol. | Gibco, Life Technologies | 15140122 | cell culture |
| Alamar Blue (AB) | Gibco, Life Technologies | DAL1025 | proliferation/viability assay |
| Ficoll-Paque Plus | GE Healthcare | 17-14440-02 | cell culture |
| D-PBS | Gibco, Life Technologies | 14190-094 | cell culture |
| StemMACS AdipoDiff Media | Miltenyi Biotech | 130-091-677 | cell culture |
| StemMACS ChondroDiff Media | Miltenyi Biotech | 130-091-679 | cell culture |
| hMSC Osteogenicdiff BulletKit | Euroclone | LOPT3002 | cell culture |
| Vitamin C (ascorbic acid) | Bayer | ATC Code: A11GA01 | Pharmaceutical grade drug |
| Flebocortid Richter (hydrocortisone) | Aventis Pharma | ATC Code: H02AB09 | Pharmaceutical grade drug |
| Victor X3, reader | PerkinElmer | 2030 multilabel reader | proliferation/viability assay |
| Silver nitrate | Sigma Aldrich | 209139 | histological assay |
| Pyrogallol | Sigma Aldrich | 16040 | histological assay |
| Sodium Thiosulphate | Sigma Aldrich | S8503 | histological assay |
| Histoplast LP | Thermo Scientific | 8332 | histological assay |
| Methanol | Sigma Aldrich | 32213 | histological assay |
| Ethanol | Sigma Aldrich | 2860 | histological assay |
| Nuclear fast red | Sigma Aldrich | 60700 | histological assay |
| Formalin | Bio-optica | 05-K01009-X40 | histological assay |
| Eosin B | Sigma Aldrich | 45260 | histological assay |
| DPX | Sigma Aldrich | 6522 | histological assay |
| Haematoxylin | Sigma Aldrich | H3136 | histological assay |
| Aluminium Sulphate | Sigma Aldrich | 202614 | histological assay |
| Xylol | Sigma Aldrich | 534056 | histological assay |
| Microtome | Leika | histological assay | |
| May Grunwald | Sigma Aldrich | MG1L-1L | histological assay |
| Giemsa | Sigma Aldrich | 32884-250ML | histological assay |
| Transfer bag | Biomérieux | BC0300031 | cell culture |
| Filtration kit | Macopharma | BC0800010 | cell culture |
| Calcium Gluconate | Galenica Senese | Pharmaceutical grade drug | |
| Bact Alert | Biomérieux | 259790 anaerobic | microbiological assay |
| Bact Alert | Biomérieux | 259789 aerobic | microbiological assay |
| Steryle Luer-Lok Syringe 50 mL | BD Plastipak | 300865 | cell processing |
| Heraeus Cryofuge 6000i | Thermo Scientific | blood bag centrifuging | |
| SL16R Centrifuge | Thermo Scientific | blood tube centrifuging |
References
- Horwitz, E. M., et al. Clarification of the nomenclature for MSC: The International Society for Cellular Therapy position statement. Cytotherapy. 7, 393-395 (2005).
- Kassem, M., Abdallah, B. M. Human bone marrow-derived mesenchymal stem cells: biological characteristics and potential role in therapy of degenerative diseases. Cell Tissue Res. 331, 157-163 (2008).
- Pittenger, M. F., et al. Multilineage potential of adult human mesenchymal stem cells. Science. 284, 143-147 (1999).
- Bonfield, T. L., Nolan Koloze, M. T., Lennon, D. P., Caplan, A. I. Defining human mesenchymal stem cells efficacy in vivo. J Inflamm. (Lond). 25 (7), 51(2010).
- Pneumaticos, S. G., Triantafyllopoulos, G. K., Chatziioannou, S., Basdra, E. K., Papavassiliou, A. G. Biomolecular strategies of bone augmentation in spinal surgery. Trends Mol. Med. 17 (4), 215-222 (2011).
- Amhed, T. A. E., Dare, E. V., Hincke, M. Fibrin: A versatile scaffold for tissue engineering applications. Tissue Engineering Part B. 14 (2), 199-215 (2008).
- Silbertein, L. E., Williams, L. J., Huglett, M. A., Magee, D. A., Weisman, R. A. An autologous fibrinogen-based adhesive for use in oncologic surgery. Transfusion. 28 (4), 319-321 (1988).
- Jockenhoevel, S., et al. Fibrin gel advantages of a new scaffold in cardiovascular tissue engineering. Eur. J. Cardiothorac Surg. 19 (4), 424-430 (2001).
- Veronesi, F., et al. Clinical use of bone marrow, bone marrow concentrate, and expanded bone marrow mesenchymal stem cells in cartilage disease. Stem Cells Dev. 22 (2), 181-192 (2013).
- Petrini, M., et al. Identification and purification of mesodermal progenitor cells from human adult bone marrow. Stem Cells Dev. 18 (6), 857-866 (2009).
- Trombi, L., et al. Selective culture of mesodermal progenitor cells. Stem Cells Dev. 18 (8), 1227-1234 (2009).
- Trombi, L., et al. Human autologous plasma-derived clot as a biological scaffold for mesenchymal stem cells in treatment of orthopedic healing. J. Orthop. Res. 26 (2), 176-183 (2008).
- Giannotti, S., et al. Use of autologous human mesenchymal stromal cell/fibrin clot constructs in upper limb non-unions: long term assessment. PlosOne. 8 (8), 73893(2013).
- Castano-Izquierdo, H., et al. Pre-culture period of mesenchymal stem cells in osteogenic media influences their in vivo bone forming potential. J. Biomed. Mater. Res. A. 82 (1), 129-138 (2007).
- Malkani, A. L., Fitzgerald, R. H., Kaufer, H. Orthopaedics. , Mosby. St. Louis, MO. Chapters 86-87 (2002).
- Lee, S. H., et al. ICSH guidelines for the standardization of bone marrow specimens and reports. Int J Lab Hematol. 30 (5), 349-364 (2008).
- Bugno, A., et al. Application of the BacT/ALERTR 3D system for sterility testingof injectable products. Braz J Microbiol. 46 (3), 743-747 (2015).
- Bonab, M. M., et al. Aging of mesenchymal stem cells in vitro. BMC Cell Biology. 7, 14(2006).
Reprints and Permissions
