Viruses or extracellular vesicles were immunocaptured with 15 nm magnetic nanoparticles coupled to antibodies recognizing surface antigens. The captured virions or vesicles were labeled with fluorescent antibodies against other surface antigens. The resultant complexes were separated in high magnetic field and analyzed with conventional flow cytometers triggered on fluorescence.
Method Article
Flow Virometry to Analyze Antigenic Spectra of Virions and Extracellular Vesicles
Opens in a new tab
In This Article
Summary
Loading...
$$\rightleftharpoonup{xx}$$
$$\longleftharp{xx}$$,
$$\longrightharp{xx}$$,
Abstract
Loading...
$$\rightleftharpoonup{xx}$$
$$\longleftharp{xx}$$,
$$\longrightharp{xx}$$,
Cells release small extracellular vesicles (EVs) into the surrounding media. Upon virus infection cells also release virions that have the same size of some of the EVs. Both virions and EVs carry proteins of the cells that generated them and are antigenically heterogeneous. In spite of their diversity, both viruses and EVs were characterized predominantly by bulk analysis. Here, we describe an original nanotechnology-based high throughput method that allows the characterization of antigens on individual small particles using regular flow cytometers. Viruses or extracellular vesicles were immunocaptured with 15 nm magnetic nanoparticles (MNPs) coupled to antibodies recognizing one of the surface antigens. The captured virions or vesicles were incubated with fluorescent antibodies against other surface antigens. The resultant complexes were separated on magnetic columns from unbound antibodies and analyzed with conventional flow cytometers triggered on fluorescence. This method has wide applications and can be used to characterize the antigenic composition of any viral- and non-viral small particles generated by cells in vivo and in vitro. Here, we provide examples of the usage of this method to evaluate the distribution of host cell markers on individual HIV-1 particles, to study the maturation of individual Dengue virions (DENV), and to investigate extracellular vesicles released into the bloodstream.
Introduction
Loading...
$$\rightleftharpoonup{xx}$$
$$\longleftharp{xx}$$,
$$\longrightharp{xx}$$,
Cells in multicellular organisms have many individual features that may be either unique for a particular cell or at least belong to unique groups of cells. Even cultured cloned cells show individual characteristics as evidenced by their diverse morphology. Also, a cell's individuality is reflected in the products it secretes. In the case of viral infection, viral particles can carry proteins from the cells that produced them. For example, for HIV many host cell proteins are embedded in the viral envelope and viruses that are generated by different cells may carry these characteristic proteins 1,2 or "cell signatures".
Even without infection, cells release into the surrounding media small extracellular vesicles (EVs). Biogenesis of these vesicles and their structure in many cases resemble that of viruses, especially retroviruses. In recent years it has become clear that EVs, which were initially considered to be "platelet dust" 3, constitute an important physiological system of cell-cell communication. Together with two other systems of intercellular communication, namely cell-cell contact interactions and released soluble molecules, EVs coordinate normal physiology and are altered in various pathologies 4,5 including viral infections 6,7.
Although both released viral particles and extracellular vesicles are highly diverse, they are characterized predominantly by bulk analysis in which their individual characteristics are lost. A method akin to flow cytometry, which phenotypes cells based on their different surface antigens, is needed to characterize individual viral and viral-like particles. Unfortunately, EVs or small virions cannot be analyzed using standard flow cytometry methods because they are too small to generate the light-scattering signal on which most cytometers rely for triggering. To circumvent this limitation, fluorescence triggering can be applied. However, if EVs or virions are stained with fluorescent antibodies it is difficult to distinguish them from free antibodies and their aggregates because of their similar fluorescence and comparable sizes.
Recently, we developed a nanotechnology-based high throughput method that allows the characterization of antigens on individual small particles using regular flow cytometers 8,9. We employ MNPs to immunocapture particles of interest, as has been described by other groups for diverse applications 10,11,12,13; however, our novel technique allows for the capture of individual specific targets followed by phenotyping of these captured particles by flow cytometry using fluorescence triggering rather than light scattering, without interference from free floating antibodies. This method has wide applications and can be used to characterize the antigenic composition of any viral- and non-viral small particle generated by cells in vivo and in vitro provided the availability of specific fluorescent antibodies against surface antigens. We have already applied this technique to study several biological problems.
In particular, we evaluated the distribution of host cell markers on individual HIV-1 particles 9, we studied the maturation of individual Dengue viruses (DENV) based on analysis of their surface proteins 14 and investigated EVs released into the bloodstream of healthy volunteers and patients with acute coronary syndrome (ACS). Although based on a similar principle, the application of the new technique required development of specific protocols that are described below.
Protocol
Loading...
$$\rightleftharpoonup{xx}$$
$$\longleftharp{xx}$$,
$$\longrightharp{xx}$$,
1. Coupling of Magnetic Nanoparticles (MNPs)
- Use commercial coupling procedure and reagents to couple MNPs with antibodies (Abs) (typically 1 mg). Iron oxide nanoparticles with carboxylic acid as reactive groups are used.
- If antibodies are in a volume higher than 0.5 ml, concentrate using a 100K concentrator. Spin at 2,000 x g for 3-5 min.
- At the end of the procedure, after adding 10 µl of the quenching buffer, transfer MNPs to a 12 mm x 75 mm tube and add 3 ml wash/storage buffer. Place the tube in the center hole of a magnetic separator and leave overnight at 4 °C.
- Verify that MNPs have all collected to the side of the tube, and then carefully pipet out all liquid. Add 3 ml of fresh wash/storage buffer, and place back in the magnet.
- After several hr, check if MNPs are collected to the side of the tube and then pipet off the liquid. Use 2 ml of wash/storage buffer to resuspend the MNPs and store at 4 °C.
- Verify that Abs are coupled to MNPs by labeling them with a relevant fluorescent Fab antibody fragment (e.g. goat anti-mouse if using a mouse monoclonal Ab for capture as described in section 2) and run on a flow cytometer.
2. Labeling Antibodies Coupled to MNPs
- Combine 60 µl (3.9 x 10¹² particles) of MNPs (per condition) and 5 µl (of a 200 µg/ml commercial solution) labeled Fab fragments, specific for the isotype of the capture Ab in a 1.5 ml microcentrifuge tube.
- Incubate at room temperature (RT) for 30 min with continuous mixing.
- Pre-wet a 100K concentrator with 300 µl of phosphate buffered saline (PBS) and spin in a microcentrifuge at 1,500 x g for 5 min.
- Purify labeled complexes on 100K column. Spin the mixture from step 2.2 in a microcentrifuge at 1,500 x g for 5 min, wash with 200 µl PBS, and recover in the initial volume.
3. Use of Labeled Ab-MNP Complexes to Capture Particles of Interest (Viruses or EVs)
- Incubate pre-labeled MNPs 60 µl (3.9 x 10¹² particles) with HIV (60 µl) or EV preparation (100 µl).
- Prepare EV preparations using various methods. Here, purify EVs on sucrose gradients, collect them from platelet poor plasma using exosome precipitation reagents or isolate directly from plasma 8.
NOTE: Optimal ratios need to be determined for each experiment and are dependent on concentration of virus/EV in the preparation. MNP-Ab fraction should be ~106 in excess compared to concentration of virus/EV fraction.
- Prepare EV preparations using various methods. Here, purify EVs on sucrose gradients, collect them from platelet poor plasma using exosome precipitation reagents or isolate directly from plasma 8.
- Incubate 40 min at 37 °C with gentle mixing for viruses, or 1 hr at 4 °C for EVs.
- Add 2.5% mouse IgG/ human IgG to block Fc binding, gently vortex, incubate 3-5 min at RT.
- Add manufacturer recommended or titered concentrations of each detection Abs and incubate additional 20 min at RT.
4. Separation of the MNP-captured Virions (or EVs) from Unbound Antibodies Using Magnetic Columns
- Prepare magnetic separation column for use by placing it in a separator magnet.
- Pre-wet the column with 500 µl of wash buffer (2 mM Ethylenediaminetetraacetic acid (EDTA), 0.5% bovine serum albumin (BSA) in PBS). Allow the wash buffer to flow through the column.
- Add the MNP-virus/MNP-EV complexes to the column and allow all liquid to flow through. Add 500 µl of wash buffer to the column, allowing the whole volume to pass through.
- Repeat washing with wash buffer 2 more times.
- Remove the column from magnet and place in 12 mm x 75 mm tube for collection of the retained MNP-virus/MNP-EV complexes. Let the column stand in the tube off the magnet for 3 min. Add 200 µl of PBS and let the beads flow down by gravity, add another 200 µl of PBS, and fix with 200 µl 4% paraformaldehyde after elution.
NOTE: Paraformaldehyde is a suspected carcinogen and should be handled in a ventilated hood and gloves should be worn. - To quantify single virions/EVs use volumetric settings on High Throughput Sampler (HTS) or just prior to acquisition add well-mixed flow cytometry count beads.
5. Analysis of MNPs-captured Viruses/EVs with a Flow Cytometer
- Warm up flow cytometer for 30 min.
- Run quality control beads.
- Set threshold on fluorescence of either MNPs or labeled viruses/EVs. Use 0.22 µm filtered PBS for threshold to decrease the background "noise". Set the threshold by adjusting the PMT voltage at the level where filtered PBS gives no, or very few, events.
- Run samples on low. (Use an additional 0.04 µm inline filter for sheath fluid placed in series behind the standard 0.2 µm sheath filter to further eliminate false events).
6. Evaluation of the Capture Efficiency
- Capture fluorescently labeled EVs or HIV with MNP-Abs as described in 3.1, 3.2. (EVs can be labeled either with a membrane dye or through their cargo 15; HIV can be labeled either through gene-encoded dye 16, or with a membrane dye 12,17).
- Prepare magnetic separation column as described in (4.1-4.2).
- Add the MNP-virus/MNP-EV complexes to the column and allow all liquid to flow through (flow through fraction). Collect the flow through fraction in tube.
- Proceed with fraction retained on the column as described in (4.4-4.5).
- Repeat capture procedure on the flow through fraction from 6.3 with subsequent separation (4.1-4.5).
- Analyze the retained fractions from first capture and second capture by running them on cytometer that is set on triggering on fluorescent label of EVs or HIV. To evaluate efficiency, compare the number of events in both fractions.
7. Adaptation of the Protocol for Specific Tasks
NOTE: While the protocol can be applied to analysis of HIV and EVs as described above, for analysis of DENV the following modifications should be introduced:
- Incubate virions with 1 µM DiI in the dark for 30 min at RT. After incubation purify stained virus by centrifugation in density gradient medium (10%, 20%, 25% and 35%) at 240,000 x g for 1.5 hr at 4 °C with no brake. Collect fraction between 20% and 25% density gradient medium layers 14.
- Incubate DiI labeled DENV 1 x 10⁷ (60 µl) with manufacturer recommended or titered concentrations of detection Ab in the presence of 2.5% mouse IgG for 20 min at RT.
- Incubate mixture with pre-labeled 60 µl (3.9 x 10¹² particles) MNP-capture Ab complexes for 40 min at 37 °C with gentle mixing.
- Separate resultant complexes from unbound Abs on magnetic columns as described above and analyze on flow cytometer.
Results
Loading...
$$\rightleftharpoonup{xx}$$
$$\longleftharp{xx}$$,
$$\longrightharp{xx}$$,
Selective capture of cellular antigens by HIV-1 virions
With "flow virometry" it is now possible to visualize cellular antigens on individual viral particles. As an example, we focused on two cellular antigens carried by HIV-1, LFA-1 and HLA-DR. Earlier these two antigens were identified in HIV-1 preparations analyzed in bulk 1. We prepared MNPs coupled with one of the antibodies against Env HIV protein, VRC01, and captured with these MNPs HIV-1 virions (HIV-1LAI.04 or HIV-1SF162 produced in peripheral blood mononuclear cells (PBMCs)). In addition, we stained these virions with 2G12, another anti-Env antibody. Flow virometry showed a high heterogeneity of HIV-1 virions regarding the presence of LFA-1 and HLA-DR. On average 16.7 ±2.0% (n = 6) and 8.6 ±0.3% (n = 3) of HIV-1LAI.04 virions carried LFA-1 and HLA-DR, respectively. Only 4.8 ±0.6% (n = 3) of all virions were positive for both antigens. On the other HIV-1 strain, HIV-1SF162, these antigens were present on 20.0 ±4.4% (n = 6) and 10.8 ±1.3% (n = 6) of virions, respectively, whereas both antigens were carried by 6.5 ±0.4% (Figure 1).
The distribution of the cellular proteins was dependent on the cells that replicated virus. HIV-infected Jurkat cells produced virions antigenically different from those produced by infected PBMCs. Virions of HIV-1LAI 0.4 produced by Jurkat cells carried 1.6 ±1.4% (n = 3) and 1.6±0.7% (n = 4) LFA-1 and HLA-DR respectively. For HIV-1SF162 virions produced in Jurkat cells, these parameters were 7.2 ±2.5% (n = 3) and 5.6 ±2.7% of (n = 4). Thus, antigenic makeup (at least for HLA-DR and LFA-1) was different for HIV-1LAI.04 produced by two different cell types (p <0.02).
Flow virometry as applied to evaluation of Dengue virus
DENV maturation is associated with the expression of prM protein on the virions. We applied flow virometry to evaluate what fraction of DENV produced in BHK-1 and in LoVo cells constitutes mature viruses. Virions were stained with a lipidic dye DiI. Analysis of individual captured virions revealed prM on 48.2 ±5.3% (n = 8) of DENVs. In contrast, 84.5 ±3.4% (n = 4) of DENV produced in LoVo cells carried prM. The rest of the virions, respectively 51.8 ±5.3% (n = 8) and 15.5 ±3.4% (n = 4) were prM negative (Figure 2). Thus, flow virometry can be used to distinguish fully mature individual DENV from immature (or partially mature) DENV virions.
Extracellular vesicles released into bloodstream of healthy volunteers and patients with acute coronary syndrome (ACS)
In order to investigate different EV subsets in patients with ACS and healthy controls, we captured EVs from platelet poor plasma (PPP) by fluorescent MNPs-coupled with antibodies against CD31, CD41a, or CD63. EVs captured by CD31-MNPs were stained for CD41a and CD63, EVs captured by CD41a-MNPs were stained for CD31 and CD63, and EVs captured by CD63-MNPs were stained for CD31 and CD41a (Figure 3).
The amount of EVs captured by CD31-MNPs and positive for one or two of the detection antibodies in ACS patients was 3,359 [2,328; 5,472] EVs/µl in comparison with 1,272 [714; 2,157] EVs/µl in healthy volunteers (p = 0.001). The total amount of EVs captured by CD63 in ACS patients in comparison with healthy volunteers was 3,541 [1,318; 5,173] EVs/µl vs. 806 [488; 2,112] EVs/µl (p = 0.007). There were 4,752 [3,238; 7,173] EVs/µl in plasma of patients with ACS captured by CD41a-MNPs, whereas in plasma of healthy volunteers this number was significantly lower, 2,623 [1,927; 4,188] EVs/µl (p = 0.015). In general, our results indicate that, while EV amounts were mostly increased in ACS patients, the magnitude of the increase was different in different sub-populations of EVs.
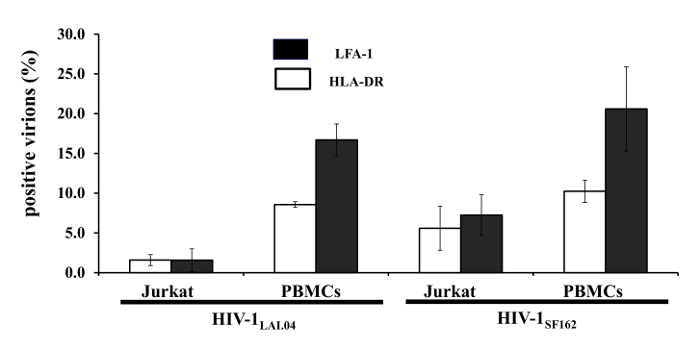
Figure 1: Selective incorporation of cellular antigens in HIV-1 virions replicating in different cell types. HIV (HIV-1LAI.04 or HIV-1SF162) virions released by PBMCs or Jurkat cells were captured with VRC01-MNPs and stained with second anti-gp120 antibody 2G12 and with specific antibodies against HLA-DR and LFA-1. The stained preparations were subjected to flow analysis for HLA-DR (white bars) and LFA-1 (black bars). Means ± SEM of three to six experiments 9. Please click here to view a larger version of this figure.
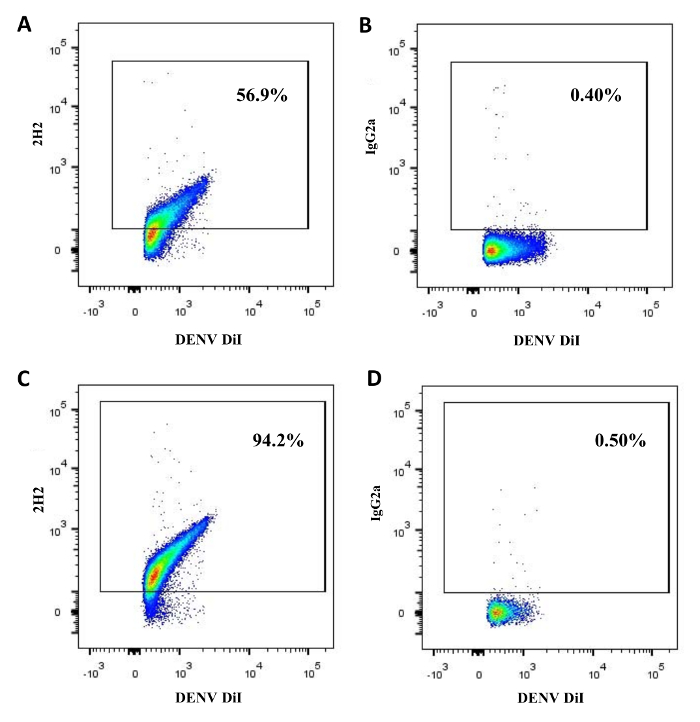
Figure 2: Maturation state of DENV virions. DENV produced in BHK-21 cells (A, B) or in LoVo cells (C, D) were labeled with the lipidic dye DiI and, after ultracentrifugation in density gradient medium, stained for prM protein with 2H2 antibodies (A, C) or with isotype control IgG2a (B, D). The labeled virions were then captured with 3H5-1-MNPs and subjected to flow analysis 14. Please click here to view a larger version of this figure.
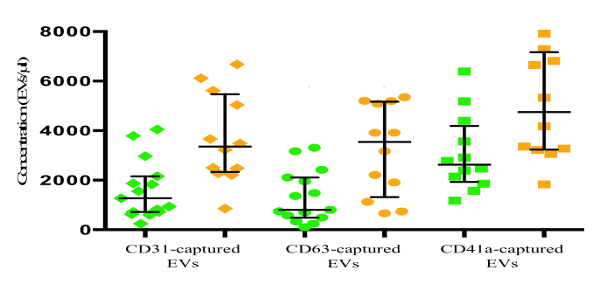
Figure 3: Analysis of EVs from ACS patients and healthy controls. Plasma EVs were captured with CD31-MNPs, CD63-MNPs or CD41a-MNPs and stained with antibodies against CD41a and CD63, against CD31 and CD41a and against CD31 and CD63, respectively. Captured EVs, stained with at least one of the detection Abs, were visualized and enumerated in flow analysis. Data presented as dot plot with median and interquartile range (IQR). Green symbols: healthy volunteers (controls), brown symbols: ACS patients. Please click here to view a larger version of this figure.
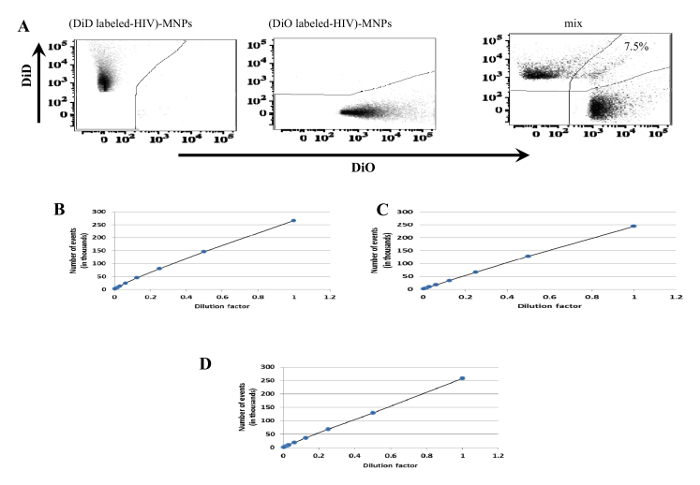
Figure 4: Evaluation of the fraction of flow events that represent individual virions. (A) HIV-1. Suspension of virions was divided into two parts and stained either with DiD (left panel) or DiO (middle panel). After mixing, the suspension, that contained two differentially stained virions, was captured with VRC01-MNPs and subjected to flow virometry (right panel). Aggregates (dual-colored events) constituted less than 10% of total events. (B-D) DENV. Suspension of DiI-stained virions was serially diluted two fold from 1:2 to 1:256 and acquired with HTS on a flow cytometer (B). DiI-DENVs were labeled with 2H2 antibodies (C) or DiI-DENVs were captured with 3H5-1-MNPs (D). Preparations C and D were then serially diluted two fold from 1:2 to 1:256 and acquired with HTS 14. Virions do not seem to aggregate since in all cases there is a linear correlation between the dilution factor and the number of the events. Please click here to view a larger version of this figure.
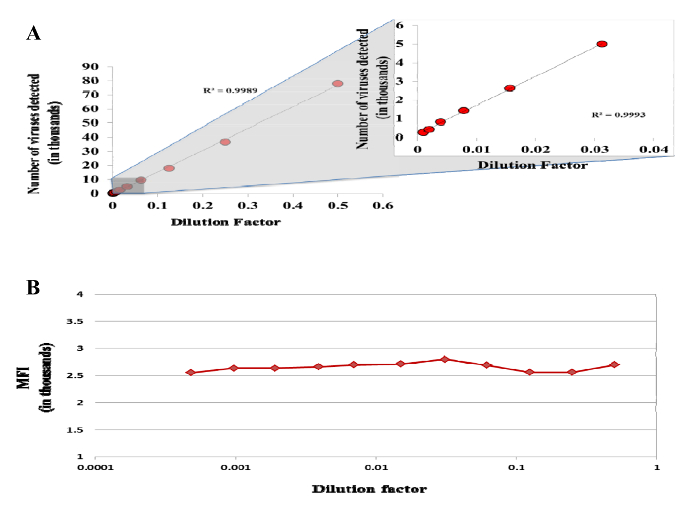
Figure 5: Detection of single particles by flow cytometer. DiI-stained DENV suspension was serially diluted two fold from 1:2 to 1:2,048 and acquired using an HTS on a flow cytometer. (A) Number of viruses detected as a function of the dilution factor. (B) Median fluorescence intensity (MFI) of DiI labeled DENV 14. Please click here to view a larger version of this figure.
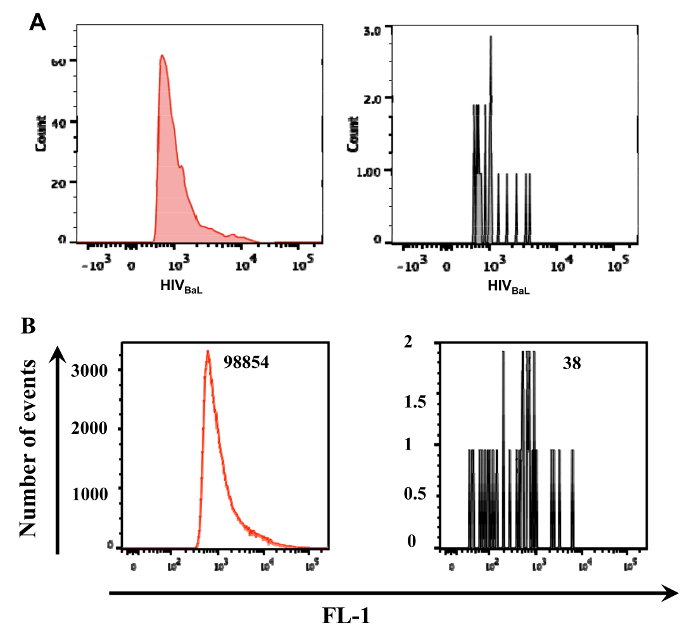
Figure 6: Evaluation of the fraction of virions and extracellular vesicles captured with MNPs coupled to specific antibodies. Labeled HIV-1 virions or EVs were captured with MNPs coupled to specific antibodies and subjected to flow virometry. After separation on magnetic columns, the flow-through (not retained) fractions were analyzed for the presence of virions or EVs of interest that were missed in the first run. (A) Labeled HIV-1 BaL virions were captured with 2G12-MNPs (left panel). The flow-through fraction was recaptured and subjected to flow virometry (right panel). In the first cycle about 95% of the virions of interest were captured. (B) Labeled EVs were captured with anti-CD81 MNPs and isolated on magnetic columns (left panel). The flow-through fraction was re-captured and analyzed (right panel). In the first cycle about 99% of the vesicles of interest were captured 8. Please click here to view a larger version of this figure.
Discussion
Loading...
$$\rightleftharpoonup{xx}$$
$$\longleftharp{xx}$$,
$$\longrightharp{xx}$$,
Conventional flow cytometers remain the major tool for analyzing cells based on their physical and chemical characteristics on an individual level 18. The basic principles of flow cytometry have not been changed since its development: a cell that passes through the laser beam and scatters light constitutes an event that triggers the recording of the fluorescent spectra emitted by cell-bound fluorescent antibodies. Smaller particles below 300 nm cannot be detected by side scatter of a cytometer as they scatter more light under larger angles at which most flow cytometer do not collect light 18. The technique described here, allows the identification and the analysis of multiple antigens on numerous individual viruses or EVs by conventional flow cytometers with fluorescence triggering.
The critical steps within the protocol are the coupling of antibodies to MNPs. Our experiments were performed using 15 nm iron oxide nanoparticles with carboxylic acid as a reactive group as described previously 9. According to the manufacturer, each 15 nm MNP can bind a maximum of 20 antibodies; we bind approximately 10 antibodies per 15 nm MNP. This estimate is based on the amount of antibodies before and after coupling and the number of beads/mL as measured by nanoparticle characterization and sizing instrumentation. In principle, coupling may cause aggregation of particles and is undesirable. To check that aggregation is not happening with our protocol, we verified this with nanoparticle characterization and sizing instrumentation. This instrument measures the hydrodynamic diameter for the particles, which includes the coating and antibody layers rather than the 15 nm core only. We found that the majority of coupled beads are located at a single peak (mean peak at 64.7 ±4.2 nm with 90% of all events below 73 ±7.3 nm). The mixing of Ab-MNP complexes with virions or EVs in the right proportion is important so that MNPs are in the concentration of several orders higher than EVs/virions. This is critical to ensure that single EVs/virions are analyzed. Avoid coincidences of the events by running cytometer at low flow. Ensure to trigger the acquisition on fluorescence and use volumetric controls to measure the concentration of the captured entities.
However, MNPs can aggregate EVs or virions by crosslinking or by the binding of two or more virions to the same nanoparticle. To check this, a test for aggregation as described in Figure 4 has to be performed. Even individually captured virions or EVs may simultaneously enter the laser beam of the flow cytometer. This would create false-positivity for two different antigens. To avoid this, the flow cytometer should be set as described and the preparations should be diluted. One can check whether coincidence is happening by using the same strategy as described in the previous point. Also, the lack of coincidence could be verified by analyzing serial dilutions of the preparation and proving that the number of events decreases linearly with the dilution while the mean fluorescence intensity of a fluorescently stained antigen remains constant in all dilutions (Figure 5). Another issue is that too few viruses/EVs can be captured. This can be due to the true scarcity of viruses/EVs that carry antigens through which they are captured by specific MNPs. Alternatively, the efficiency of capture is low due to various reasons (e.g., inefficient coupling of antibodies to MNPs, deviation from the ratios of MNPs to virions/EVs developed for this protocol, etc.). To avoid the latter possibility, the efficiency of capture should be specifically evaluated. Typically, the efficiency should be about 90% as in Figure 6.
Different antibodies can interfere due to steric hindrance with each other or with the antibodies coupled to MNPs. To check that this did not happen a reverse capture protocol must be tested (as described in Section 7. Briefly, virions or EVs should be first stained with fluorescent detection Abs and then captured by Ab-MNP complexes with subsequent separation from free floating Abs on magnetic columns.
Flow virometry has significant advantages with respect to existing methods of analysis of the antigenic composition of virions or EVs. Routine biochemical methods report on the general presence of particular proteins in the preparations, but provide no information on the heterogeneity of the virions or EVs. This includes immunocapture of virions or EVs on large commercially available particles. Such particles are typically of several microns in diameter and each of them can capture hundreds or thousands of virions or EVs. Therefore, any subsequent analysis averages the properties of the virions/EVs captured by one particle. In contrast, flow virometry uses MNPs of 10-15 nm in diameter and with the described protocol at least 90% of events represent a single virion or single EV.
The main limitation is that the entire population of virions or EVs in the preparation might not be analyzed, but only those that are captured. Thus, the choice of the antigen through which virions or EVs are captured becomes critical. Also, unlike flow cytometry the number of different antigens (the number of fluorescent antibodies against different antigens) is limited by the small surface of virions or EVs. Finally, different antibodies may sterically interfere with each other again due to the small (compared to the cells) surface.
The current protocol can be adapted for analysis of any virus or EV of any origin, provided that the specific antibodies through which they can be captured are available. Analysis of antigens on individual virions permits researchers to address the pathogenesis of different fractions of viral populations. Furthermore, identification of individual EVs in plasma may make it possible to trace the origin of EVs to particular cells and to report about normal or pathological conditions of these cells and the organs in which they reside.
Disclosures
Loading...
$$\rightleftharpoonup{xx}$$
$$\longleftharp{xx}$$,
$$\longrightharp{xx}$$,
The authors declare no conflict of interest.
Acknowledgements
Loading...
$$\rightleftharpoonup{xx}$$
$$\longleftharp{xx}$$,
$$\longrightharp{xx}$$,
This work of AA, SZ, WF, J-C.G, and LM was supported by the NICHD Intramural Program. The work of MV was supported by the Russian Federation Government grant #14.B25.31.0016.
Materials
| Name | Company | Catalog Number | Comments |
|---|---|---|---|
| Materials | |||
| Carboxyl Magnetic Iron Oxide Nanoparticles Conjugation Kits | Ocean Nanotech | ICK-15-005 | |
| Amicon Ultra-4 Centrifugal Filter Unit with Ultracel-100 membrane | Millipore | UFC810024 | |
| 5 ml Round Bottom PP Test Tube, without Cap | Falcon | 352002 | |
| DEPC treated water | Quality Biological | 351-068-131 | |
| SuperMAG-01 magnetic separator | Ocean Nanotech | SuperMAG-01 | |
| Zenon R-Phycoerythrin Mouse IgG1 Labeling Kit | Thermo Fisher Scientific | Z25055 | |
| Nanosep Centrifugal Devices with Omega Membrane 100k | Pall Corp | OD100C34 | |
| EDTA 0.5 M | Corning Cellgro | 46-034-CI | |
| Bovine Serum Albumin solution | Sigma-Aldrich | A9576-50ML | |
| PBS | Gibco | 10010-23 | |
| Paraformaldehyde, EM Grade, Purified | EMS | 15710 | |
| 123 count eBeads | eBioscience | 01-1234-42 | |
| CytoCount beads | Dako | S2366 | |
| AccuCheck count beads | Invitrogen | PCB100 | |
| Cytometer Setup & Tracking Beads Kit (CST) | BD Bioscience | 642412 | |
| Vybrant DiI Cell-Labeling Solution | Thermo Fisher Scientific | V22885 | |
| Name | Company | Catalog Number | Comments |
| Equipment | |||
| µMACS column | Miltenyi Biotec | 130-042-701 | |
| OctoMACS Separator magnet | Miltenyi Biotec | 130-042-108 | |
| Nanodrop | ThermoFisher | none | |
| NanoSight NS300 | Malvern | none | |
| BD LSRII flow cytometer | BD Bioscience | none | |
| Name | Company | Catalog Number | Comments |
| Software | |||
| Flowjo software | Flowjo | ||
| BD FACSDiva software | BD |
References
Loading...
$$\rightleftharpoonup{xx}$$
$$\longleftharp{xx}$$,
$$\longrightharp{xx}$$,
- The acquisition of host-encoded proteins by nascent HIV-1. Immunol Today. 19 (8), 346-351 (1998).">Tremblay, M. J., Fortin, J. F., Cantin, R. The acquisition of host-encoded proteins by nascent HIV-1. Immunol Today. 19 (8), 346-351 (1998).
- Virus-producing cells determine the host protein profiles of HIV-1 virion cores. Retrovirology. 9, 65(2012).">Santos, S., Obukhov, Y., Nekhai, S., Bukrinsky, M., Iordanskiy, S. Virus-producing cells determine the host protein profiles of HIV-1 virion cores. Retrovirology. 9, 65(2012).
- The nature and significance of platelet products in human plasma. Br J Haematol. 13 (3), 269-288 (1967).">Wolf, P. The nature and significance of platelet products in human plasma. Br J Haematol. 13 (3), 269-288 (1967).
- Circulating microparticles: pathophysiology and clinical implications. Blood Rev. 21 (3), 157-171 (2007).">Piccin, A., Murphy, W. G., Smith, O. P. Circulating microparticles: pathophysiology and clinical implications. Blood Rev. 21 (3), 157-171 (2007).
- High levels of circulating endothelial microparticles in patients with acute coronary syndromes. Am Heart J. 145 (6), 962-970 (2003).">Bernal-Mizrachi, L., et al. High levels of circulating endothelial microparticles in patients with acute coronary syndromes. Am Heart J. 145 (6), 962-970 (2003).
- Platelet- and megakaryocyte-derived microparticles transfer CXCR4 receptor to CXCR4-null cells and make them susceptible to infection by X4-HIV. Aids. 17 (1), 33-42 (2003).">Rozmyslowicz, T., et al. Platelet- and megakaryocyte-derived microparticles transfer CXCR4 receptor to CXCR4-null cells and make them susceptible to infection by X4-HIV. Aids. 17 (1), 33-42 (2003).
- GB virus C particles inhibit T cell activation via envelope E2 protein-mediated inhibition of TCR signaling. J Immunol. 190 (12), 6351-6359 (2013).">Bhattarai, N., et al. GB virus C particles inhibit T cell activation via envelope E2 protein-mediated inhibition of TCR signaling. J Immunol. 190 (12), 6351-6359 (2013).
- Antigenic composition of single nano-sized extracellular blood vesicles. Nanomedicine. 11 (3), 489-498 (2015).">Arakelyan, A., Ivanova, O., Vasilieva, E., Grivel, J. C., Margolis, L. Antigenic composition of single nano-sized extracellular blood vesicles. Nanomedicine. 11 (3), 489-498 (2015).
- Nanoparticle-based flow virometry for the analysis of individual virions. J Clin Invest. 123 (9), 3716-3727 (2013).">Arakelyan, A., Fitzgerald, W., Margolis, L., Grivel, J. C. Nanoparticle-based flow virometry for the analysis of individual virions. J Clin Invest. 123 (9), 3716-3727 (2013).
- Chemiluminescent labels released from long spacer arm-functionalized magnetic particles: a novel strategy for ultrasensitive and highly selective detection of pathogen infections. ACS Appl Mater Interfaces. 7 (1), 774-781 (2015).">Yang, H., Liang, W., He, N., Deng, Y., Li, Z. Chemiluminescent labels released from long spacer arm-functionalized magnetic particles: a novel strategy for ultrasensitive and highly selective detection of pathogen infections. ACS Appl Mater Interfaces. 7 (1), 774-781 (2015).
- Highly sensitive and rapid detection of Pseudomonas aeruginosa based on magnetic enrichment and magnetic separation. Theranostics. 3 (2), 85-92 (2013).">Tang, Y., et al. Highly sensitive and rapid detection of Pseudomonas aeruginosa based on magnetic enrichment and magnetic separation. Theranostics. 3 (2), 85-92 (2013).
- Magnetic separations in biotechnology. Biotechnol Adv. 31 (8), 1374-1385 (2013).">Borlido, L., Azevedo, A. M., Roque, A. C., Aires-Barros, M. R. Magnetic separations in biotechnology. Biotechnol Adv. 31 (8), 1374-1385 (2013).
- Selection of HBsAg-Specific DNA Aptamers Based on Carboxylated Magnetic Nanoparticles and Their Application in the Rapid and Simple Detection of Hepatitis B Virus Infection. ACS Appl Mater Interfaces. 7 (21), 11215-11223 (2015).">Xi, Z., et al. Selection of HBsAg-Specific DNA Aptamers Based on Carboxylated Magnetic Nanoparticles and Their Application in the Rapid and Simple Detection of Hepatitis B Virus Infection. ACS Appl Mater Interfaces. 7 (21), 11215-11223 (2015).
- Evaluation of the maturation of individual Dengue virions with flow virometry. Virology. 488, 20-27 (2016).">Zicari, S., et al. Evaluation of the maturation of individual Dengue virions with flow virometry. Virology. 488, 20-27 (2016).
- Visualization and tracking of tumour extracellular vesicle delivery and RNA translation using multiplexed reporters. Nat Commun. 6, 7029(2015).">Lai, C. P., et al. Visualization and tracking of tumour extracellular vesicle delivery and RNA translation using multiplexed reporters. Nat Commun. 6, 7029(2015).
- Visualization of the intracellular behavior of HIV in living cells. J Cell Biol. 159 (3), 441-452 (2002).">McDonald, D., et al. Visualization of the intracellular behavior of HIV in living cells. J Cell Biol. 159 (3), 441-452 (2002).
- Elimination of retroviral infectivity by N-ethylmaleimide with preservation of functional envelope glycoproteins. J Virol. 79 (3), 1533-1542 (2005).">Morcock, D. R., et al. Elimination of retroviral infectivity by N-ethylmaleimide with preservation of functional envelope glycoproteins. J Virol. 79 (3), 1533-1542 (2005).
- Practical Flow Cytometry. , John Wiley & Sons, Inc. 101-223 (2005).">Shapiro, H. M. Practical Flow Cytometry. , John Wiley & Sons, Inc. 101-223 (2005).
Reprints and Permissions
Request permission to reuse the text or figures of this JoVE article
Request Permission