The simultaneous evaluation of cerebral hemodynamics and the light scattering properties of in vivo rat brain tissue is demonstrated using a conventional multispectral diffuse reflectance imaging system.
A subscription to JoVE is required to view this content. Sign in or start your free trial.
Method Article
Simultaneous Evaluation of Cerebral Hemodynamics and Light Scattering Properties of the In Vivo Rat Brain Using Multispectral Diffuse Reflectance Imaging
In This Article
Summary
Abstract
The simultaneous evaluation of cerebral hemodynamics and the light scattering properties of in vivo rat brain tissue is demonstrated using a conventional multispectral diffuse reflectance imaging system. This system is constructed from a broadband white light source, a motorized filter wheel with a set of narrowband interference filters, a light guide, a collecting lens, a video zoom lens, and a monochromatic charged-coupled device (CCD) camera. An ellipsoidal cranial window is made in the skull bone of a rat under isoflurane anesthesia to capture in vivo multispectral diffuse reflectance images of the cortical surface. Regulation of the fraction of inspired oxygen using a gas mixture device enables the induction of different respiratory states such as normoxia, hyperoxia, and anoxia. A Monte Carlo simulation-based multiple regression analysis for the measured multispectral diffuse reflectance images at nine wavelengths (500, 520, 540, 560, 570, 580, 600, 730, and 760 nm) is then performed to visualize the two-dimensional maps of hemodynamics and the light scattering properties of the in vivo rat brain.
Introduction
Multispectral diffuse reflectance imaging is the most common technique for obtaining a spatial map of intrinsic optical signals (IOSs) in cortical tissue. IOSs observed in the in vivo brain are mainly attributed to three phenomena: variations in light absorption and scattering properties due to cortical hemodynamics, variation in absorption depending on the reduction or oxidization of cytochromes in mitochondria, and variations in light scattering properties induced by morphological alterations1.
Light in the visible (VIS) to near-infrared (NIR) spectral range is effectively absorbed and scattered by biological tissue. The diffuse reflectance spectrum of the in vivo brain is characterized by absorption and scattering spectra. The reduced scattering coefficients μs' of brain tissue in the VIS-to-NIR wavelength range result in a monotonous scattering spectrum exhibiting smaller magnitudes at longer wavelengths. The reduced scattering coefficient spectrum μs'(λ) can be approximated to be in the form of the power law function2,3 as μs'(λ) = a × λ-b. The scattering power b is related to the size of biological scatterers in living tissue2,3. Morphological alterations of the tissue and reduction of the viability of living cortical tissue can affect the size of the biological scatterers4,5,6,7,8,9.
An optical system for multispectral diffuse reflectance imaging can be easily constructed from an incandescent light source, simple optical components, and a monochromatic charged-coupled device (CCD). Therefore, various algorithms and optical systems for multispectral diffuse reflectance imaging have been used to evaluate cortical hemodynamics and/or tissue morphology10,11,12,13,14,15,16,17,18.
The method described in this article is used to visualize both the hemodynamics and light scattering properties of rat cerebral tissue in vivo using a conventional multispectral diffuse reflectance imaging system. The advantages of this method over alternative techniques are the ability to evaluate spatiotemporal changes in both cerebral hemodynamics and cortical tissue morphology, as well as its applicability to various brain dysfunction animal models. Therefore, the method will be appropriate for investigations of traumatic brain injury, epileptic seizure, stroke, and ischemia.
Access restricted. Please log in or start a trial to view this content.
Protocol
Animal care, preparation, and experimental protocols were approved by the Animal Research Committee of Tokyo University of Agriculture and Technology. For this methodology, the rat is housed in a controlled environment (24 °C, 12 h light/dark cycle), with food and water available ad libitum.
1. Construction of a Conventional Multispectral Diffuse Reflectance Imaging System
- Mount nine narrowband optical interference filters with center wavelengths of 500, 520, 540, 560, 570, 580, 600, 730, and 760 nm to the filter holes of the motorized filter wheel.
- Construct a multispectral imaging system using a broadband white light source, a motorized filter wheel with the above set of narrowband interference filters, a light guide, a collecting lens, a video zoom lens, and a monochromatic CCD camera. The layout of optical components, shown in Figure 2, can be referred to for this construction procedure.
NOTE: The angle of illumination is approximately 45° with respect to the sample surface. - Turn on the halogen lamp light source to illuminate the surface of the sample via an interference filter, the light guide, and the collecting lens.
- Open the operating software of the CCD camera.
2. Animal Preparation
NOTE: In this protocol, the rat was not used for the future experiments and it was sacrificed immediately after the measurements of multispectral images.
- Connect the inlet port of an induction chamber to the outlet port of an anesthesia machine with a tube. Connect the outlet port of the induction chamber to the inlet port of the anesthesia machine with a second tube.
- Place the rat into the induction chamber and induce anesthesia with 5.0% isoflurane. Maintain anesthesia at a depth such that the rat does not respond to toe pinches. Lower to 2.0% isoflurane using a rotary knob on the anesthesia machine.
- Fix the rat head in a stereotaxic frame. Attach a mouthpiece for anesthesia to the stereotaxic frame.
- Connect the inlet port of the mouthpiece to the outlet port of the anesthesia machine with a tube. Connect the outlet port of the mouthpiece to the inlet port of the anesthesia machine with a tube.
- Shave the head region beyond the prospective incision site using hair clippers until the skin surface appears.
- Make a longitudinal incision approximately 20 mm long along the midline of the head using a surgical scalpel (Figure 1(a)) and expose the subcutaneous connective tissues (Figure 1(b)).
- Remove the subcutaneous connective tissues using a sharp curette or a pincer and pull it to both sides of the head to expose the skull bone (Figure 1(c)).
- Dig an ellipsoidal ditch on the skull bone inside the cranial sutures (coronal suture, sagittal suture, and lambdoid suture) using a high-speed drill (Figure 1(d)).
- Slowly and homogenously excavate the skull bone inside the ditch using the high-speed drill.
- Press lightly on the surface of the thinned skull with the tip of the pincer to estimate the bone thickness and strength after a cerebral blood vessel appears. If the thinned skull region depresses easily, terminate the reduction of the skull bone with the high-speed drill.
- Cut the ellipsoidal border line of the thinned skull piecemeal using the tip of the pincer or small surgical scissors.
- Remove the thinned skull from the brain surface slowly and gently using the pincer.
- Gently bathe the cranial window with physiological saline and cover it with a transparent glass plate approximately 0.1 mm thick.
3. Regulating the Fraction of Inspired Oxygen
NOTE: The respiratory condition can be changed by regulating the fraction of inspired oxygen (FiO2).
- Using a tube, connect the first port of a Y-shaped tube connector (connector 1) to the first port of another Y-shaped tube connector (connector 2).
- Connect the inlet port of the mouthpiece to the second port of tube connector 1.
- Using a tube, connect the third port of tube connector 1 to an oxygen concentration monitor device.
- With a tube, connect the second port of tube connector 2 to the outlet port of an anesthesia machine.
- Using a tube, connect the third port of tube connector 2 to the outlet port of a gas mixture device.
- Connect one inlet port of the gas mixture device to a high-pressure 95% O2 - 5% CO2 gas cylinder using a tube.
- Connect the other inlet port of the gas mixture device to a high-pressure 95% N2 - 5% CO2 gas cylinder using a tube.
- Change the gas flow rates of O2 and N2 using the rotary knobs on the gas mixture device.
- Check and regulate the FiO2 using the oxygen concentration monitor device.
4. Acquisition of the Multispectral Diffuse Reflectance Images
- Acquisition of reference images
NOTE: The optical components used in this experiment, such as the light source, optical fiber, and detectors have their own spectral characteristics. Therefore, the intensity of light passed through these components should be recorded as a reference image. The reference image is an image taken with a standard white diffuser illuminated with the light from the light source.- Put the standard white diffuser on the stage horizontally.
- Focus the camera lens on the surface of the white diffuser by rotating the zoom ring on the barrel.
- Adjust the integration time of the camera by selecting the appropriate value from the drop-down list of integration times in the operating software of the camera so that the greatest amount of light produces a signal that is approximately 75% of the maximum counts. While watching the histogram of pixel values, adjust the integration time until the signal intensity level is approximately 75% of the maximum counts.
- Select the "save" command from the file menu to save an image to a file.
- Change the filter location by rotating the filter wheel.
- Save an image at the other wavelengths according to the process described above. The file name should identify the sample and the wavelength used (e.g., W500, W520, W540 … W760).
- Acquisition of sample images
Note: Images of diffusely-reflected light intensity of exposed rat brain at nine wavelengths are captured and saved on the hard drive of a personal computer using the same acquisition conditions.- Gently place the rat on the stage and slowly adjust the stage level so that the camera can focus on the surface of the rat brain.
- Select the "save" command from the file menu to save an image to a file.
- Change the filter location by rotating the filter wheel.
- Save an image at the other wavelengths according to the process described above. The file name should identify the sample and the wavelength (e.g., R500, R520, R540 … R760).
- Acquisition of dark images
NOTE: The CCD camera can generate a light intensity in response to an electrical signal. However, there is some minor output due to noise in the electric circuits and detectors, even if light does not enter to the detector; this is called dark current noise. To accurately measure the spectral intensity of light, the dark current component should be recorded as a dark image and then subtracted from the measured signal. The dark image is an image taken with the light path blocked.- Turn off the halogen lamp light source.
- Block the light path to the CCD camera system using a shielding plate.
- Select the "save" command from the file menu to save an image to a file. The file name should identify the sample (e.g., Dark).
5. Visualizing the Hemoglobin Content and the Light Scattering Parameter
NOTE: A set of multispectral diffuse reflectance images is saved to the hard drive of a personal computer and analyzed offline. A multiple regression analysis aided by a Monte Carlo simulation19 of the multispectral diffuse reflectance images at nine wavelengths (500, 520, 540, 560, 570, 580, 600, 730, and 760 nm) is then performed to visualize the two-dimensional maps of oxygenated hemoglobin concentration, deoxygenated hemoglobin concentration, total hemoglobin concentration, regional cerebral oxygen saturation, and scattering power. The detailed algorithm has been published in the literatures17,18.
- Subtract the dark image from both the reference image and the sample image at each wavelength.
- Normalize the sample image by the reference image at each wavelength λ. Treat the normalized image as the diffuse reflectance image R.
- Calculate the absorbance (or optical density) image A by taking the logarithm of the reciprocal of the diffuse reflectance image R at each wavelength λ:
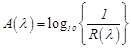 (1)
(1) - Generate a three-dimensional matrix by stacking the absorbance images in the order of their wavelengths, where the x-y plane shows the structural information obtained for the brain surface and the z-axis shows the spectral information.
- Perform a multiple regression analysis for the absorbance spectrum A(λ) at each x-y coordinate.
- Use the absorbance spectrum A(λ) as the dependent variable and the molar extinction coefficient spectra of oxygenated hemoglobin εHbO (λ) and deoxygenated hemoglobin εHbR (λ) as the independent variables for step 5.5 (published values for εHbO (λ) and εHbR (λ) are provided in Table 1).
- Check the two-dimensional maps (images) of the three multiple regression coefficients aHbO, aHbR, and a0.
- Generate a three-dimensional matrix by stacking the images of the multiple regression coefficients in the order aHbO, aHbR, and a0, where the x-y plane shows the structural information obtained for the brain surface and the z-axis shows the multiple regression coefficients.
- Calculate the oxygenated hemoglobin concentration CHbO, the deoxygenated hemoglobin concentration CHbR, and the scattering power b from the set of multiple regression coefficients aHbO, aHbR, and a0 at each x-y coordinate using the following empirical formulae (he values of βHbO,i, βHbR,i, and β0,i (i = 0,1,2,3) are provided in Table 2):
 (2)
(2)
 (3)
(3)
 (4)
(4) - Check the two-dimensional maps (images) of the oxygenated hemoglobin concentration CHbO, the deoxygenated hemoglobin concentration CHbR, and the scattering power b.
- Calculate a two-dimensional map of the total hemoglobin concentration CHbT by summing CHbO and CHbR at each x-y coordinate.
- Calculate a two-dimensional map of the regional cerebral oxygen saturation rSO2 by dividing the oxygenated hemoglobin concentration CHbO by the total hemoglobin concentration CHbT at each x-y coordinate.
Access restricted. Please log in or start a trial to view this content.
Results
Representative spectral images of diffuse reflectance acquired from in vivo rat brains are shown in Figure 3. The images at 500, 520, 540, 560, 570, and 580 nm clearly visualize a dense network of blood vessels in the cerebral cortex. The deterioration of contrast between blood vessels and the surrounding tissue observed in the images at 600, 730, and 760 nm reflects the lower absorption of light by hemoglobin at longer and NIR wavelengths.
Access restricted. Please log in or start a trial to view this content.
Discussion
The most critical step in this protocol is the removal of the thinned skull region to make the cranial window; this should be performed carefully to avoid unexpected bleeding. This step is important for obtaining high-quality multispectral diffuse reflectance images with high accuracy. The use of a stereomicroscope is recommended for the surgical procedure if possible. Small pieces of gelatin sponge are useful for hemostasis.
The optical system described in this article passes a monochromatic ...
Access restricted. Please log in or start a trial to view this content.
Disclosures
The authors have nothing to disclose.
Acknowledgements
Part of this work was supported by a Grant-in-Aid for Scientific Research (C) from the Japanese Society for the Promotion of Science (25350520, 22500401, 15K06105) and the US-ARMY ITC-PAC Research and Development Project (FA5209-15-P-0175).
Access restricted. Please log in or start a trial to view this content.
Materials
| Name | Company | Catalog Number | Comments |
|---|---|---|---|
| 150-W halogen-lamp light source | Hayashi Watch Works Co., Ltd, Tokyo, Japan | LA-150SAE | |
| Light guide | Hayashi Watch Works Co., Ltd, Tokyo, Japan | LGC1-5L1000 | |
| Collecting lens | Hayashi Watch Works Co., Ltd, Tokyo, Japan | SH-F16 | |
| Interference filters l@ 500 nm | Edmund Optics Japan Ltd, Tokyo, Japan | #65088 | |
| Interference filters l@ 520 nm | Edmund Optics Japan Ltd, Tokyo, Japan | #65093 | |
| Interference filters l@ 540 nm | Edmund Optics Japan Ltd, Tokyo, Japan | #65096 | |
| Interference filters l@ 560 nm | Edmund Optics Japan Ltd, Tokyo, Japan | #67766 | |
| Interference filters l@ 570 nm | Edmund Optics Japan Ltd, Tokyo, Japan | #67767 | |
| Interference filters l@ 580 nm | Edmund Optics Japan Ltd, Tokyo, Japan | #65646 | |
| Interference filters l@ 600 nm | Edmund Optics Japan Ltd, Tokyo, Japan | #65102 | |
| Interference filters l@ 730 nm | Edmund Optics Japan Ltd, Tokyo, Japan | #65115 | |
| Interference filters l@ 760 nm | Edmund Optics Japan Ltd, Tokyo, Japan | #67777 | |
| Motorized filter wheel | Andover Corporation, NH, USA | FW-MOT-12.5 | |
| 8-bit monochromatic CCD camera | THE IMAGINGSOURCE, Germany | DMK21BU618.H | |
| Video zoom lens | Edmund Optics Japan Ltd, Tokyo, Japan | VZMTM300i | |
| Spectralon white standard with 99% diffuse reflectance | Labsphere Incorporated, North Sutton, NH, USA | SRS-99-020 |
References
- Bonhoeffer, T., Grinvald, A. Optical Imaging based on intrinsic signals: the methodology. Brain mapping; the methods. Toga, A. W., Mazziotta, J. C. , Academic Press. San Diego. 55-97 (1996).
- Mourant, J. R., et al. Mechanisms of light scattering from biological cells relevant to noninvasive optical-tissue diagnostics. Appl. Opt. 37 (16), 3586-3593 (1998).
- Abookasis, D., et al. Imaging cortical absorption, scattering, and hemodynamic response during ischemic stroke using spatially modulated near-infrared illumination. J. Biomed. Opt. 14 (2), 024033(2009).
- Lipton, P. Ischemic cell death in brain neuron. Physiol. Rev. 79 (4), 1432-1568 (1999).
- Jarvis, C. R., Anderson, T. R., Andrew, R. D. Anoxic depolarization mediates acute damage independent of glutamate in neocortical brain slices. Cereb. Cortex. 11 (3), 249-259 (2001).
- Joshi, I., Andrew, R. D. Imaging anoxic depolarization during ischemia-like conditions in the mouse hemi-brain slice. J. Neurophysiol. 85 (1), 414-424 (2001).
- Polischuk, T. M., Jarvis, C. R., Andrew, R. D. Intrinsic optical signaling denoting neuronal damage in response to acute excitotoxic insult in the hippocampal slice. Neurobiol. Dis. 4 (6), 423-437 (1998).
- Jarvis, C. R., Lilge, L., Vipond, G. J., Andrew, R. D. Interpretation of intrinsic optical signals and calcein fluorescence during acute excitotoxic insult in the hippocampal slice. NeuroImage. 10 (4), 357-372 (1999).
- Obeidat, A. S., Jarvis, C. R., Andrew, R. D. Glutamate does not mediate acute neuronal damage after spreading depression induced by O2/glucose deprivation in the hippocampal slice. J. Cereb. Blood Flow Metab. 20 (2), 412-422 (2000).
- Dunn, A. K., Devor, A., Dale, A. M., Boas, D. A. Spatial extent of oxygen metabolism and hemodynamic changes during functional activation of the rat somatosensory cortex. Neuroimage. 27 (2), 279-290 (2005).
- Jones, M., Berwick, J., Johnston, D., Mayhew, J. Concurrent optical imaging spectroscopy and laser-Doppler flowmetry: the relationship between blood flow, oxygenation, and volume in rodent barrel cortex. Neuroimage. 13 (6), 1002-1015 (2001).
- Jones, M., Berwick, J., Mayhew, J. Changes in blood flow, oxygenation, and volume following extended stimulation of rodent barrel cortex. Neuroimage. 15 (3), 474-487 (2002).
- Zhou, C., et al. Diffuse optical correlation tomography of cerebral blood flow during cortical spreading depression in rat brain. Opt. Express. 14 (3), 1125-1144 (2006).
- Bouchard, M. B., Chen, B. R., Burgess, S. A., Hillman, E. M. C. Ultra-fast multispectral optical imaging of cortical oxygenation, blood flow, and intracellular calcium dynamics. Opt. Express. 17 (18), 15670-15678 (2009).
- Jones, P. B., et al. Simultaneous multispectral reflectance imaging and laser speckle flowmetry of cerebral blood flow and oxygen metabolism in focal cerebral ischemia. J. Biomed. Opt. 13 (4), 044007(2008).
- Kawauchi, S., et al. Diffuse light reflectance signals as potential indicators of loss of viability in brain tissue due to hypoxia: charge-coupled-device-based imaging and fiber-based measurement. J. Biomed. Opt. 18 (1), 015003(2013).
- Yoshida, K., et al. Multispectral imaging of absorption and scattering properties of in vivo exposed rat brain using a digital red-green-blue camera. J. Biomed. Opt. 20 (5), 051026(2015).
- Nishidate, I., et al. Evaluation of Cerebral Hemodynamics and Tissue Morphology of In Vivo Rat Brain Using Spectral Diffuse Reflectance Imaging. Appl. Spectrosc. , (2016).
- Wang, L. -H., Jacques, S. L., Zheng, L. -Q. MCML-Monte Carlo modeling of photon transport in multi-layered tissues. Comput. Methods Programs Biomed. 47 (2), 131-146 (1995).
- Tsytsarev, V., Premachandra, K., Takeshita, D., Bahar, S. Imaging cortical electrical stimulation in vivo: Fast intrinsic optical signal versus voltage-sensitive dyes. Opt. Lett. 33 (9), 1032-1034 (2008).
- Arnold, T., Biasio, M. D., Leitner, R. Hyper-spectral video endoscope for intra-surgery tissue classification using auto-fluorescence and reflectance spectroscopy. Proc. SPIE. 8087, 808711(2011).
- Basiri, A., et al. Use of a multi-spectral camera in the characterization of skin wounds. Opt. Express. 18 (4), 3244-3257 (2010).
- Nishidate, I., Maeda, T., Niizeki, K., Aizu, Y. Estimation of melanin and hemoglobin using spectral reflectance images reconstructed from a digital RGB image by the Wiener estimation method. Sensors. 13 (6), 7902-7915 (2013).
Access restricted. Please log in or start a trial to view this content.
Reprints and Permissions
