This article describes how the ion selectivity of channelrhodopsin is determined with electrophysiological whole-cell patch-clamp recordings using HEK293 cells. Here, the experimental procedure for investigating chloride selectivity of an anion-selective channelrhodopsin is demonstrated. However, the procedure is transferable to other channelrhodopsins of distinct selectivity.
Method Article
Whole-cell Patch-clamp Recordings for Electrophysiological Determination of Ion Selectivity in Channelrhodopsins
* These authors contributed equally
In This Article
Summary
Abstract
Over the past decade, channelrhodopsins became indispensable in neuroscientific research where they are used as tools to non-invasively manipulate electrical processes in target cells. In this context, ion selectivity of a channelrhodopsin is of particular importance. This article describes the investigation of chloride selectivity for a recently identified anion-conducting channelrhodopsin of Proteomonas sulcata via electrophysiological patch-clamp recordings on HEK293 cells. The experimental procedure for measuring light-gated photocurrents demands a fast switchable – ideally monochromatic – light source coupled into the microscope of an otherwise conventional patch-clamp setup. Preparative procedures prior to the experiment are outlined involving preparation of buffered solutions, considerations on liquid junction potentials, seeding and transfection of cells, and pulling of patch pipettes. The actual recording of current-voltage relations to determine the reversal potentials for different chloride concentrations takes place 24 h to 48 h after transfection. Finally, electrophysiological data are analyzed with respect to theoretical considerations of chloride conduction.
Introduction
Channelrhodopsins (ChR) are light-gated ion channels that occur in the eye spot of motile green algae, and serve as primary photosensors for phototaxis and phobic responses1. Since their first description in 20022, ChRs have paved the way for the emerging field of optogenetics and can be applied in a variety of excitable cells e.g. within skeletal muscles, the heart, or the brain3,4,5. Expression of ChRs in target cells results in light-controllable ion permeability of the respective cell. In a neuronal context, this allows activation6,7,8 or inhibition9,10 of action potential (AP) firing – depending on the conducted ion – with the spatial and temporal precision of light emphasizing how the ion selectivity of a ChR variant determines its optogenetic application.
The first discovered ChRs from Chlamydomonas reinhardtii and Volvox carteri are permeable to protons, but also to monovalent cations like sodium, potassium, and to a lesser extent to divalent cations such as calcium and magnesium11,12,13. Today, more than 70 natural cation-conducting channelrhodopsins (CCRs)14,15,16,17 and several engineered variants18,19,20 with different properties such as photocurrent size, spectral sensitivity, kinetics, and cation selectivity are available. Whereas in neuroscience, CCRs are used to activate cells and trigger APs, light-driven microbial pumps were the only available antagonists for silencing neurons for years. In 2014, two groups simultaneously showed that CCRs can be converted into anion-conducting channelrhodopsins (ACRs) by alteration of the polarity along the putative ion conducting pore via molecular engineering9,21. Subsequently, natural ACRs were identified in several cryptophyte alga22,23,24. Most importantly, light activation of ACRs mediates chloride currents in adult neurons allowing inhibition of neuronal activity at much lower light intensities than microbial pumps that only transport single charges per absorbed photon.
ChR activity can be directly addressed by electrophysiological patch-clamp recordings of light-induced currents in HEK293 cells. The patch-clamp technique was originally developed in the late 1970s25 and further improved by Hamill et al., allowing the recording of the entity of currents from a small cell (whole cell mode) with high current resolution and direct control of the membrane voltage26. Applied in cell culture, this technique provides accurate control of the ionic as well as electrical recording conditions, and enables studying ion selectivity along with the relative contribution of the ions to the total current. Here we exemplify the examination of ion selectivity for the anion-conducting channelrhodopsin of Proteomonas sulcata (PsACR1)22,23 via the recording of current-voltage relations under various extracellular chloride concentrations to prove high chloride conductance.
Protocol
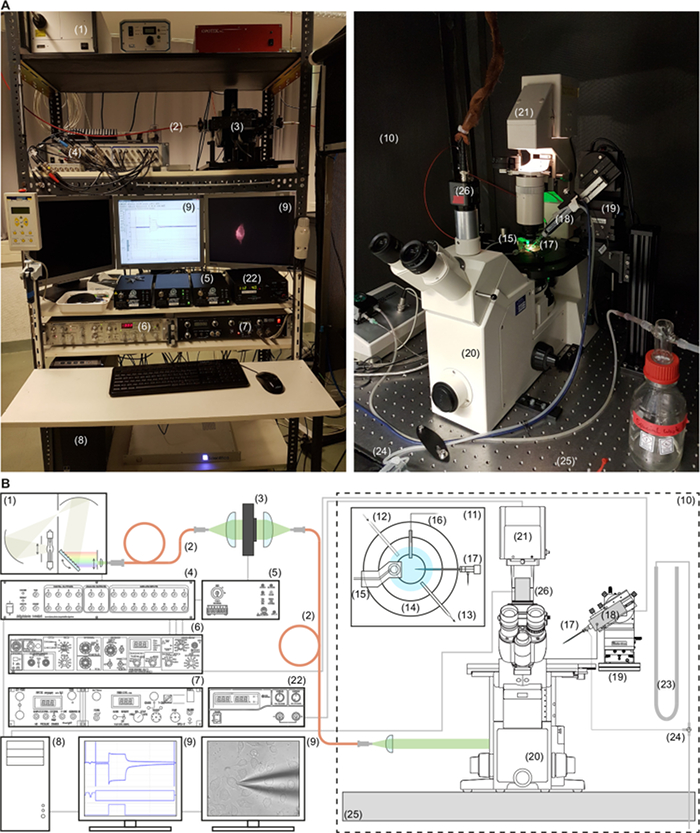
Figure 1: Patch-clamp Setup. (1) Light source, (2) optic fiber, (3) programmable shutter, (4) digitizer, (5) shutter driver, (6) amplifier, (7) perfusion system, (8) personal computer, (9) monitor, (10) faraday cage, (11) microscope stage, (12) perfusion inlet, (13) perfusion outlet, (14) recording chamber, (15) fluid level sensor, (16) bath electrode with agar bridge, (17) pipette holder, (18) headstage, (19) micromanipulator, (20) inverted microscope, (21) microscope lamp housing, (22) microscope lamp power supply, (23) water-filled U-tube , (24) three-way valve, (25) anti-vibration table, (26) CCD camera. (A) Photographs and (B) schematic representation of the setup. Please click here to view a larger version of this figure.
1. Setup Prior to Recordings
| intra. | extra.1 | extra.2 | |
| high chloride | high chloride | low chloride | |
| c [mM] | c [mM] | c [mM] | |
| Na-ASP | 0 | 0 | 140 |
| NaCl | 110 | 140 | 0 |
| KCl | 1 | 1 | 1 |
| CsCl | 1 | 1 | 1 |
| CaCl2 | 2 | 2 | 2 |
| MgCl2 | 2 | 2 | 2 |
| HEPES | 10 | 10 | 10 |
| EGTA | 10 | 0 | 0 |
| pH | 7.2 | 7.2 | 7.2 |
| osmolarity | 290 mOsm | 320 mOsm | 320 mOsm |
Table 1: Ionic Composition of the Buffered Solutions. Composition of intracellular (intra.) and extracellular (extra.) buffers for chloride selectivity experiments in HEK cells. Abbreviations used: ethylene glycol tetraacetic acid (EGTA), 4-(2-hydroxyethyl)-1-piperazineethanesulfonic acid (HEPES) and aspartate (ASP). All concentrations are in mM.
- Prepare the recording solutions with ion concentrations as indicated in Table 1.
- Prepare 15 mL of 2 M stock solutions in ultrapure water for MgCl2, CaCl2, KCl and CsCl.
- Weigh the solid components for 100 mL of the intracellular and 500 mL of the extracellular buffered solutions according to table 1 into separate beakers and add the respective amount of the prepared stock solutions afterwards. For example, for the intracellular buffer, use 0.3803 g (10 mM) EGTA, 0.2383 g (10 mM) HEPES and 0.6428 g (110 mM) NaCl and add 100 µL of the 2 M MgCl2 and CaCl2 and 50 µL of the 2 M KCl and CsCl stock solutions.
- Add ultrapure water and carefully adjust pH using acids and bases, which do not interfere with the measurement, i.e. are not conducted by the ChR, such as citric acid and N-methyl-D-glucamine (NMG+).
- Adjust the osmolarity to 290 mOsm for the intracellular and to 320 mOsm for the extracellular solutions with glucose.
Note: Slightly hypoosmotic intracellular solutions increase success rate of patching26. - Sterile filter all solutions through 0.22-µm filters. Store solutions at 4 °C for two weeks or freeze at -20 °C for long term storage.
- Calculate liquid junction potentials and prepare recording protocols.
NOTE: Change of extracellular chloride concentration after establishing whole-cell configuration causes a significant liquid junction potential (LJP) that has to be corrected27,28. LJPs can be directly measured or calculated, here the latter option is used. In this protocol, on-line correction will be used demanding one recording protocol for each external buffer. However, for a bigger set of external solutions a post correction of LJP is recommended to avoid false correction.- Open the junction potential calculator (JPC)27 and open the 'New Experiment' dialogue. Then select "Patch-clamp measurements". Select "whole-cell measurements", "Standard salt-solution electrode" and enter a temperature of 25 °C. Between each step, go forward by accepting the selection by pressing the "next" button.
NOTE: Experiments are performed at a room temperature of 25 °C in an air-conditioned laboratory. Ensure that buffer solutions have room temperature before starting experiments. To vary the sample temperature an incubation stage or chamber can be used. Bath temperature can be frequently measured with a thermometer. - Add all individual anion and cation concentrations of the pipetted solution and the high chloride buffer according to the concentrations listed in Table 1.
NOTE: The JPC will calculate a LJP of -0.5 mV for the starting conditions. - Click "New Bath Solution" to enter the anionic and cationic composition of the low chloride buffer.
NOTE: The JPC will now calculate a new LJP of +12.6 mV according to the changed extracellular recording solution. - Prepare two LJP-corrected protocols for the two measuring conditions by subtracting the calculated LJP from the applied holding potential; -0.5 mV for the high and +12.6 mV for the low chloride external solutions. Thus the protocols start with -79.5 mV (high chloride) and -92.6 mV (low chloride), respectively to obtain an LJP-corrected starting holding potential of -80 mV in both cases.
NOTE: The following steps apply to the data acquisition software mentioned in the material list. - Open the protocol editor in the acquisition software. Switch to the "Mode" menu select "Episodic stimulation" and include 7 sweeps.
- Switch to the "Waveform" menu in the editor and include a 200 ms period with 0 mV holding potential followed by a 2 s period with varying holding potential starting at -79.5 mV for high chloride. Include a "Delta level" of 20 mV for the second period to increase the holding potential by 20 mV in each sweep.
- Within the voltage steps of the waveform editor apply a 500 ms period of illumination with 540 nm light (3.10 mW/mm²). To do so, change the "digital bit pattern" of the connected shutter that controls the light source to be active 500 ms after the second period described above (see 1.2.6).
NOTE: The light intensity can influence biophysical properties of channel currents like amplitude or inactivation. Therefore, light power densities should always be reported. To measure the light power after passing through all optics and the coverslip, use a calibrated optometer. To calculate the power density, determine the illuminated field of the objective by an object micrometer and divide the measured light power by the determined illuminated field. - Save the protocol for the high chloride extracellular solution. Modify the protocol and replace the first level holding potential by -92.6 mV (low external chloride). Save this second protocol to measure the low chloride extracellular condition.
- Open the junction potential calculator (JPC)27 and open the 'New Experiment' dialogue. Then select "Patch-clamp measurements". Select "whole-cell measurements", "Standard salt-solution electrode" and enter a temperature of 25 °C. Between each step, go forward by accepting the selection by pressing the "next" button.
- Lysine-coating of glass cover slips as per adapted protocol29.
- Place several 100 cover slips in a glass petri dish and add 250 mL HCl (1 N).
- Place the petri dish with the cover slips on a linear shaker and shake at 120 rpm for 72 h to clean the cover slips and afterwards rinse with ultrapure water to neutralize pH.
- Soak these in a small volume of 95% ethanol for further cleaning.
NOTE: Clean cover slips can be stored in 70% ethanol before proceeding. Work under laminar flow hood for the following steps. - Using a Bunsen burner and tweezers, flame each cover slip and transfer it into a new petri dish.
- Incubate the glass cover slips with a sterile 50 µg/mL poly-D-lysine solution for at least 1 h (or overnight) at room temperature while shaking with a linear shaker at 150 rpm.
- Wash the cover slips with ultrapure water to remove excess poly-D-lysine.
- Spread the cover slips on sterile paper to dry for 10 min, and expose them to UV light for sterilization (at least 20 min).
- Collect the cover slips into a sterile petri dish covered in aluminum foil until use.
- Prepare DNA of the PsACR1 gene fused to mCherry using standard molecular biology techniques.
- Clone the human codon-optimized gene sequence encoding PsACR1 into a peGFP-C1 plasmid (CMV promotor, kanamycin resistance) in frame with the mCherry fluorophore using restriction enzymes or other established cloning methods.
Note: Other fluorophores can be used as well, but make sure to have the corresponding filter-sets available to observe their fluorescence under the microscope in the setup. - Transform the plasmid DNA into chemocompetent XL1Blue E. coli cells via heat shock as per standard protocol and plate them on agar plates (30 µg/mL kanamycin)30. Grow the plated bacteria over night at 37 °C.
- The next day, inoculate 4 mL lysogeny broth medium supplemented with 30 µg/mL kanamycin with cells from single colonies and incubate them over night at 37 °C and 180 rpm in an incubator.
- After overnight incubation, purify the plasmid DNA from the cultures using a commercially available kit (see Materials Table) according to the instructions of the manufacturer.
- Clone the human codon-optimized gene sequence encoding PsACR1 into a peGFP-C1 plasmid (CMV promotor, kanamycin resistance) in frame with the mCherry fluorophore using restriction enzymes or other established cloning methods.
- Seed the cells
NOTE: Perform steps under a laminar flow hood.- Place up to three lysine-coated glass cover slips side by side in a 35-mm petri dish.
NOTE: Gently press them against the bottom of the dish to prevent slipping onto each other. - Seed 1.5 x 10⁵ HEK cells in 2 mL standard Dulbecco's Modified Eagle Medium (DMEM) supplemented with 10 % fetal bovine serum (FBS) in each dish.
- Supplement all-trans retinal at a final concentration of 1 µM. Grow the cells for at least one day before proceeding with step 1.6.
- Place up to three lysine-coated glass cover slips side by side in a 35-mm petri dish.
- Transiently transfect the cells via lipofection31.
- For each dish of cells, prepare a solution of 2 µg of plasmid DNA (as prepared in step 1.4) in 250 µL DMEM without FBS and 6 µL transfection reagent (see Materials Table).
- After 15 min of incubation, gently (dropwise) add the solution to the cells.
- Prepare agar bridges
- Add 0.75 g agarose to 50 mL sterile sodium chloride solution (140 mM) and dissolve it by heating in a microwave.
NOTE: 2 - 3 M KCl for agar bridge preparation further reduces LJP due to higher concentration (e.g. constant diffusion from the bridge) and equal mobility of K+ and Cl- ions, but was avoided to minimize ion-(especially Cl-) leakage into the bath solution32. - Fill 10 µL pipette tips (or a small diameter hose) with the liquid agarose solution using a syringe.
NOTE: Avoid air bubbles in the bridge. - After the agar bridges have been cooled and solidified, store them in sterile 140 mM sodium chloride solution.
- Add 0.75 g agarose to 50 mL sterile sodium chloride solution (140 mM) and dissolve it by heating in a microwave.
- Prepare recording and bath electrodes.
- Remove silver wires of the bath and recording electrode of the patch-clamp setup.
- Polish the wires with sandpaper to remove silver chloride from previous experiments. Immerse the clean silver wire in 3 M KCl and connect it to the positive pole of a 1.5 V battery for electrolytic coating with silver chloride.
NOTE: A lab power supply can be used instead of a battery.
- Pull low resistance patch pipettes (1.5-3.0 MΩ) from glass capillaries with a micropipette puller and fire polish them as described by Brown et al33. Store pipettes dust-free for the day of measurement.
- Turn on all setup components to heat up to working temperature 30 min prior recordings. Ensure that buffers are at room temperature.
2. Selectivity Measurements
- Start the recordings 24 to 48 h after transient transfection of the cells described in 1.6.
- Place one cover slip in the measuring chamber and seal it with silicon to prevent leakage of the external buffer. Store the petri dish with the other cover slips in an incubator for the next set of experiments.
- Carefully fill the chamber with extracellular buffer (high [Cl-]) to prevent detaching of cells, then place it under the microscope and use the 40X objective for cell visualization.
- Put an agar bridge over the bath electrode and place it into the chamber together with the fluid level sensor and the perfusion outlet of the bath handler.
- Exchange the extracellular solution twice with 1 mL of fresh external solution (high [Cl-]) to remove residual culture medium and detached cells.
- Bring the cells into focus and search for a transfected (fluorescent) cell, which needs to be isolated from other cells. Use a triple-band filter-set and orange light (590 nm; bandwidth 15 nm; 100% intensity) to excite and visualize mCherry.
NOTE: HEK cells can be electrically coupled to their neighbors by gap junctions34 resulting in low membrane resistance in the whole-cell configuration. - Fill one of the pulled pipettes with intracellular solution and remove air bubbles by flipping the pipette several times.
- Mount the pipette on the pipette holder and apply some positive pressure to prevent clogging of the tip.
- Locate the tip of the patch pipette under the microscope and navigate it close to the cell using the micromanipulator.
NOTE: The following steps apply to the amplifier, data acquisition and evaluation software mentioned in the material list. - Start the "membrane test" in the data acquisition software and apply a voltage step (test pulse; e.g. 5 mV for 10 ms, baseline at 0 mV), manually or automatically via specified software using "bath mode" while running "membrane test" in the data acquisition software.
- Check that the pipette resistance is in the desired range (1.5-3.0 MΩ).
- Zero offset currents by adjusting the pipette potential by turning the pipette offset knob at the amplifier while working in "bath mode" of the "membrane test".
- Establish a patch in the whole-cell configuration26.
NOTE: The following steps require application of positive and negative pressure delivered to the side port of the used pipette holder. This can be done by using either a syringe, via a mouth piece or an electronically controlled pressure regulator. In this protocol positive and negative pressure is applied via a mouth piece.- Slowly approach the cell with the patch pipette from the top and relieve the positive pressure right before touching it.
NOTE: When the tip is close to the cell, the resistance will rise slightly; this is indicated by a reduced size of the test pulse. - Change the "membrane test" from "bath mode" to "patch mode" thus the holding potential to the cells' expected resting potential (-30 to -40 mV).
- In some cases the cell-attached configuration forms itself after release of the positive pressure (2.13.1), if not, gently apply negative pressure to assist gigaseal formation.
NOTE: Cell-attached configuration is established when the test pulse is reduced to two small capacitive peaks at the beginning and end of the pulse and the membrane resistance is in the GΩ range; negative voltages up to -60 mV might facilitate gigaseal formation. - Compensate the pipette capacitance by turning the "pipette capacitance compensation" knobs to get a flat response of the test pulse.
- Rupture the patch without destroying the seal by applying short pulses of negative pressure or negative pressure with increasing strength, to obtain whole-cell conformation.
NOTE: Successful transition from cell-attached to whole-cell configuration is indicated by an increase of the capacitive peaks. - Apply series resistance compensation by setting whole-cell parameter and compensation adjustments of the used amplifier for accurate clamping of the membrane potential to the desired holding voltage.
- Switch the "membrane test" to "whole-cell" mode, in the "Series resistance compensation" panel turn on "prediction" and "correction" up to 90% avoiding overshots and oscillation of the capacitive response, turn the whole-cell compensation switch on and adjust whole cell parameters with the appropriate front-panel knobs ("whole-cell capacity" and "series resistance") of the amplifier in an iterative way to obtain an ideally flat test seal response.
NOTE: For detailed description of series resistance compensation and correction refer to the amplifier manual or guideline as this procedure varies among different manufactures.
- Switch the "membrane test" to "whole-cell" mode, in the "Series resistance compensation" panel turn on "prediction" and "correction" up to 90% avoiding overshots and oscillation of the capacitive response, turn the whole-cell compensation switch on and adjust whole cell parameters with the appropriate front-panel knobs ("whole-cell capacity" and "series resistance") of the amplifier in an iterative way to obtain an ideally flat test seal response.
- After establishing whole-cell configuration, wait at least 2 min before recording to ensure sufficient replacement of intracellular solution through the patch pipette35.
- Slowly approach the cell with the patch pipette from the top and relieve the positive pressure right before touching it.
- Record light-induced currents at different holding potentials by using the protocols that were setup previously (in 1.2).
- Exchange the extracellular buffer to low [Cl-] in the chamber at least five times without destroying the patch and record another current-voltage relation (cf. step 1.2) at the new chloride concentration.
NOTE: A perfusion system for automated buffer exchange facilitates this process, but is not necessary. - Repeat 2.15. for every ionic condition to be tested, but repeatedly check the quality of the patch between the measurements by a "membrane test" described above.
NOTE: To guaranty accurate membrane voltage and stable intracellular ion composition membrane resistance should be above 500 MΩ whereas access resistance should not surpass 10 MΩ, see. 2.12.6). Do not forget to switch the whole-cell parameter compensation off for the membrane test. - Repeat 2.2. to 2.15. for several cells, but take a new cover slip for each test series to ensure healthiness of cells.
3. Data Evaluation
- Adjust the baseline of each current trace by subtracting the mean current before illumination.
- Calculate the mean stationary photocurrent Is (Figure 2A) by averaging the current over the last 40 ms of illumination.
NOTE: Analyze peak photocurrents or vary the length of averaging to determine the stationary photocurrent depending on the protocol or scientific question. - Repeat steps 3.1) and 3.2) for all tested conditions and different cells.
- Plot the determined photocurrents versus the respective holding potential.
NOTE: If multiple measurements are averaged, individual recordings can be normalized to a specified condition or the capacitance of the cell. - The intersection of the current-voltage relation with the voltage axis represents the reversal potential (net current is zero). Determine it by linear interpolation between the two neighboring data points.
NOTE: If there is no polarity inversion of photocurrents, extrapolate linearly from the last two points close to zero to obtain an approximation of the point of intersection. - Average the determined reversal potentials for the same conditions and plot them against the chloride concentration of the external buffer solutions (cf. Figure 2B).
Results
Figure 2 shows representative results obtained from measurements following the described protocol. During illumination with green light, PsACR1 features a fast transient current which rapidly decays to a stationary current level. After light is switched off, photocurrents decay to zero within milliseconds (Figure 2A). Exchanging the extracellular chloride concentration causes a shift of the reversal potential that can be directly seen in the acquired photocurrent traces. Evaluation of reversal potentials from multiple measurements quantifies the dramatic reversal potential shift caused by the variation of the external chloride concentration (Figure 2B). Strikingly, measured reversal potentials directly correspond to calculated Nernst potentials for chloride (Figure 2C) confirming the high chloride selectivity of PsACR1.
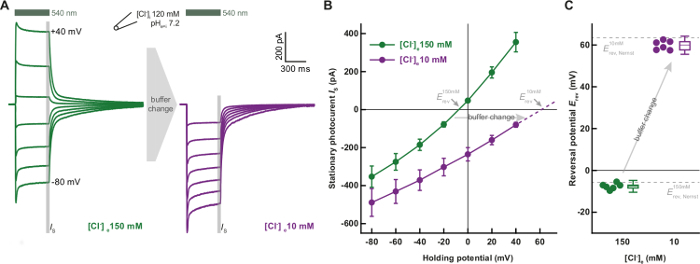
Figure 2: Chloride selectivity of PsACR1. (A) Representative current traces of PsACR1 in HEK293 cells. Intracellular chloride concentration was kept at 120 mM, whereas extracellular concentration varied from 150 mM (green) to 10 mM (purple) chloride by partial replacement of NaCl with Na-aspartate. Holding potential was increased in 20 mV steps from -80 mV to +40 mV (LJP corrected). (B) Averaged current-voltage relations (n = 6 corresponding to the conditions in A). (C) Reversal potentials (center lines indicate medians, box limits indicate the 25th and 75th percentiles, whiskers extend 2-times the standard deviation and circles indicate single data points) extracted from the current-voltage relations. For the high chloride condition (green) the value was linearly interpolated between -20 mV and 0 mV holding potential, whereas the value was linearly extrapolated above +40 mV (purple, dashed line, panel B). Please click here to view a larger version of this figure.
Discussion
Determination of reversal potentials at defined ionic and electrical conditions provides information about the ion species transported after light activation of ChRs. If exclusively one ion species is varied in a complex physiological medium and the obtained reversal potential shifts according to the theoretical Nernst potential, this ion species is the only transported one.
However, for ChRs, reversal potential shifts are usually less pronounced than expected from the Nernst equation due to permeability to different ionic species as well as competition among conducted ions. In this case, the situation becomes more complex and all potentially conducted ions must be exchanged separately demanding a variety of measuring solutions. In addition, most CCRs and the first artificial ACRs9,10,21 are conductive for protons but varying proton concentration requires an especially thorough analysis, since proton concentration may not only shift reversal potentials, but can also influence ion conductance9, photocurrents kinetics21,36 and spectral light sensitivity11,37 due to alteration of the hydrogen bonding networks, the protonation state of individual residues and secondary structure changes. Proton conductance can be addressed by reducing concentrations of all other potentially conducted ions such as Na+, Ca2+ or Cl- while keeping the pH constant in order to avoid protein changes mentioned above. Non-conducted substitutes are usually bulky, charged molecules like NMG+ for cations12, and gluconate, 2-(N-morpholino) ethanesulfonate (MES-) or aspartate for anions. Comparing reversal potentials in different ionic solutions then allows the calculation of the relative ion permeabilities at equilibrium conditions by the Goldman-Hodgkin-Katz voltage equation. Quantifying the exact contribution of different ions to net photocurrents considering ion competition beyond equilibrium conditions however, demands complex mathematical models12,38.
Knowing the composition of ions transported by ChRs helps to elucidate possible side effects resulting from ChR application especially in a neurophysiological context. For instance, prolonged ChR activation can cause intracellular acidification39 or conducted-Ca2+ may trigger synaptic release and second messenger pathways40. As cells are usually tightly packed within tissues, activation of microbial rhodopsins can not only influence the intracellular ion composition but also the extracellular lumen, thus affecting neighboring cells41.
Despite ion selectivity, other biophysical features of ChRs like photocurrent amplitudes, inactivation, spectral or light sensitivity and kinetic properties are often of interest to conduct, design and interpret experiments involving optogenetic techniques. Some of these properties can also be determined from the protocol above as described elsewhere18,37,42. To investigate light sensitivity of the ChR expressing cell, light intensity can be varied by adjusting the power of the light source or by attenuating the activation light with neutral density filters. To obtain the spectral sensitivity, a polychromatic light source is needed and intensities have to be adjusted to equal photon flux and bandwidth for all wavelengths. High intensity spectra only resemble absorption spectra of the photoreceptor if short light pulses or laser flashes are used, otherwise adaptation phenomena and photochemical back reactions can occur. The recovery from partially inactivated to fully active ChR (overall photocycle turnover time) can be probed by applying a double pulse protocol with increasing dark intervals between the two light pulses. The biophysical properties of ChRs discussed above are important for choosing a suitable ChR matching the experimental needs40.
Deriving these biophysical properties by electrophysiological techniques directly resembles protein function which is barely covered by spectroscopic methods. After successful establishment of voltage-clamp measurements, the technique can be combined with protein engineering approaches like site-directed mutagenesis9,11,43,44, helix-shuffling37,45, introduction of targeting sequences46 or fusion with other proteins41,47. This has increased the molecular knowledge about ChRs and their mode of operation and created a high diversity of ChR variants with altered kinetics, conductance, spectral sensitivity and ion selectivity40.
Disclosures
The authors have nothing to disclose.
Acknowledgements
We thank Maila Reh, Tharsana Tharmalingam and especially Altina Klein for excellent technical assistance. This work was supported by the German Research Foundation (DFG) (SFB1078 B2, FOR1279 SPP1665 to P. H.) and the Cluster of Excellence Unifying Concepts in Catalysis, UniCat, BIG-NSE (J.V.) and E4 (P.H.).
Materials
| Name | Company | Catalog Number | Comments |
|---|---|---|---|
| HEK293 cells | Sigma Aldrich | 85120602 | Human embryonic kidney cells |
| Retinal | Sigma Aldrich | R2500 | all-trans retinal |
| FuGENE HD | Promega | E2312 | Transfection reagent |
| DMEM | Biochrome | FG 0445 | Dulbecco's Modified Eagle Medium |
| Agarose | Roth | 3810 | Agar bridges |
| CaCl2 | Roth | 5239 | CaCl2 2H2O |
| CsCl | Biomol | 2452 | |
| EGTA | Roth | 3054 | |
| FBS | Biochrome | S0615 | Cell culture |
| Glucose | Roth | HN06 | D(+)-Glucose |
| KCl | Roth | 6781 | |
| MgCl2 | Roth | 2189 | MgCl2 6H2O |
| NaCl | Roth | 3957 | |
| NMG | Sigma Aldrich | M2004 | N-Methyl-D-glucamine |
| Na-Aspartate | Sigma Aldrich | A6683 | L-Aspartic acid sodium salt monohydrate |
| Citric acid | Roth | 6490 | |
| AgeI | ThermoFischerScientific | ER1462 | Restriction enzyme |
| XhoI | ThermoFischerScientific | ER0695 | Restriction enzyme |
| NheI | ThermoFischerScientific | ER0975 | Restriction enzyme |
| XL1Blue E. coli | Agilent Technologies | 200249 | Chemocompetent E. coli |
| Kanamycin | Roth | T832 | |
| Lysogeny broth medium | Roth | X964 | |
| Agar-Agar | Roth | 6494 | Agar plates |
| Plasmid purification kit | Marchery-Nagel | 740727.25 | |
| Penicilin/Streptomycin | Biochrome | A 2213 | Cell culture |
| Poly-D-lysine hydrobromide | Sigma Aldrich | P6407-5MG | Cover slip coating |
| Microforge | Custom made | Fire polishing | |
| Serological pipettes | TPP | Different sizes | |
| Clean bench | Kojair | Biowizard SL130 | |
| Stirrer | IKA | RCT classic | |
| Silver wire | Science Products | AG-T25; AG-T10 | Electrodes, 0.64 mm (bath); 0.25 mm (electrode) |
| pH-meter | Knick | 765 Calimetric | |
| Osmometer | Vogel | OM 815 | |
| Microscope | Carl Zeiss | ID03 | Fire polishing |
| CO2 incubator | Binder | CB150 | |
| Cell culture dishes | TPP | 93040 | 34 mm internal diameter |
| Cover slips | Roth | P232 | 15 mm diameter |
| Thermometer | Rössel Messtechnik | MTM12 | |
| Beamsplitter | Chroma | 21011 | 90/10 transmission |
| Pipette holder | ALA Scientific Instruments | PPH-1P-AXU-0-1.5 | |
| Headstage | Molecular Devices | CV203BU | |
| Amplifier | Molecular Devices | AxoPatch200B | |
| Digitizer | Molecular Devices | DigiData1400 | Digital analog converter |
| Lightsource | TILL Photonics | Polychrome V | Set to 540 nm full intensity |
| Microscope | Carl Zeiss | Axiovert 100 | |
| Shutter | Vincent Associates | VS25 | |
| Shutter driver | Vincent Associates | VCM-D1 | |
| Glass capilarries | Warner Instruments | G150F-3 | Boresilicate capillaries with fire polished ends OD 1.5 mm ID 0.86 mm |
| Micropipette puller | Sutter Instruments | P1000 | |
| Bath handler | Lorenz Messgerätebau | MPCU | |
| Tripleband filterset | Chroma | 69008 | Fluorescence filter ECFP/EYFP/mCherry |
| CCD camera | Watec | Wat-221SCCD | |
| Optometer | Gigahertz Optik | P9710 | Measure light intensities |
| Objective | Carl Zeiss | 421462-9900-000 | W Plan-Apochromat 40X/1.0 DIC |
| Micromanipulator | Scientifica | PatchStar | |
| Recording chamber | Custom made | ||
| Power supply | Manson | HCS-3202 | Avoids electrical noise from microscope built-in power supply |
| Vibration isolated table | Newport | M-VW-3636-OPT-01 | |
| Faraday cage | Custom made or any commercial matching table | ||
| Hoses | Any comercial; e.g. Roth | Different sizes and materials for bath handling and application of pipette pressure; agar bridges | |
| Linear shaker | Sunlab Instruments | SU 1000 | |
| Liquid junction potential calculator | Molecular Devices or directly from Peter H. Barry | Program is included in the Clampex aquisition software or can be obtained from p.barry@unsw.edu.au | |
| Data acquisition software | Molecular Devices | Clampex 10.X | |
| Data evaluation software | Molecular Devices | Clampfit 10.X | |
| PsACR1 | GenBank or Addgene | KF992074.1 or Addgene plasmid #85465 | Gene encoding for PsACR1 |
| Amplifier guide | Molecular Devices | The Axon Guide |
References
- Hegemann, P. Algal sensory photoreceptors. Annu. Rev. Plant Biol. 59, 167-189 (2008).
- Nagel, G., et al. Channelrhodopsin-1: a light-gated proton channel in green algae. Science. 296 (5577), 2395-2398 (2002).
- Bruegmann, T., et al. Optogenetic control of contractile function in skeletal muscle. Nat. Commun. 6 (7153), 1-8 (2015).
- Bruegmann, T., et al. Optogenetic control of heart muscle in vitro and in vivo. Nat. Methods. 7 (11), 897-900 (2010).
- Zhang, F., et al. The microbial opsin family of optogenetic tools. Cell. 147 (7), 1446-1457 (2011).
- Nagel, G., et al. Light activation of channelrhodopsin-2 in excitable cells of Caenorhabditis elegans triggers rapid behavioral responses. Curr. Biol. 15 (24), 2279-2284 (2005).
- Li, X., et al. Fast noninvasive activation and inhibition of neural and network activity by vertebrate rhodopsin and green algae channelrhodopsin. Proc. Natl. Acad. Sci. U. S. A. 102 (49), 17816-17821 (2005).
- Ishizuka, T., Kakuda, M., Araki, R., Yawo, H. Kinetic evaluation of photosensitivity in genetically engineered neurons expressing green algae light-gated channels. Neurosci. Res. 54 (2), 85-94 (2006).
- Wietek, J., et al. Conversion of channelrhodopsin into a light-gated chloride channel. Science. 344 (6182), 409-412 (2014).
- Berndt, A., et al. Structural foundations of optogenetics: Determinants of channelrhodopsin ion selectivity. Proc. Natl. Acad. Sci. U. S. A. 113 (4), 822-829 (2016).
- Tsunoda, S. P., Hegemann, P. Glu 87 of Channelrhodopsin-1 Causes pH-dependent Color Tuning and Fast Photocurrent Inactivation. Photochem. Photobiol. 85 (2), 564-569 (2009).
- Schneider, F., Gradmann, D., Hegemann, P. Ion selectivity and competition in channelrhodopsins. Biophys. J. 105 (1), 91-100 (2013).
- Prigge, M. Über die elektrophysiologische Untersuchung und Entwicklung von farbverschobenen Kanalrhodopsinchimären aus der Grünalge Volvox carteri. , Diss. Humboldt-Universität zu Berlin. Available from: http://nbn-resolving.de/urn:nbn:de:kobv:11-100203476 (2012).
- Govorunova, E. G., Spudich, E. N., Lane, C. E., Sineshchekov, O. A., Spudich, J. L. New Channelrhodopsin with a Red-Shifted Spectrum and Rapid Kinetics from Mesostigma viride. MBio. 2 (3), 1-9 (2011).
- Govorunova, E. G., Sineshchekov, O. A., Li, H., Janz, R., Spudich, J. L. Characterization of a highly efficient blue-shifted channelrhodopsin from the marine alga Platymonas subcordiformis. J. Biol. Chem. 288 (41), 29911-29922 (2013).
- Hou, S. -Y., et al. Diversity of Chlamydomonas Channelrhodopsins. Photochem. Photobiol. 88 (1), 119-128 (2012).
- Klapoetke, N. C., et al. Independent optical excitation of distinct neural populations. Nat. Methods. 11 (3), 338-346 (2014).
- Lin, J. Y., Lin, M. Z., Steinbach, P., Tsien, R. Y. Characterization of engineered channelrhodopsin variants with improved properties and kinetics. Biophys. J. 96 (5), 1803-1814 (2009).
- Yizhar, O., et al. Neocortical excitation/inhibition balance in information processing and social dysfunction. Nature. 477 (7363), 171-178 (2011).
- Berndt, A., Yizhar, O., Gunaydin, L. a, Hegemann, P., Deisseroth, K. Bi-stable neural state switches. Nat. Neurosci. 12 (2), 229-234 (2009).
- Berndt, A., Lee, S. Y., Ramakrishnan, C., Deisseroth, K. Structure-Guided Transformation of Channelrhodopsin into a Light-Activated Chloride Channel. Science. 344 (6182), 420-424 (2014).
- Govorunova, E. G., Sineshchekov, O. A., Spudich, J. L. Proteomonas sulcata ACR1: A Fast Anion Channelrhodopsin. Photochem. Photobiol. 92 (2), 257-263 (2016).
- Wietek, J., Broser, M., Krause, B. S., Hegemann, P. Identification of a Natural Green Light Absorbing Chloride Conducting Channelrhodopsin from Proteomonas sulcata. J. Biol. Chem. 291 (8), 4121-4127 (2016).
- Govorunova, E. G., Sineshchekov, O. A., Janz, R., Liu, X., Spudich, J. L. Natural light-gated anion channels: A family of microbial rhodopsins for advanced optogenetics. Science. 349 (6248), 647-650 (2015).
- Neher, E., Sakmann, B., Steinbach, J. H. The extracellular patch clamp: A method for resolving currents through individual open channels in biological membranes. Pflügers Arch. Eur. J. Physiol. 375 (2), 219-228 (1978).
- Hamill, O. P., Marty, A., Neher, E., Sakmann, B., Sigworth, F. J. Improved patch-clamp techniques for high-resolution current recording from cells and cell-free membrane patches. Pflügers Arch. Eur. J. Physiol. Arch. Eur. J. Physiol. 391 (2), 85-100 (1981).
- Barry, P. H. JPCalc, a software package for calculating liquid junction potential corrections in patch-clamp, intracellular, epithelial and bilayer measurements and for correcting junction potential measurements. J. Neurosci. Methods. 51 (1), 107-116 (1994).
- Amtmann, A., Sanders, D. A unified procedure for the correction of liquid junction potentials in patch clamp experiments on endo- and plasma membranes. J. Exp. Bot. 48, (Special) 361-364 (1997).
- Kaech, S., Banker, G. Culturing hippocampal neurons. Nat. Protoc. 1 (5), 2406-2415 (2006).
- Sanders, E. R. Aseptic laboratory techniques: plating methods. J. Vis. Exp. (63), e1-e18 (2012).
- Felgner, P. L., et al. Lipofection: a highly efficient, lipid-mediated DNA-transfection procedure. Proc. Natl. Acad. Sci. U. S. A. 84 (21), 7413-7417 (1987).
- Halliwell, J., Whitaker, M., Ogden, D. Using microelectrodes. Microelectrode Tech. Plymouth Work. Handb. 3, 1-15 (1949).
- Brown, A. L., Johnson, B. E., Goodman, M. B. Making patch-pipettes and sharp electrodes with a programmable puller. J. Vis. Exp. (20), e1-e2 (2008).
- Thomas, P., Smart, T. G. HEK293 cell line: A vehicle for the expression of recombinant proteins. J. Pharmacol. Toxicol. Methods. 51 (3), 187-200 (2005).
- Pusch, M., Neher, E. Rates of diffusional exchange between small cells and a measuring patch pipette. Pflügers Arch. Eur. J. Physiol. 411 (2), 204-211 (1988).
- Berndt, A. Mechanismus und anwendungsbezogene Optimierung von Channelrhodopsin-2. , Diss Humboldt-Universität zu Berlin. Available from: http://nbn-resolving.de/urn:nbn:de:kobv:11-100191266 (2011).
- Prigge, M., et al. Color-tuned channelrhodopsins for multiwavelength optogenetics. J. Biol. Chem. 287 (38), 31804-31812 (2012).
- Gradmann, D., Berndt, A., Schneider, F., Hegemann, P. Rectification of the channelrhodopsin early conductance. Biophys. J. 101 (5), 1057-1068 (2011).
- Beppu, K., et al. Optogenetic countering of glial acidosis suppresses glial glutamate release and ischemic brain damage. Neuron. 81 (2), 314-320 (2014).
- Wietek, J., Prigge, M. Enhancing Channelrhodopsins: An Overview. Methods Mol. Biol. 1408, 141-165 (2016).
- Ferenczi, E. A., et al. Optogenetic approaches addressing extracellular modulation of neural excitability. Sci. Rep. 6, 1-20 (2016).
- Zhang, F., et al. Red-shifted optogenetic excitation: a tool for fast neural control derived from Volvox carteri. Nat. Neurosci. 11 (6), 631-633 (2008).
- Sugiyama, Y., et al. Photocurrent attenuation by a single polar-to-nonpolar point mutation of channelrhodopsin-2. Photochem. Photobiol. Sci. 8 (3), 328-336 (2009).
- Kleinlogel, S., et al. Ultra light-sensitive and fast neuronal activation with the Ca2+-permeable channelrhodopsin CatCh. Nat. Neurosci. 14 (4), 513-518 (2011).
- Wang, H., et al. Molecular determinants differentiating photocurrent properties of two channelrhodopsins from chlamydomonas. J. Biol. Chem. 284 (9), 5685-5696 (2009).
- Gradinaru, V., Thompson, K. R., Deisseroth, K. eNpHR: a Natronomonas halorhodopsin enhanced for optogenetic applications. Brain Cell Biol. 36 (1-4), 129-139 (2008).
- Berglund, K., et al. Luminopsins integrate opto- and chemogenetics by using physical and biological light sources for opsin activation. Proc. Natl. Acad. Sci. 113 (3), 358-367 (2016).
Reprints and Permissions
