Fast-scan cyclic voltammetry can monitor in vivo dopamine neurotransmission in the context of drugs, disease, and other experimental manipulations. This work describes the implementation of QNsim1.0, a software to model electrically stimulated dopamine responses according to the quantitative neurobiological model to quantify estimates of dopamine release and reuptake dynamics.
A subscription to JoVE is required to view this content. Sign in or start your free trial.
Method Article
Modeling Fast-scan Cyclic Voltammetry Data from Electrically Stimulated Dopamine Neurotransmission Data Using QNsim1.0
In This Article
Summary
Abstract
Central dopaminergic (DAergic) pathways have an important role in a wide range of functions, such as attention, motivation, and movement. Dopamine (DA) is implicated in diseases and disorders including attention deficit hyperactivity disorder, Parkinson's disease, and traumatic brain injury. Thus, DA neurotransmission and the methods to study it are of intense scientific interest. In vivo fast-scan cyclic voltammetry (FSCV) is a method that allows for selectively monitoring DA concentration changes with fine temporal and spatial resolution. This technique is commonly used in conjunction with electrical stimulations of ascending DAergic pathways to control the impulse flow of dopamine neurotransmission. Although the stimulated DA neurotransmission paradigm can produce robust DA responses with clear morphologies, making them amenable for kinetic analysis, there is still much debate on how to interpret the responses in terms of their DA release and clearance components. To address this concern, a quantitative neurobiological (QN) framework of stimulated DA neurotransmission was recently developed to realistically model the dynamics of DA release and reuptake over the course of a stimulated DA response. The foundations of this model are based on experimental data from stimulated DA neurotransmission and on principles of neurotransmission adopted from various lines of research. The QN model implements 12 parameters related to stimulated DA release and reuptake dynamics to model DA responses. This work describes how to simulate DA responses using QNsim1.0 and also details principles that have been implemented to systematically discern alterations in the stimulated dopamine release and reuptake dynamics.
Introduction
Dopamine (DA) neurotransmission plays an essential role in various cognitive and behavioral functions, and its dysfunction is implicated in several common diseases and disorders. As such, it is critical to develop accurate methods of quantitatively studying DA neurotransmission in vivo to evaluate how DA neurotransmission is altered in the contexts of disease models and drug pharmacology. Fast-scan cyclic voltammetry (FSCV) allows for monitoring in vivo DA neurotransmission with fine spatial and temporal resolution. While it is possible to monitor physiological DA neurotransmission in awake, freely behaving animals, the electrical stimulation of ascending dopaminergic pathways in anesthetized animals can produce robust DA responses that are amenable to the enhanced kinetic analysis of DA neurotransmission.
Electrically stimulated DA responses reflect a dynamic interplay of DA release and reuptake, and interpretations of these responses have predominantly used a simple model of stimulated DA neurotransmission called the Michaelis-Menten (M-M) model12. The M-M model consists of 3 variables to describe DA responses in terms of a constant DA release rate and a constant reuptake efficiency (i.e., the relationship between the DA reuptake rate and extracellular DA concentrations), as described by Equation 1:

(DA release) (DA reuptake)
In Equation 1, f is the frequency of stimulation; [DA]p is the estimated DA concentration increase per pulse of stimulation; Vmax represents the estimated maximal reuptake rate; and Km is the estimated M-M constant, which is theoretically equivalent to the extracellular DA concentration that saturates 50% of DAT, leading to a half-maximal reuptake rate. This differential equation can be integrated to simulate experimental DA responses by estimating the [DA]p, Vmax, and Km parameters.
Although the M-M model has facilitated significant advances in the understanding of DA neurotransmission kinetics in various experimental contexts, the M-M model makes simplistic fundamental assumptions that limit its applicability when modeling DA responses elicited by supraphysiological stimulations2,13. For instance, the M-M model can only approximate DA response shapes if they rise in a convex manner, but it cannot account for the gradual (concave) rising responses found in dorsal striatal regions12. Thus, the M-M model assumptions do not accurately capture the dynamic release and reuptake processes of stimulated DA neurotransmission.
To model stimulated DA responses according to a realistic quantitative framework, the quantitative neurobiological (QN) framework was developed based on principles of stimulated neurotransmission kinetics derived from complementary research and experimentation2. Various lines of neurotransmission research demonstrate that (1) stimulated neurotransmitter release is a dynamic process that decreases in rate over the course of stimulation14, (2) release continues in the post-stimulation phase with biphasic decay kinetics15, and (3) DA reuptake efficiency is progressively inhibited during the duration of the stimulation itself2,16. These three concepts serve as the foundation of the QN framework, and the three equations consisting of 12 parameters describing the dynamics of DA release and reuptake (Table 1). The QN framework can closely simulate heterogeneous experimental DA response types, as well as the predicted effects of experimental manipulations of stimulation parameters and drug administration2,6. Although further research is necessary to refine the data modeling approach, future experiments can greatly benefit from this neurobiologically grounded modeling approach, which significantly adds to the inferences drawn from the stimulated DA neurotransmission paradigm.
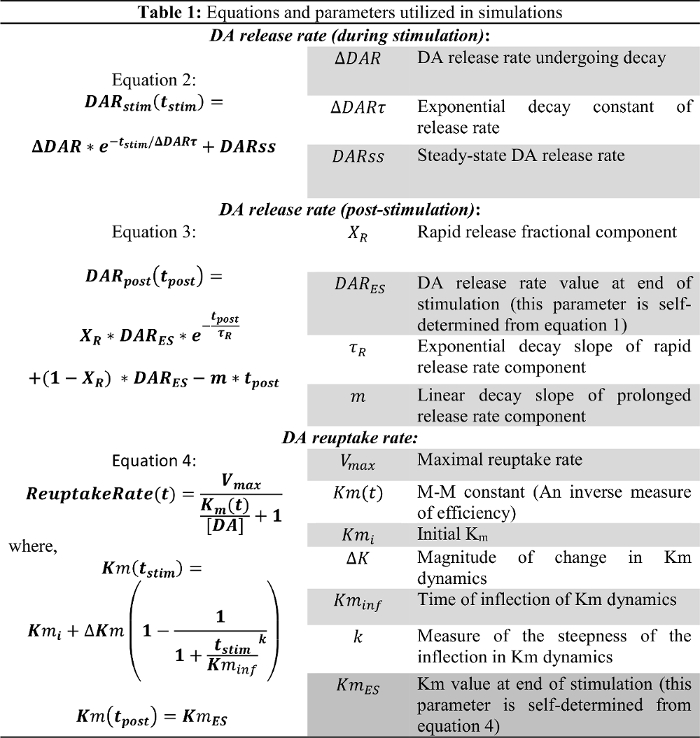
Table 1: Modeling Equations and Parameters. Please click here to view a larger version of this figure.
This tutorial describes how to model stimulated DA response data to estimate DA release and reuptake kinetics using QNsim 1.0. The actual experimental data collection and processing is not described here and only requires temporal DA concentration data. The theoretical support and foundations of the QN framework have been extensively described previously2, but a practical perspective on applying the QN framework to model DA response data is described below.
The QN framework models the dynamic interplay between: 1) dynamic DA release, 2) DA reuptake, and 3) the effects of supraphysiological stimulations on these processes to extract meaningful kinetic information from DA response data. The QN framework is best suited for modeling FSCV data acquired using highly supraphysiological stimulations of long duration (e.g., 60 Hz, 10 s stimulations), which produce robust DA responses that are amenable for kinetic analysis. Following the accurate modeling of the underlying release and reuptake processes, the model parameters can be used to simulate a DA response that should approximate the shape of the experimental DA response.
The equations of the QN framework describe the rates of DA release and reuptake over the course of the stimulated DA responses. The QN framework describes the stimulated DA release rate as a function of time from the start of stimulation (tstim), when the DA release rate exponentially decreases over the course of stimulation. This is consistent with the depletion of a readily releasable pool, with an added steady-state DA release rate (DARss) to account for vesicle replenishment, similar to other reports (Equation 2)14,17.

Manipulations that increases the DA release rate, such as increasing ΔDAR, ΔDARτ, or DARss, lead to increased response amplitudes on DA versus time plots. Each parameter contributes differentially to DA response shapes. Increasing DARss and ΔDARτ both make the rising phase of responses more linear (less convex). Decreasing ΔDARτ promotes convexity, which is controlled by the magnitude of ΔDAR. Based on modeling experience, DARss is generally less than 1/5th of ΔDAR; thus, ΔDAR is the release parameter that primarily determines the overall response amplitude of a DA response.
The post-stimulation DA release rate is modeled by Equation 3 as a continuation of the stimulated DA release rate from the end of stimulation (DARES) as a function of time after stimulation (tpost). The post-stimulation DA release rate follows a biphasic decay pattern, as previously described15, with a rapid exponential decay phase and a prolonged linear decay phase to model two calcium-dependent neurotransmitter release processes.

(Rapid exponential decay) (Prolonged linear decay)
It is not currently possible to determine how much post-stimulation DA release occurs. This limitation can be addressed by systematically minimizing estimates of post-stimulation DA release and validating model parameters across a set of experimental DA responses collected from the same recording site using varying stimulation durations. This minimization allows users to make conservative estimates of release and reuptake. Because electrical stimulations lead to the calcium accumulation that promotes post-stimulation neurotransmitter release, the duration of stimulation influences the post-stimulation neurotransmitter release parameters18,19. Based on modeling experience, it was found that as the stimulation duration increases, τR increases and XR decreases, consistent with the anticipated effects of a greater calcium accumulation20.
Equation 4 describes the DA reuptake rate as an extension of the M-M framework and incorporates a dynamic Km term, which increases during stimulation to model a progressively decreasing reuptake efficiency caused by the supraphysiological stimulations2,16. The Km after stimulation is held constant at the Km value at the end of stimulation (KmES).

where,
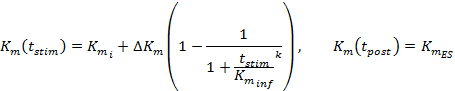
(During stimulation) (After stimulation)
Stimulated DA responses, especially from ventral striatal regions, are often insensitive to changes in the initial Km value (Kmi), which makes defining a Kmi value problematic. Thus, like the original M-M framework, Kmi is approximated at 0.1-0.4 µM for DA responses collected from control untreated animals12. The ΔKm term determines the extent of reuptake efficiency change during stimulation, which from our experience is about 20 µM over the course of a 60-Hz, 10-s stimulation. The k and Kminf values determine how Km changes over time, and increasing either of these terms promotes the concavity of the rising phase. Vmax is the maximal reuptake rate that partly relates to local DA transporter density, which exhibits a ventromedial to dorsolateral gradient21. Accordingly, Vmax values in the dorsal striatum (D-Str) are generally greater than 30 µM/s but generally less than 30 µM/s in the ventral regions, like the nucleus accumbens (NAc)6.
The general guidelines above can aid in modeling experimental DA response data, but generating a simulation that approximates the experimental DA response requires iteratively adjusting model parameters. The accuracy of the model parameters can be improved by obtaining DA responses to supraphysiological stimulations that provide a robust substrate for simulation, as well as by obtaining and modeling multiple DA responses to stimulations of varying durations at the same recording site (e.g., 60-Hz, 5-s and 10-s stimulations) to validate the accuracy of the parameters (see the sample data). To demonstrate, a dataset is included with the software package containing regiospecific stimulated DA responses collected in the nucleus accumbens and dorsal striatum, before and after a pharmacological challenge that was already modeled using the QN framework. By extension, users will find this methodology can similarly be applied to characterize the kinetics of DA neurotransmission in various disease contexts and pharmacological manipulations.
Access restricted. Please log in or start a trial to view this content.
Protocol
1. Installation, Data Preparation, and Launching QNsim1.0
- Download "QNsim1.0.zip" (provided as a supplement) and extract it to a desired directory.
- Prepare stimulated DA response data for modeling with the software program by organizing a spreadsheet in which each column contains a temporal DA response converted to µM DA concentrations. Save this (.xlsx) file to the same directory as the program files.
Note: The spreadsheet can contain multiple responses in an individual experiment or multiple studies containing a fixed number of responses (see "Sample.xlsx" for an example). - Open the programming environment software, navigate to the "QNSim1.0" directory in the "Current Folder" window, and open the filed entitled "Initialization.m." Click "Run" to launch the initialization screen (Figure 1).
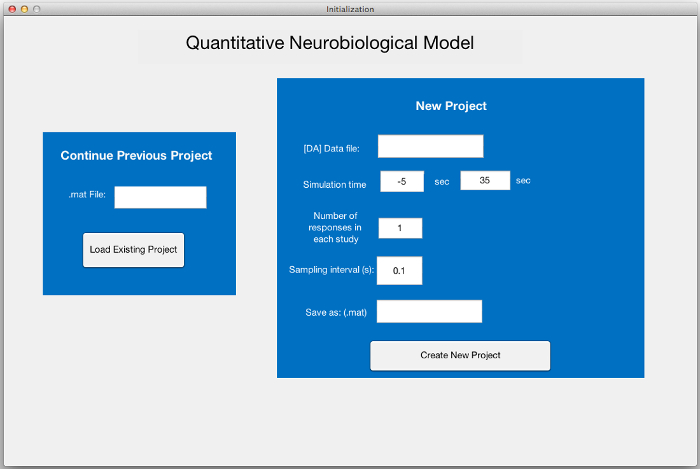
Figure 1: Initialization Screen. This screen allows users to continue an existing project, by entering a previous *.mat project file (left), or to begin a new project from stored data of stimulated DA neurotransmission (right). Textboxes are provided to input the *.xlsx filename containing the data, a few essential descriptors of the data, and the *.mat project filename that will contain all the data relating to the project. Please click here to view a larger version of this figure.
2. Initialization of the Simulation Environment
Note: The initialization screen allows users to begin a new project (step 2.1) or continue with a previously saved project (step 2.2).
- Option 1: Beginning a new project
- Under the New Project section, type in the name of the spreadsheet file that contains the DA response data for the project (e.g., Sample.xlsx) into the [DA] Data file textbox.
Note: The file must be in the same folder as the program files. - Next to Simulation time, input the time points corresponding to the start and end of data collection (in seconds) relative to the start of the stimulation. For example, if the data collection begins 5 s before the stimulation and ends 35 s after, as in the Sample.xlsx, input "-5" and "35."
- Input the number of responses in each study next to the corresponding text box.
- Next to sampling interval, input the experimental data sampling interval in seconds.
- Next to Save as (.mat), designate the filename, including the file type (.mat) where the project is to be saved.
Note: This is the file that will be accessed to create the simulations, and all work can be saved to this project file. - Click Create New Project to launch the Simulator window (Figure 2).
- Under the New Project section, type in the name of the spreadsheet file that contains the DA response data for the project (e.g., Sample.xlsx) into the [DA] Data file textbox.
- Option 2: Continuing a previous project
- In the Continue Previous Project section of the Initialization window, enter the.mat filename of a previously begun project (e.g., Sample.mat).
Note: This file must be contained within the same folder as the software program files. - Click Load Existing Project to launch the Simulator window (Figure 2).
- In the Continue Previous Project section of the Initialization window, enter the.mat filename of a previously begun project (e.g., Sample.mat).
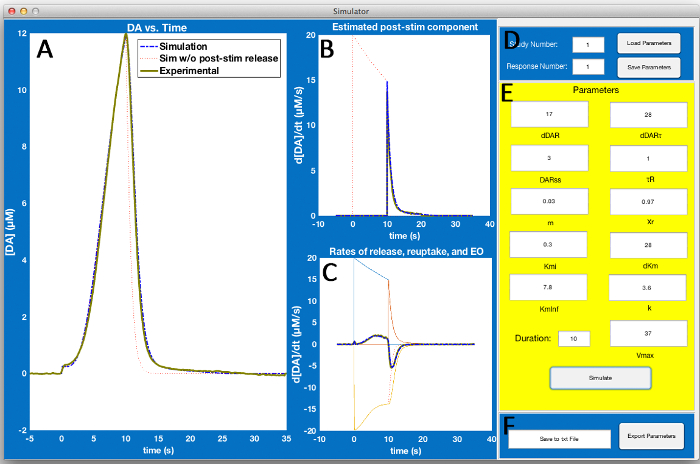
Figure 2: Simulator Screen. The simulator screen allows users to select the experimental data in D and adjust simulation parameters in E to model the experimental data. Visual inspection of (A, B, and C) can then aid in the refinement of simulation parameters so that the simulation (blue dashed lines) models the experimental data (thick green lines). Here, (A) contains experimental and simulated DA concentration versus time data. (B) is a graph that aids in estimating post-stimulation DA release. (C) is a plot of the experimental and simulated first derivatives of DA concentration versus time data from A or the rate of evoked overflow (EO). The rate of EO is theoretically a balance of release-reuptake rates, which is superimposed on this graph. Please click here to view a larger version of this figure.
3. Using the Simulator Window
Note: The Simulator screen allows for selecting the experimental data to model (step 3.1), adjust parameters to simulate experimental DA response data (step 3.2), save/load modeling parameters for each DA response (step 3.3), and export the saved parameters (step 3.4).
- Selecting the experimental DA response to simulate.
- Select the experimental DA response to simulate by inputting the study number, response number, and duration of the stimulation in the corresponding textboxes. Press the "enter" key or click simulate to begin the simulation process, which creates 3 graphs containing experimental data (thick green lines), simulated data (blue dashed lines), and simulated data that does not account for post-stimulation DA release (red dotted lines), as in Figure 2.
- Modeling experimental DA responses.
Note: The objective of modeling is to adjust the model parameters relating to stimulated DA release (step 3.2.1), DA reuptake (step 3.2.2), and post-stimulation DA release (step 3.2.3) to accurately model experimental DA responses. Modeling is an iterative process whereby the starting parameters are refined until the parameters yield a simulated DA response that approximates the experimental data in the DA versus Time graph (Panel A), which can be aided by fitting the simulated data to the experimentally derived data in the Estimated post-stimulation component graph(Panel B)and the Rates of release, reuptake, and EO graph (Panel C).- Adjust the ΔDAR, ΔDARτ, and DARss parameters associated with DA release (Equation 2) to match the amplitude of the stimulation.
Note: These parameters are only starting estimates that will get refined, but ΔDARτ=25 and a DARss value that is 1/5th of ΔDAR are satisfactory starting conditions. Increasing any of these parameters will increase the amplitude in the DA versus Time graph and increase the DA release rate in the Estimated post-stimulation release component and Rates of release, reuptake, and EO graphs. - Adjust the Vmax, Kmi, ΔKm, Kminf, and k parameters associated with to DA reuptake (Equation 4), such that in Panel A, the simulated data approximates the shape of the rising phase of the experimental data (thick green line) and such that the simulation w/o post-stim release trace (red dotted line) is less than the experimental data trace for all post-stimulation time points.
Note: This step likely requires readjusting DA release parameters (step 3.2.1). - Adjust the XR, τR, and m parameters associated with post-stimulation DA release (Equation 3), such that the simulation approximates the experimental data in the DA versus Time graph.
Note: XR should take on a value between 0 and 1 and should generally be greater than 0.7.
- Adjust the ΔDAR, ΔDARτ, and DARss parameters associated with DA release (Equation 2) to match the amplitude of the stimulation.
- Saving/loading the modeling parameters.
- Once a set of parameters closely models the experimental data, click Save Parameters, which will save that set of parameters for the given response to the.mat file for the project.
- If required, load previously saved parameters for a particular response by clicking Load Parameters. Ensure that the appropriate study number and response number are inputted in the corresponding text boxes.
- Exporting saved parameters.
- In the textbox next to the Export Parameters button, type in the filename (e.g., Sample.txt) and click Export Parameters to export a text file with all the parameters of the simulations. Delimit the text file using spaces to generate a spreadsheet of parameters, as in Figure 4 of the Representative Results section below.
Access restricted. Please log in or start a trial to view this content.
Results
Included with the software program are sample DA neurotransmission data obtained from the rat dorsal striatum (Study 1) and the nucleus accumbens (Study 2) that are compiled into "Sample.xlsx." The spreadsheet contains the DA concentration data of the baseline responses to 60 Hz, 10 s and 5 s stimulations and a response to a 60 Hz, 5 s stimulation 35 min after the administration of the DA transport inhibitor methylphenidate (MPH) (10 mg/kg, i.p.). The stimulated DA response data is organized into columns, as demonstrated...
Access restricted. Please log in or start a trial to view this content.
Discussion
The use of FSCV to study in vivo stimulated DA neurotransmission originated in the 1980s30 and still continues to be a rich source of in vivo neurotransmission data with unparalleled spatial and temporal resolution. Stimulated DA responses reflect a complex balance of DA release and reuptake that are modulated by the electrical stimulations themselves. The QN model incorporates principles from contemporary neurotransmission research to model in vivo stimulated DA neurotr...
Access restricted. Please log in or start a trial to view this content.
Disclosures
The authors have nothing to disclose.
Acknowledgements
We acknowledge the UPMC Rehabilitation Institute for supporting this work.
Access restricted. Please log in or start a trial to view this content.
Materials
| Name | Company | Catalog Number | Comments |
|---|---|---|---|
| MATLAB R2016a for Mac | Mathworks | ||
| QNsim1.0 | In house software package | Software to model FSCV data using the QN framework |
References
- Taylor, I. M., et al. Kinetic diversity of dopamine transmission in the dorsal striatum. J Neurochem. 133 (4), 522-531 (2015).
- Harun, R., Grassi, C. M., Munoz, M. J., Torres, G. E., Wagner, A. K. Neurobiological model of stimulated dopamine neurotransmission to interpret fast-scan cyclic voltammetry data. Brain Res. 1599, 67-84 (2015).
- Taylor, I. M., Jaquins-Gerstl, A., Sesack, S. R., Michael, A. C. Domain-dependent effects of DAT inhibition in the rat dorsal striatum. Journal of neurochemistry. 122 (2), 283-294 (2012).
- Garris, P. A., Ciolkowski, E. L., Wightman, R. M. Heterogeneity of evoked dopamine overflow within the striatal and striatoamygdaloid regions. Neuroscience. 59 (2), 417-427 (1994).
- May, L. J., Wightman, R. M. Heterogeneity of stimulated dopamine overflow within rat striatum as observed with in vivo voltammetry. Brain Res. 487 (2), 311-320 (1989).
- Harun, R., et al. Fast-scan cyclic voltammetry demonstrates that L-DOPA produces dose-dependent regionally selective, bimodal effects on striatal dopamine kinetics in vivo. J Neurochem. , (2015).
- Jones, S. R., Garris, P. A., Wightman, R. M. Different effects of cocaine and nomifensine on dopamine uptake in the caudate-putamen and nucleus accumbens. The Journal of pharmacology and experimental therapeutics. 274 (1), 396-403 (1995).
- Budygin, E. A., John, C. E., Mateo, Y., Jones, S. R. Lack of cocaine effect on dopamine clearance in the core and shell of the nucleus accumbens of dopamine transporter knock-out mice. J Neurosci. 22 (10), RC222(2002).
- Jones, S. R., et al. Loss of autoreceptor functions in mice lacking the dopamine transporter. Nat Neurosci. 2 (7), 649-655 (1999).
- Wagner, A. K., et al. Chronic methylphenidate treatment enhances striatal dopamine neurotransmission after experimental traumatic brain injury. J Neurochem. 108 (4), 986-997 (2009).
- Wagner, A. K., et al. Controlled cortical impact injury influences methylphenidate-induced changes in striatal dopamine neurotransmission. J Neurochem. 110 (3), 801-810 (2009).
- Wightman, R. M., et al. Real-time characterization of dopamine overflow and uptake in the rat striatum. Neuroscience. 25 (2), 513-523 (1988).
- Moquin, K. F., Michael, A. C. Tonic autoinhibition contributes to the heterogeneity of evoked dopamine release in the rat striatum. J Neurochem. 110 (5), 1491-1501 (2009).
- Pyott, S. J., Rosenmund, C. The effects of temperature on vesicular supply and release in autaptic cultures of rat and mouse hippocampal neurons. J Physiol. 539 (Pt 2), 523-535 (2002).
- Atluri, P. P., Regehr, W. G. Delayed release of neurotransmitter from cerebellar granule cells. J Neurosci. 18 (20), 8214-8227 (1998).
- Wang, S. R., et al. Role of vesicle pools in action potential pattern-dependent dopamine overflow in rat striatum in vivo. J Neurochem. 119 (2), 342-353 (2011).
- Taschenberger, H., von Gersdorff, H. Fine-tuning an auditory synapse for speed and fidelity: developmental changes in presynaptic waveform, EPSC kinetics, and synaptic plasticity. J Neurosci. 20 (24), 9162-9173 (2000).
- Goda, Y., Stevens, C. F. Two components of transmitter release at a central synapse. Proc Nat Acad of Sci U S A. 91 (26), 12942-12946 (1994).
- Yao, J., Gaffaney, J. D., Kwon, S. E., Chapman, E. R. Doc2 is a Ca2+ sensor required for asynchronous neurotransmitter release. Cell. 147 (3), 666-677 (2011).
- Hagler, D. J., Goda, Y. Properties of synchronous and asynchronous release during pulse train depression in cultured hippocampal neurons. J Neurophysiol. 85 (6), 2324-2334 (2001).
- Ciliax, B. J., et al. The dopamine transporter: immunochemical characterization and localization in brain. J Neurosci. 15 (3 Pt 1), 1714-1723 (1995).
- Volz, T. J., Farnsworth, S. J., Rowley, S. D., Hanson, G. R., Fleckenstein, A. E. Methylphenidate-induced increases in vesicular dopamine sequestration and dopamine release in the striatum: the role of muscarinic and dopamine D2 receptors. J Pharm Exp Ther. 327 (1), 161-167 (2008).
- Dresel, S. H., Kung, M. P., Plossl, K., Meegalla, S. K., Kung, H. F. Pharmacological effects of dopaminergic drugs on in vivo binding of [99mTc]TRODAT-1 to the central dopamine transporters in rats. Eur J Nucl Med. 25 (1), 31-39 (1998).
- Near, J. A., Bigelow, J. C., Wightman, R. M. Comparison of uptake of dopamine in rat striatal chopped tissue and synaptosomes. J Pharm Exp Ther. 245 (3), 921-927 (1988).
- Michael, A. C., Ikeda, M., Justice, J. B. Jr Dynamics of the recovery of releasable dopamine following electrical stimulation of the medial forebrain bundle. Neurosci Lett. 76 (1), 81-86 (1987).
- Fierro, L., DiPolo, R., Llano, I. Intracellular calcium clearance in Purkinje cell somata from rat cerebellar slices. The Journal of physiology. 510 (Pt 2), 499-512 (1998).
- Sandoval, V., Riddle, E. L., Hanson, G. R., Fleckenstein, A. E. Methylphenidate redistributes vesicular monoamine transporter-2: role of dopamine receptors. J Neurosci. 22 (19), 8705-8710 (2002).
- Daws, L. C., et al. Cocaine increases dopamine uptake and cell surface expression of dopamine transporters. Biochem Biophys Res Commun. 290 (5), 1545-1550 (2002).
- Little, K. Y., Kirkman, J. A., Carroll, F. I., Clark, T. B., Duncan, G. E. Cocaine use increases [3H]WIN 35428 binding sites in human striatum. Brain Res. 628 (1-2), 17-25 (1993).
- Ewing, A. G., Bigelow, J. C., Wightman, R. M. Direct in vivo monitoring of dopamine released from two striatal compartments in the rat. Science. 221 (4606), 169-171 (1983).
- Janezic, S., et al. Deficits in dopaminergic transmission precede neuron loss and dysfunction in a new Parkinson model. Proc Natl Acad Sci U S A. 110 (42), E4016-E4025 (2013).
- Macdonald, P. A., Monchi, O. Differential effects of dopaminergic therapies on dorsal and ventral striatum in Parkinson's disease: implications for cognitive function. Parkinsons Dis. 2011, 572743(2011).
- Kile, B. M., et al. Optimizing the Temporal Resolution of Fast-Scan Cyclic Voltammetry. ACS Chem Neurosci. 3 (4), 285-292 (2012).
- Venton, B. J., Troyer, K. P., Wightman, R. M. Response times of carbon fiber microelectrodes to dynamic changes in catecholamine concentration. Anal Chem. 74 (3), 539-546 (2002).
- May, L. J., Wightman, R. M. Heterogeneity of stimulated dopamine overflow within rat striatum as observed with in vivo voltammetry. Brain research. 487 (2), 311-320 (1989).
- Wu, Q., Reith, M. E., Wightman, R. M., Kawagoe, K. T., Garris, P. A. Determination of release and uptake parameters from electrically evoked dopamine dynamics measured by real-time voltammetry. J Neurosci Methods. 112 (2), 119-133 (2001).
Access restricted. Please log in or start a trial to view this content.
Reprints and Permissions
