We performed unilateral carotid artery occlusion on postnatal day 7-10 CD-1 mouse pups to create a neonatal hypoxic-ischemic (HI) model and investigated the effects of HI brain injury. We studied neurobehavioral functions in these mice compared to non-operated normal mice.
Method Article
Neurobehavioral Assessments in a Mouse Model of Neonatal Hypoxic-ischemic Brain Injury
In This Article
Summary
Abstract
We performed unilateral carotid artery occlusion on CD-1 mice to create a neonatal hypoxic-ischemic (HI) model and investigated the effects of neonatal HI brain injury by studying neurobehavioral functions in these mice compared to non-operated (i.e., normal) mice. During the study, Rice-Vannucci's method was used to induce neonatal HI brain damage in postnatal day 7-10 (P7-10) mice. The HI operation was performed on the pups by unilateral carotid artery ligation and exposure to hypoxia (8% O2 and 92% N2 for 90 min). One week after the operation, the damaged brains were evaluated with the naked eye through the semi-transparent skull and were categorized into subgroups based on the absence ("no cortical injury" group) or presence ("cortical injury" group) of cortical injury, such as a lesion in the right hemisphere. On week 6, the following neurobehavioral tests were performed to evaluate the cognitive and motor functions: passive avoidance task (PAT), ladder walking test, and grip strength test. These behavioral tests are helpful in determining the effects of neonatal HI brain injury and are used in other mouse models of neurodegenerative diseases. In this study, neonatal HI brain injury mice showed motor deficits that corresponded to right hemisphere damage. The behavioral test results are relevant to the deficits observed in human neonatal HI patients, such as cerebral palsy or neonatal stroke patients. In this study, a mouse model of neonatal HI brain injury was established and showed different degrees of motor deficits and cognitive impairment compared to non-operated mice. This work provides basic information on the HI mouse model. MRI images demonstrate the different phenotypes, separated according to the severity of brain damage by motor and cognitive tests.
Introduction
Neonatal HI brain injury occurs during early childhood (approximately two patients per 1,000 children)1,2,3,4,5. Studies regarding neonatal HI brain injury are important, and using an established neonatal HI brain injury mouse model can facilitate in vivo preclinical research on HI brain injury.
Traditional HI models are used on adult rats6. For the neonate model, the Rice-Vannucci method is commonly used on P7 rats7,8. However, since rats and mice are slightly different9,10, even though they are both rodents, we performed a modified Rice-Vannucci method on CD-1 pups at P7-10, based on previous studies that showed that P7-10 is the period featuring immature oligodendrocytes, corresponding to human term P011,12. The neonatal HI mouse model is established through both the ligation of the unilateral carotid artery and the exposure of the mice to hypoxia with 8% oxygen in P7-10 pups.
The mice subjected to the procedure showed various degrees of brain lesions in the posterolateral area of the right hemisphere. To identify the cognitive and motor deficits, neurobehavioral assessments based on the PAT, ladder walking test, and grip strength test were performed. The differences between non-operated (i.e., normal) and HI mice were analyzed. This work presents basic information on the HI mouse model. The MRI images demonstrate the different phenotypes, separated according to the severity of brain damages using motor and cognitive tests.
Protocol
All animals were housed in a standard cage (27 × 22.5 × 14 cm3) in a facility accredited by the Association for Assessment and Accreditation of Laboratory Animal Care (AAALAC) and given food and water ad libitum under alternating 12-h light/dark cycles. The authors followed animal protection regulations, and the experimental procedures were approved by the Institutional Animal Care and Use Committee of Yonsei University College of Medicine (IACUC No. 2010-0252; 2013-0220).
1. Mouse Model of Neonatal HI Brain Injury
- Anesthetize the pups with isoflurane.
- Place the pups (less than 5) into an anesthetizing box and close the lid.
- Turn on the anesthetizing system for approximately 15 min; adjust the gas and isoflurane using a table top anesthesia machine. Adjust the oxygen flowmeter to 1.5 L/min. Adjust the isoflurane vaporizer to 3-5% for the induction of anesthesia.
- After 15 min, adjust the isoflurane vaporizer to 1-2% for the maintenance of anesthesia.
- Lay a fully anesthetized pup under a dissection microscope (abdomen facing the researcher) and secure it with tape.
- Make a ~0.7-mm incision in the neck using sterilized scissors.
- Carefully remove the adipose tissue using sterilized forceps and expose the unilateral right carotid artery.
- Ligate the unilateral right carotid artery with a 5-0 absorbable suture.
- Suture the incision in the neck with 5-0 suture.
- Place each pup in a 37 °C warm hypoxic chamber for 1 h for recovery. Do not close the chamber lid.
- 1 h after the surgery, when the pups are fully awake, close the hypoxia chamber lid and decrease the gas levels to establish hypoxic conditions (8% O2 and 92% N2).
- After 90 min of hypoxia, return the pups to their cages.
- One week after the HI brain injury, repeat step 1.
- After the anesthesia, make an incision in the scalp with sterilized scissors and forceps to identify the brain lesion in the posterolateral area of the right hemisphere.
Note: This treatment induces hypoxia in pups. The presence and extent of brain injury in all mice is visually assessed with the naked eye through the semi-transparent skull. As determined by the size or volume of the discoloration (i.e., the brain lesion), pups are classified into groups. If there is no visible cortical injury , the mouse is classified into the “no cortical injury” group. If there is a visible cortical injury (i.e., a lesion in the right hemisphere), the mouse is classified into the “cortical injury” group. Since classification of the mice into groups is done one week after the operation, the groupings can be modified when the morphologies of the brain samples are clearly defined at the time of sacrifice1,2,3,4.
- After the anesthesia, make an incision in the scalp with sterilized scissors and forceps to identify the brain lesion in the posterolateral area of the right hemisphere.
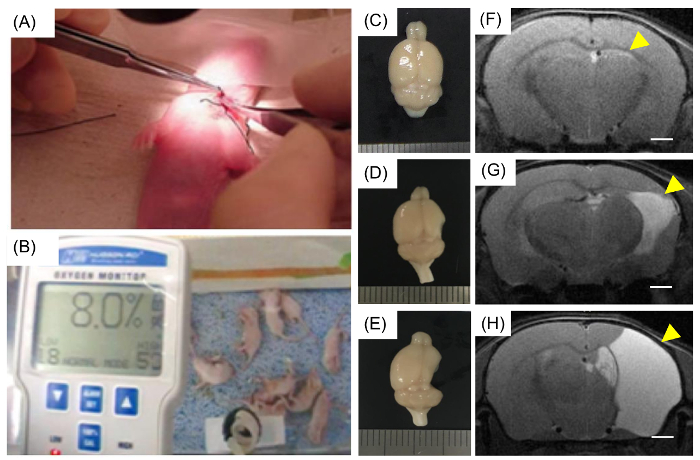
Figure 1: Modeling neonatal HI brain injury in mice.
(A) A seven-day-old mouse pup underwent surgery, and the unilateral right carotid artery was ligated. (B) Pups were placed in a hypoxic chamber for 90 min with 8% O2 and 92% N2. (C, D, and E) The brains with neonatal HI injury showed various severity of damage and were categorized based on the degree of damage. At week 14, the brains were obtained, and the lesions were visualized. (C) Image of a brain classified as a "no cortical injury". Both (D) and (E) were classified into the "cortical injury" group. (F, G, and H) Representative MRI of (C), (D), and (E) mice, respectively. (F) The damage in the hippocampus is indicated with a yellow arrow, and lesions in the right hemisphere are also indicated with yellow arrows (G and H). Scale bars = 1 mm Please click here to view a larger version of this figure.
2. Neonatal Behavioral Tests
Note: Here, the behavioral tests were performed at 6 weeks of age.
- Passive avoidance task.
NOTE: To evaluate memory function based on learning and the avoidance of an aversive stimulus, a two-compartment step-through PAT should be conducted13,14,15,16.- Place a mouse into the bright compartment of the Plexiglas shuttle box (41.5 × 21 × 35 cm3) of a PAT apparatus.
- After 30 s, open the guillotine door and record the latency time for the mouse to move into the dark compartment (up to 300 s).
- Close the guillotine door when all four limbs of the mouse are fully inside the dark compartment.
- Administer electric foot shock (0.5 mA) for 2 s and return the mouse to its cage.
- Replace the mouse in the bright compartment 24 h after the electric foot shock.
- Open the guillotine door 10 s after the mouse is fully placed in the bright compartment, and record the latency time for the mouse to move into the dark compartment (up to 300 s).
- Ladder walking test.
NOTE: The ladder rung walking task allows for the discrimination between subtle disturbances of motor function by combining qualitative and quantitative analyses of skilled walking17,18.- Turn on a video camera.
- Place a mouse on the start panel of the ladder and immediately begin recording.
- Record the video, focusing on the mouse limbs.
- Stop recording when the mouse touches the last panel of the ladder. Repeat the back-and-forth trip four times.
- Analyze the video recording and manually count the number of slips of each forelimb, as follows:
- Play recording of the video on a computer at a slow speed (0.1x) and count the steps manually.
- Grip strength test.
NOTE: The grip strength test is performed using a grip strength meter, which includes a push-pull strain gauge.- Fix the grip strength apparatus onto an acrylic panel.
- Place a mouse on the acrylic panel and hold its tail.
- Move the hand holding the tail so that the mouse can reach and grip the metal wire of the apparatus.
- Allow multiple trials until the mouse grips a triangular piece of metal wire (2 mm in diameter); the peak force is automatically registered in grams by the apparatus.
NOTE: Use the mean peak force of three trials for analysis19,20,21.
Results
All data are expressed as the mean ± standard error of the mean (SEM). The comparison of variables between the two groups was conducted using an independent or paired t-test on SPSS statistics software. A p-value <0.05 was considered statistically significant.
The brains with neonatal HI injury showed different severity of damage and were categorized accordingly (Figure 1C-E). The brains were obtained at week 14, and the lesions were visualized. Figure 1C shows a brain classified as a "no cortical injury" brain, Figure 1D shows a brain classified as a mild injury, and Figure 1E shows a severely damaged brain. Both (D) mild and (E) severe injuries were classified into the "cortical injury" group. After the HI operation, 13-week-old mice were imaged using MRI, and the results (Figure 1F-H) are representative images of (C), (D), and (E) injuries, respectively. Even though there was no significant lesion on the morphology of the brain, the MRI image showed hippocampal injury (Figure 1F). Damage to the hippocampus (Figure 1F, indicated with a yellow arrow) is slightly apparent in the mildly injured brain. In a severely damaged brain, the mouse lost most of the right hemisphere (Figure 1G and H, indicated with a yellow arrow).
Since the brains with HI injury showed hippocampal injury (Figure 1F-H), the mice with HI injury exhibited memory deficits compared to the normal mice. PAT performance is closely related to hippocampal damage13,15,16,19. Figure 2 shows that the mice with HI injury had more cognitive deficits than the normal mice13, as assessed in the PAT (normal n = 10; HI n = 9). A statistically significant difference was observed between the baseline and the 24-h memory test in normal mice, as shown in Figure 2A (*p = 0.003 based on a paired t-test). Figure 2B shows the changes in cognitive function in the HI injury mice compared to normal mice (delta (Δ) is the difference between baseline and the 24-h test)13.
Because only the right hemisphere was damaged, the neonatal HI brain injury mice showed hemiplegic motor functions. The difference in the percentage of slips on the transverse rungs of the ladder relative to the total number of steps taken by each forelimb was used to compare normal mice with neonatal HI brain injury mice17,19. Figure 3 shows that the slip rate of the contralateral forelimb in the HI brain injury mice was significantly higher than that in the normal mice (normal n = 19; HI n = 18; *p = 0.010 based on an independent t-test)22, but no difference was observed in the ipsilateral forelimb(p = 0.798 based on an independent t-test).
Moreover, since the grip strength involves the motor cortex in the brain, the normal and cortical injury groups showed differences in grip power. Although the results from the grip strength test showed no difference between the normal and no cortical injury mice (Figure 4A; normal n = 4; no cortical injury n = 12), the graph shows that the grip power of the contralateral forelimb was significantly weaker in the cortical injury mice than in the normal mice (Figure 4B; normal n = 4; cortical injury n = 36; *p = 0.036 based on an independent t-test)21,22,23.
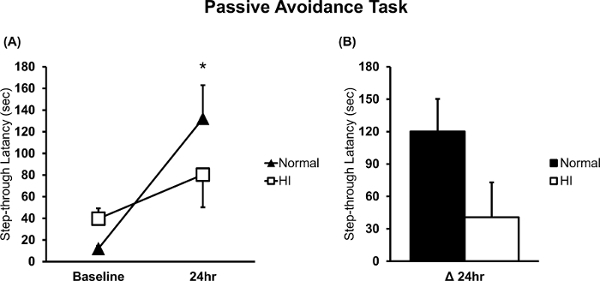
Figure 2: PAT in neonatal HI brain injury and normal mice.
(A) The latency time in the bright compartment was measured and compared between neonatal HI brain injury and normal mice (n = 9 and n = 10, respectively). (B) The measurement at the moment of the electronic shock was considered the baseline, and long-term memory was evaluated 24 h after the electric shock. Delta (Δ) 24-h latency was the difference between the function evaluated at 24 h and at baseline. *p<0.05; all data are expressed as the mean ± SEM. Please click here to view a larger version of this figure.
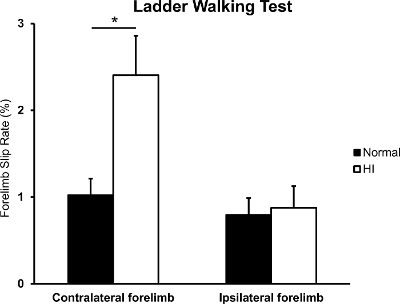
Figure 3: Forelimb slip rate in the ladder walking test.
The rates of contralateral and ipsilateral forelimb slip were evaluated between the normal and HI brain injury mice (n = 19 and n = 18, respectively). *p<0.05; all data are expressed as the mean ± SEM. Please click here to view a larger version of this figure.

Figure 4: Grip strength test in neonatal HI brain injury and normal mice.
Grip power of the contralateral forelimb was evaluated and compared between (A) normal, no cortical injury and (B) cortical injury mice (n = 4, n = 12, n = 36). *p<0.05; all data are expressed as the mean ± SEM. Please click here to view a larger version of this figure.
Discussion
In this study, we induced HI brain injury in a neonatal P7-10 CD-1 mouse and identified the brain lesion with relevant cognitive and motor deficits. During this procedure, occlusion of the unilateral right carotid artery was critical. In this step, the artery could be damaged and torn. Most pups who experienced an artery tear died. Conversely, if researchers ligated another blood vein instead of the unilateral right carotid artery, the brain of the pup was only mildly damaged, and no significant phenotype could be observed24.
In this study, due to variations in mice and lesion volume, the brains were categorized into several groups (Figure 1C-H). Several mice with mildly injured brains had damage only in the hippocampus and not in the cortical region (Figure 1F)13. Conversely, several mice with severely damaged brains lost most of the right hemisphere, and the cortices were severely damaged (Figure 1G and H). Therefore, researchers should identify the size of the lesion one week after the procedure19,25. Since brains were evaluated using MRI scans, the determination of the volume and size of a lesion was more reliable. Therefore, we recommend that researchers evaluate the brains using MRI, although visual inspection with the naked eye is also feasible.
Cerebral palsy commonly occurs during early childhood, with an incidence rate of approximately two patients per 1,000 children5. Since the neonatal HI mouse model could be a representative model of cerebral palsy or neonatal stroke4,11,26, the baseline information from this study can be used in preclinical research on cerebral palsy or neonatal stroke.
Neurobehavioral assessments are useful to identify the phenotypes of cognitive and motor deficits13. The neurobehavioral assessments introduced in this study are also adaptable and are commonly used for other neurodegenerative diseases, such as Huntington's, Parkinson's, and so on. Researchers should be aware that, during PAT, subjects receive an electric shock. Therefore, PAT should be performed last, so the electric shock does not affect the other behavioral assessments.
For further study, researchers need to study a sham-operated group in comparison with the HI group. For a specific control group, researchers can make an incision on the neck and close the incision without any artery ligation. To mimic the HI operation, these pups should be put into the hypoxic chamber, but without hypoxia, for the same amount of time as an HI group before being returned to their cages.
Disclosures
The authors have no competing interests.
Acknowledgements
This study was supported by grants from National Research Foundation (NRF-2014R1A2A1A11052042; 2015M3A9B4067068), the Ministry of Science and Technology, Republic of Korea, the Korean Health Technology R&D Project (HI16C1012), Ministry of Health & Welfare, Republic of Korea, and the “Dongwha” Faculty Research Assistance Program of Yonsei University College of Medicine (6-2016-0126).
Materials
| Name | Company | Catalog Number | Comments |
|---|---|---|---|
| Hypoxic chamber | Jeung Do Bio & Plant Co | Experimental Builder | |
| PAT apparatus | Jeung Do Bio & Plant Co | Experimental Builder | |
| The ladder rung walking | Jeung Do Bio & Plant Co | Experimental Builder | |
| SDI Grip Strength System | San Diego Instruments Inc. | ||
| Grip-Strength Meter | Ugo Basile | 47200 | |
| Harvard Apparatus Fluovac anesthetizing system | Harvard Apparatus | ||
| Anesthetizing box | acryl box | ||
| I-Fran Liquid (Isofluorane) | Hana Pharm. Co., Ltd. | General Anesthetics ( isoflurane 100ml) | |
| CD-1 mice | Orient Co., Ltd. | ||
| Blue Nylon Mono Non-Absorbbable suture 5-0 50cm | Ailee Co., Ltd. | NB 521 | |
| IBM SPSS Statistics | IBM | Ver. 23 |
References
- Yager, J. Y. Animal models of hypoxic-ischemic brain damage in the newborn. Semin Pediatr Neurol. 11 (1), 31-46 (2004).
- Vannucci, R. C., et al. Rat model of perinatal hypoxic-ischemic brain damage. J Neurosci Res. 55 (2), 158-163 (1999).
- Im, S. H., et al. Induction of striatal neurogenesis enhances functional recovery in an adult animal model of neonatal hypoxic-ischemic brain injury. Neuroscience. 169 (1), 259-268 (2010).
- Clowry, G. J., Basuodan, R., Chan, F. What are the Best Animal Models for Testing Early Intervention in Cerebral Palsy? Front Neurol. 5 (258), 1-17 (2014).
- Colver, A., Fairhurst, C., Pharoah, P. O. Cerebral palsy. Lancet. 383 (9924), 1240-1249 (2014).
- Levine, S. Anoxic-ischemic encephalopathy in rats. Am J Pathol. 36, 1-17 (1960).
- Rice 3rd, J. E., Vannucci, R. C., Brierley, J. B. The influence of immaturity on hypoxic-ischemic brain damage in the rat. Ann Neurol. 9 (2), 131-141 (1981).
- Lafemina, M. J., Sheldon, R. A., Ferriero, D. M. Acute hypoxia-ischemia results in hydrogen peroxide accumulation in neonatal but not adult mouse brain. Pediatr Res. 59 (5), 680-683 (2006).
- Brazel, C. Y., Rosti 3rd, R. T., Boyce, S., Rothstein, R. P., Levison, S. W. Perinatal hypoxia/ischemia damages and depletes progenitors from the mouse subventricular zone. Dev Neurosci. 26 (2-4), 266-274 (2004).
- Buono, K. D., et al. Mechanisms of mouse neural precursor expansion after neonatal hypoxia-ischemia. J Neurosci. 35 (23), 8855-8865 (2015).
- Rumajogee, P., Bregman, T., Miller, S. P., Yager, J. Y., Fehlings, M. G. Rodent Hypoxia-Ischemia Models for Cerebral Palsy Research: A Systematic Review. Front Neurol. 7 (57), 1-20 (2016).
- Hagberg, H., Peebles, D., Mallard, C. Models of white matter injury: comparison of infectious, hypoxic-ischemic, and excitotoxic insults. Ment Retard Dev Disabil Res Rev. 8 (1), 30-38 (2002).
- Wi, S., Yu, J. H., Kim, M., Cho, S. R. In Vivo Expression of Reprogramming Factors Increases Hippocampal Neurogenesis and Synaptic Plasticity in Chronic Hypoxic-Ischemic Brain Injury. Neural Plast. 2016 (2580837), 1-11 (2016).
- Lu, Y., Christian, K., Lu, B. BDNF: a key regulator for protein synthesis-dependent LTP and long-term memory? Neurobiol Learn Mem. 89 (3), 312-323 (2008).
- Manabe, T., et al. Facilitation of long-term potentiation and memory in mice lacking nociceptin receptors. Nature. 394 (6693), 577-581 (1998).
- Alonso, M., et al. BDNF-triggered events in the rat hippocampus are required for both short- and long-term memory formation. Hippocampus. 12 (4), 551-560 (2002).
- Seo, J. H., et al. In Situ Pluripotency Factor Expression Promotes Functional Recovery From Cerebral Ischemia. Mol Ther. 24 (9), 1538-1549 (2016).
- Kim, M. S., et al. Environmental enrichment enhances synaptic plasticity by internalization of striatal dopamine transporters. J Cereb Blood Flow Metab. 36 (12), 2122-2133 (2015).
- Lee, M. Y., et al. Alteration of synaptic activity-regulating genes underlying functional improvement by long-term exposure to an enriched environment in the adult brain. Neurorehabil Neural Repair. 27 (6), 561-574 (2013).
- Rha, D. W., et al. Effects of constraint-induced movement therapy on neurogenesis and functional recovery after early hypoxic-ischemic injury in mice. Dev Med Child Neurol. 53 (4), 327-333 (2011).
- Chong, H. J., Cho, S. R., Jeong, E., Kim, S. J. Finger exercise with keyboard playing in adults with cerebral palsy: A preliminary study. J Exerc Rehabil. 9 (4), 420-425 (2013).
- Chong, H. J., Cho, S. R., Kim, S. J. Hand rehabilitation using MIDI keyboard playing in adolescents with brain damage: a preliminary study. NeuroRehabilitation. 34 (1), 147-155 (2014).
- Seo, J. H., Yu, J. H., Suh, H., Kim, M. S., Cho, S. R. Fibroblast growth factor-2 induced by enriched environment enhances angiogenesis and motor function in chronic hypoxic-ischemic brain injury. PLoS One. 8 (9), e74405(2013).
- Washington, P. M., et al. The effect of injury severity on behavior: a phenotypic study of cognitive and emotional deficits after mild, moderate, and severe controlled cortical impact injury in mice. J Neurotrauma. 29 (13), 2283-2296 (2012).
- Cho, S. R., et al. Astroglial Activation by an Enriched Environment after Transplantation of Mesenchymal Stem Cells Enhances Angiogenesis after Hypoxic-Ischemic Brain Injury. Int J Mol Sci. 17 (9), 1-15 (2016).
- Tsuji, M., et al. A novel reproducible model of neonatal stroke in mice: comparison with a hypoxia-ischemia model. Exp Neurol. 247, 218-225 (2013).
Reprints and Permissions
