This manuscript describes how to distinguish different nematodes using far-field diffraction signatures. We compare the locomotion of 139 wild type and 108 "Roller" C. elegans by averaging frequencies associated with the temporal Fraunhofer diffraction signature at a single location using a continuous wave laser.
Method Article
Fourier-Based Diffraction Analysis of Live Caenorhabditis elegans
In This Article
Summary
Abstract
This manuscript describes how to classify nematodes using temporal far-field diffraction signatures. A single C. elegans is suspended in a water column inside an optical cuvette. A 632 nm continuous wave HeNe laser is directed through the cuvette using front surface mirrors. A significant distance of at least 20-30 cm traveled after the light passes through the cuvette ensures a useful far-field (Fraunhofer) diffraction pattern. The diffraction pattern changes in real time as the nematode swims within the laser beam. The photodiode is placed off-center in the diffraction pattern. The voltage signal from the photodiode is observed in real time and recorded using a digital oscilloscope. This process is repeated for 139 wild type and 108 "roller" C. elegans. Wild type worms exhibit a rapid oscillation pattern in solution. The "roller" worms have a mutation in a key component of the cuticle that interferes with smooth locomotion. Time intervals that are not free of saturation and inactivity are discarded. It is practical to divide each average by its maximum to compare relative intensities. The signal for each worm is Fourier transformed so that the frequency pattern for each worm emerges. The signal for each type of worm is averaged. The averaged Fourier spectra for the wild type and the "roller" C. elegans are distinctly different and reveal that the dynamic worm shapes of the two different worm strains can be distinguished using Fourier analysis. The Fourier spectra of each worm strain match an approximate model using two different binary worm shapes that correspond to locomotory moments. The envelope of the averaged frequency distribution for actual and modeled worms confirms the model matches the data. This method can serve as a baseline for Fourier analysis for many microscopic species, as every microorganism will have its unique Fourier spectrum.
Introduction
This method compares experimental and modeled frequency spectra of the locomotion of C. elegans using two strains with very different locomotory patterns. The results show that the frequency spectrum depends on temporal changes as the nematode swims in a water column so that clear microscopic images are not needed for analysis. This method allows for quantitative real-time analysis and provides complementary information to images/videos obtained with traditional microscopes. Fraunhofer diffraction, also called far-field diffraction, provides the basis for obtaining live diffraction data1,2. The light intensity at any single point in the diffraction pattern is the result of superimposing light from every point in the outline of the nematode3. As a result, the light intensity collected over time carries information about the locomotion of the nematode. Analyzing the time-dependent diffraction signal can identify the characteristic motion of the corresponding mutant since analyzing all the frequencies involved in the locomotion complements the traditional video analysis. In this case, the characteristic differences between the locomotion of the "roller" and wild type C. elegans are confirmed by comparing the frequency spectra of the two different strains of nematode.
Some previous characteristics have been confirmed using frequency analysis of diffraction signals such as swimming frequencies2,4. More importantly, this method can be used as a complementary method to traditional microscopy to observe locomotion in real time on a computer screen as the data are being collected. The frequency spectrum of worms with distinct locomotory patterns can be quantified by considering the Fourier transformed signal of the diffraction signal.
The multidisciplinary nature of Fourier-based diffraction in this work involves the fields of biology and physics. Diffraction by under sampling has long been used to investigate crystal structures in biology5 and other fields. In this experiment, however, oversampling6,7 creates the far-field diffraction pattern so that the organism is centered in the laser beam. Oversampling is typically used for lens-less imaging8 in conjunction with a phase retrieval algorithm that reconstructs an image of the original object. Phase retrieval is difficult to achieve when scatterers are present as is the case with a nematode. The temporal diffraction signature is enough to evaluate key frequencies of the worm motion. This method is less computationally taxing and provides an optical way to quantify locomotion. This technique could readily be adapted for analysis of mutations or environmental conditions that alter behavior.
Protocol
1. C. elegans Growth and Maintenance
- Prepare nematode culture dishes.
- Fill the Petri dishes with an agar solution and leave them to solidify, then seed with an E. coli culture of the OP50 strain9,10.
- Prepare a starting population of adult nematodes on each plate by moving several adult worms to fresh agar-filled Petri dishes with an E. coli patch. Maintain the nematode cultures at 20 °C in an incubator.
NOTE: Nematode strains can be obtained from the Caenorhabditis elegans Genome Center. For this study, the wild type, N2, strain and the OH7547 (otls199[cat-2::GFP + rgel-1(F25B3.3)::dsRed + rol-6(su1006)]) strain, which exhibits a roller phenotype, were utilized. - Propagate worms for future cultures.
- Remove the Petri dish containing C. elegans and an unused habitat Petri dish from the temperature-controlled incubator. Place them on the stage of a dissecting microscope.
- Light the Bunsen burner and sterilize the platinum nematode pick by placing the metal into the flame until it glows red. Allow the pick to cool to room temperature. Do not set the pick down or let the pick come into contact with contaminants.
- Gently touch the tip of the pick to the edge of the circle of bacteria. This substance is sticky and will make picking individual adult nematodes easier.
- Transfer up to 4 gravid nematodes to a Nematode Growth Medium (NGM) agar-filled Petri plate and incubate at 20 °C. The worms will lay eggs that will mature in four days.
- Return the remaining nematodes to the incubator after moving four adult nematodes.
2. Optical Setup (Figure 1)
- Secure the helium-neon laser near the back-left corner of the optical workbench and connect it to a power source.
NOTE: The laser's beam must fulfill the requirements for oversampling. The C. elegans are approximately 1 mm long, therefore the laser beam should have a diameter greater than 2 mm while incident on the nematode, but no larger than 5 mm so that the diffraction pattern is not difficult to locate. - Place a neutral density filter between the helium-neon laser and the sample such that the laser beam travels through the filter before reaching the sample.
- Using two front surface aluminum steering mirrors, build a periscope by securing the first mirror after the neutral density filter. Secure the second mirror about 10 cm below the first mirror to give room to steer the laser beam and insert the cuvette between the mirrors. Align the laser beam and cuvette so that the laser beam travels vertically through the cuvette.
NOTE: The distance from the diffracting organism to the photodiode must be much larger than the organism itself to achieve far-field diffraction. In this experiment, the distance from the cuvette to the photodiode is 20 cm. - Secure the photodiode directly across from the second mirror with its sensor facing the mirror.
NOTE: The cuvette containing the nematode will be placed between the two mirrors using chemistry clamps. See sections 4 and 5. - Place a water-filled cuvette on the stand. Adjust the height of the stand. Adjust the heights and angles of mirror 1 and mirror 2 so that the laser beam travels through the cuvette aimed near but not directly at the photodiode.
- Use a level to ensure the stands form a leveled surface for the cuvette. Adjust the mirrors further if necessary.
- Connect the photodiode to the digital oscilloscope using the USB cable provided with the digital oscilloscope. Connect the digital oscilloscope to the computer that will be used to record and save the data.
3. Oscilloscope Setup
- Using the software for the oscilloscope on the computer, set the sample rate to at least 8 Hz to resolve the thrashing cycle of the worm sufficiently.
NOTE: The sample rate should be more than twice that of the expected thrashing frequencies of the species so that the Nyquist theorem11 is satisfied.
4. Preparing the Worm and Cuvette for Data Collection
- Transfer four adult nematodes to a fresh NGM10 agar-filled Petri plate using a thin, flattened platinum wire pick (see section 1.3).
- Remove one disposable plastic cuvette from its package, being careful to only touch the cuvette on its ridged sides.
- Use a micropipette to pipette distilled water into the cuvette until the cuvette is approximately 80% filled with distilled water.
NOTE: It is important to only use distilled water or ionized buffers such as M910 or phosphate-buffered saline (PBS) when handling the nematodes, as tap water contains microorganism-killing compounds. - Place the Petri dish containing the C. elegans to be used under a dissecting scope.
- Using the platinum pick, remove one mature C. elegans from the Petri dish and submerge the pick into the cuvette, moving the pick in circles if necessary to dislodge the nematode.
- To prevent bubbles forming in the cuvette, fill the cuvette with water until it slightly bulges over the cuvette's top. Fill the cuvette's cap entirely with water then quickly put the cap onto the cuvette.
- Use an optical cleaning cloth to remove water droplets that may have spilled over and optical cleaning paper to clean any small remaining droplets.
5. Real Time Data-Acquisition of Diffraction Pattern Intensity Changes
- Turn on the helium-neon laser and adjust the frequency/color setting so that it produces a red beam. Turn on the sensor.
Caution: Use a low-energy beam at 632 nm, as C. elegans avoid high-frequency (blue) light12. - Locate the worm in the cuvette. Holding the cuvette on its ridged sides, gently tilt the cuvette until nematode is approximately in the center of the portion of the cuvette.
NOTE: Shaking or tilting the cuvette violently causes the worm to collide with the walls of the cuvette. This can damage the nematode.- Place the cuvette onto the stand in the optical system, centering the worm within the laser's beam reflected from Mirror 1 to Mirror 2. Be sure to eliminate stray light.
- Center the worm in the laser beam.
- Place the photodiode in the diffraction pattern so that the location of the photodiode and the central maximum of the diffraction pattern do not coincide.
- Adjust the neutral density filter to prevent saturation of the photodiode. Rotating the neutral density filter wheel regulates the light intensity.
- Rotate the neutral density filter so that the voltage output from the photodiode increases.
NOTE: The voltage output is observed using the software for the digital photodiode. The photodiode is saturated if the voltage does not change. In that case, rotate the neutral density filter until the voltage reduces without flattening out at a minimum reading. Ensure that the voltage signal does not flatten at the peak readings, indicating saturation of the photodiode. Reduce the light intensity by rotating the neutral density filter wheel if saturation is observed.
- Rotate the neutral density filter so that the voltage output from the photodiode increases.
- Once the moving diffraction pattern is visible, collect data with the photodiode by clicking the start button on the software controlling the oscilloscope while monitoring the worm's movement. Continue taking measurements until the worm moves out of the laser beam and the diffraction pattern disappears, which usually takes about 20 s.
- Stop the data collecting process by clicking the stop button on the software for the oscilloscope. Save each trial's data in .csv or .txt format.
- Repeat steps 5.2 - 5.3 until at least 50 data sets have been collected for each phenotype. Use eight to ten animals per trial.
- If the cuvette is scratched dispose of it and the worm, and repeat step 4. If the worm is harmed in the transfer, dispose of it and rinse the cuvette with distilled water before repeating step 4 using the same cuvette.
- Repeat step 5 using the OH7547 "Roller" strain, being careful to label the data to indicate the worm strain.
6. Fourier Spectrum of Data
- Import the data acquired into a data analysis program capable of performing Discrete Fourier transforms3.
- Perform Fourier transforms on each data set using the fast Fourier transform (FFT) option of the software.
- Average the frequencies from the FFT results for each amplitude for the N2 wild type worms.
- Repeat step 6.3 using the FFTs from the OH7547 "roller" worms.
7. Modeling of the Fourier Spectrum
- Program a binary model of the nematode locomotion (see program included in the supplemental materials).
NOTE: This model is a rough approximation, which at first displays the prominent characteristics of worm motion. The model can be refined as the outcomes are compared with actual worms. Worm shapes are approximations using microscope images13.- Create sequential frames of the binary model moving through at least two worm cycles (Figure 2a). See the videos in the supplemental materials; C Worm video (CWorm.avi) and W Worm video (WWorm.avi).
- Produce sequential diffraction patterns. See the videos in the supplemental materials. C Worm Diffraction video (CWormDiff.avi) and W Worm video (WWormDiff.avi).
- Fourier transform each binary frame of the worm image. The larger the padding of the frame around the worm, the better the resolution of the diffraction image will be.
NOTE: The absolute value of each Fourier transformed frame is proportional to the corresponding diffraction pattern (Figure 2b). - Tune the contrast of the diffraction pattern by mapping the intensities of the diffraction pattern to a logarithmic scale.
NOTE: Cameras and eyes tend to function on a non-linear scale. A logarithmic scale can simulate how a diffraction pattern is typically perceived by the human eye.
- Fourier transform each binary frame of the worm image. The larger the padding of the frame around the worm, the better the resolution of the diffraction image will be.
- Extract the modeled diffraction signal.
- Pick an off-center location that corresponds to the location of the photodiode in the diffraction pattern.
- Add the neighboring matrix elements surrounding the location of the photodiode to simulate the size of the photodiode. The size of the photodiode is typically 0.1% of the modeled diffraction pattern.
- Record and plot the sequence of the magnitude of the diffraction signals. Check that the signal is physically reasonable (i.e., in the case of periodic thrashing, the signal from the photodiode should be periodic as well).
- Fourier transform the diffraction signal obtained in 7.3 and compare results with the experimental data.
- Repeat for various worm strains and compare.
Results
The optical experimental setup shown in Figure 1 allows for the study of microorganisms without being tied to a focal plane. The thrashing signal from the photodiode can be observed in real time on the computer screen as the data is collected. Unusual patterns will be visible immediately without having to analyze a video in detail.
Examples of modeled sequential worm movement and corresponding diffraction patterns are shown in Figure 2. The modeled diffraction patterns qualitatively resemble experimental patterns1 and are an initial indication that the simulations successfully model the nematode.
A sample temporal diffraction signature of the two types of C. elegans studied here is shown in Figure 3. It can be seen qualitatively that each nematode thrashes at different rates and amplitudes. Some of the differences can be quantified through curve fitting as was done in a previous publication1. The discrete Fourier transform, however, reveals more details regarding embedded frequencies:
 , (1)
, (1)
where Fk is the digital Fourier transform (FT) and fn is the time-dependent raw diffraction signal with the discrete time variable n and the discrete frequency variable k. N is the total number of data points. The average digital Fourier transform allows for the nematode to be identified by amplitude of its diffraction frequency spectrum (Figure 4). The wild type spectrum is dominated by lower frequencies than the roller motion spectrum.
A model that approximates the wild type versus the roller C. elegans notes the wild type tends to thrash in a wavelike (W or S shape) motion (Figure 2a) while the roller tends to favor one side that roughly resembles an oscillating C shape (Figure 5). This offers some explanation for the different spectra. The roller will mostly form a C to one side while the W oscillation can be thought of as two opposing C motions. For this reason, the W motion is more complex revealing more secondary low frequencies than the C motion. This result is confirmed in the computational model. The W shape has a much higher frequency density than the C shape (Figure 6). This is confirmed in the FFT in Figure 4 where the roller frequencies are more clustered while not completely discrete. The statistics of the roller are skewed since the roller can revert to wild type locomotion temporarily.
The smoothed power spectra of roller type C. elegans shows a broad peak at ~1.5 Hz, while the swimming wild type C. elegans exhibits a multimodal spectrum (including peaks at ~1.0 Hz and 1.75 Hz). The photodiode (PD) has a finite size spreading over several matrix elements. Individual matrix elements or points on the diffraction pattern vary in intensity since constructive and destructive interference varies; nevertheless, the frequencies at which the intensities vary are the same for all matrix elements, as can be seen in Figure 7. Considering the time derivative Eq. 1, it can be seen that the frequency fluctuations do not depend on the phase matrix but only on the original object's fluctuations:
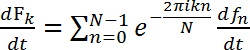 , (2)
, (2)
As the PD spreads over several matrix elements, the peak locations average to a consistent frequency profile. Some variation can be expected and can give clues about the orientation of the worm. The frequency distribution will change as the gait of the worm changes. The current model is a simple model that only allows for the evaluation of peak locations rather than relative peak heights. Different locomotory patterns will average to different peak locations.
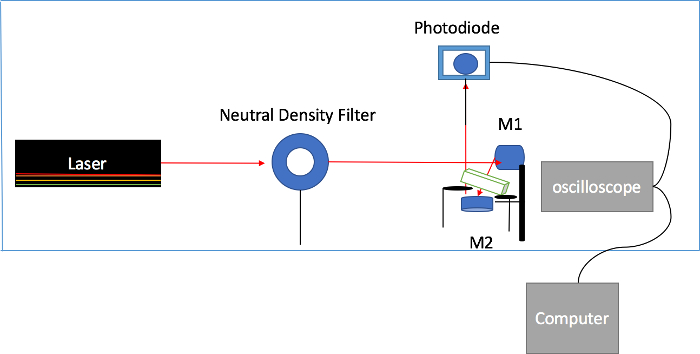
Figure 1. Experimental Setup. The low power laser beam travels through the neutral density filter, is reflected by mirror M1 down through the cuvette containing the worm onto mirror M2, and travels towards the photodiode. Please click here to view a larger version of this figure.
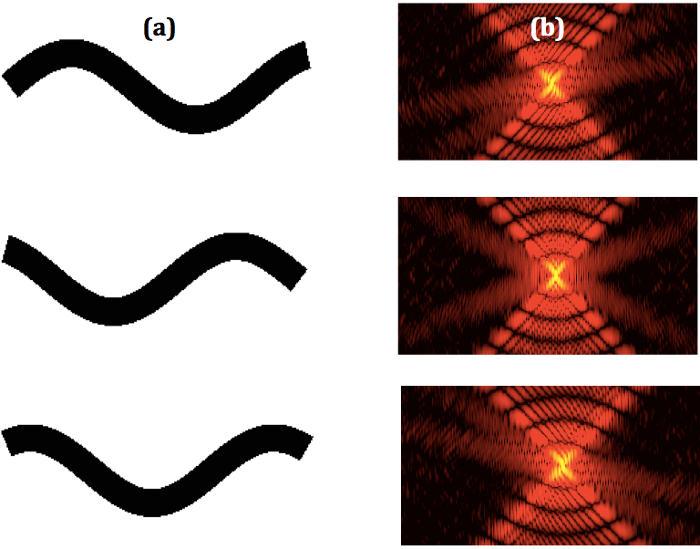
Figure 2. Sequential Worm Shapes and Corresponding Diffraction Patterns. (a) Some select sequential binary images of modeled W shape nematodes and the (b) corresponding sequential diffraction patterns. Please click here to view a larger version of this figure.
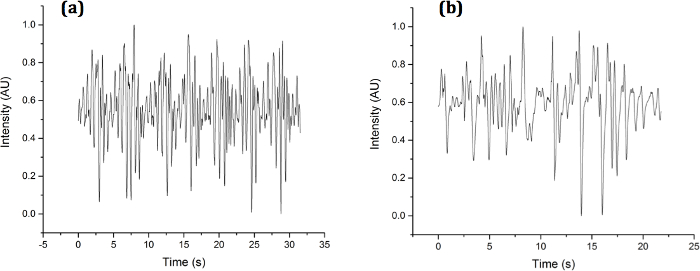
Figure 3. Experimental Sample Diffraction Signatures. Diffraction signatures collected for (a) OH7547 "roller" and (b) N2 wild type C. elegans using a single photodiode in the diffraction pattern. Please click here to view a larger version of this figure.
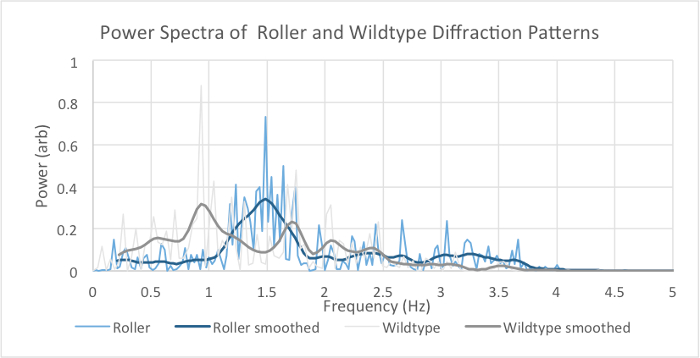
Figure 4. Experimental Averaged Power Spectra of Roller and Wild Type Fraunhofer Diffraction Series. The spectra show the frequencies present in averaged Fourier transform of the time series recorded with the photodiode. A Gaussian filter of standard deviation 0.075 Hz, truncated at 3 standard deviations, is used for smoothing. Note the broad spectral peak at ~1.5 Hz in the smoothed roller spectrum, compared with the multimodal smoothed wild type spectrum (including peaks at ~1.0 and 1.75 Hz). Please click here to view a larger version of this figure.
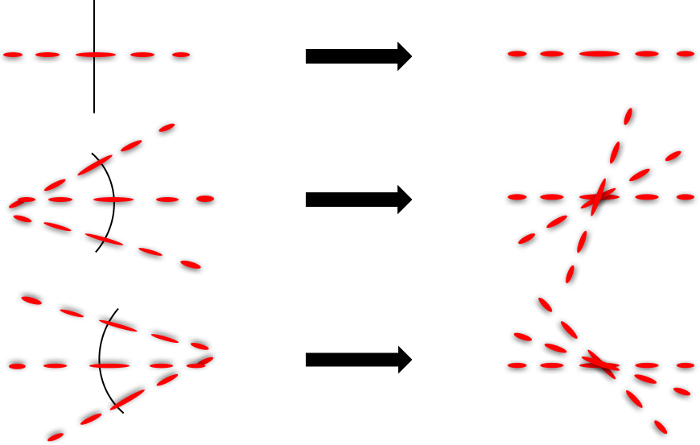
Figure 5. Diffraction Formation Illustration. Diffraction patterns can be modeled by thinking of each line segment as an infinitesimally small straight line (left). Superimposing these lines (right) demonstrates the construction of far-field diffraction patterns generated by a C shaped nematode. Please click here to view a larger version of this figure.
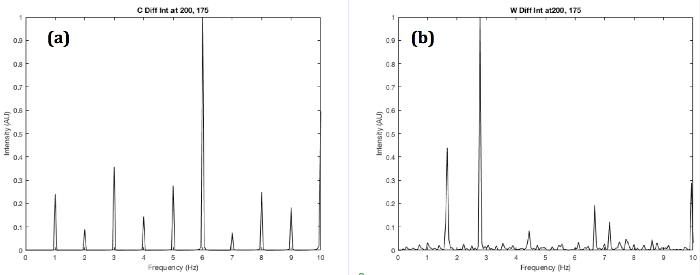
Figure 6. Simulated Power Spectra of Roller and Wild Type Fraunhofer Diffraction Series. (a) C shape and (b) W shape worms with the photodiode centered at the matrix elements 200 (vertical) and 175 (horizontal). The W shape shows a higher density of frequencies due to the more complex locomotion. Please click here to view a larger version of this figure.
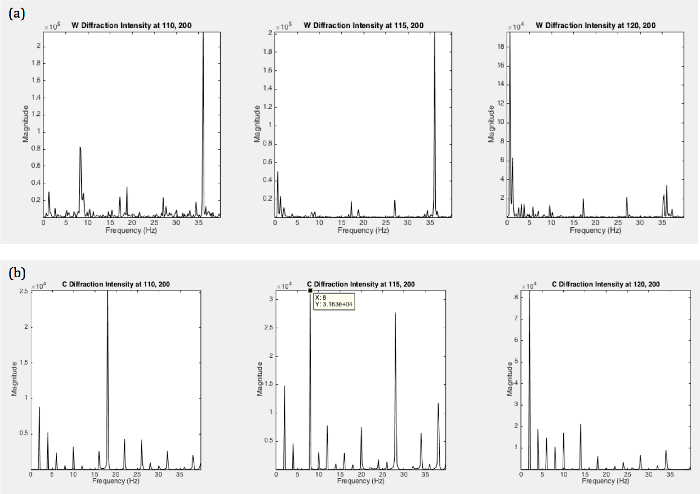
Figure 7. Simulated Power Spectra of Roller and Wild Type Fraunhofer Diffraction Series at Different Photodiode Locations. (a) W shape worm and the (b) C shape worm for single matrix elements at various locations simulating various locations of the photodiode. Peak heights vary for various locations; however, peak locations remain the same for specific shapes. Please click here to view a larger version of this figure.
Discussion
Including stretches of data with inactivity will skew the results since artificial lower frequencies will be averaged into the results. Saturating the photodiode can be recognized by flat peaks or "cut off" peaks in the raw data. Dividing each raw data set by peak intensities will help with accounting for fluctuations in the laser intensity.
The peak frequencies are an indicator of the overall thrashing frequency; however, complicated motion causes interference at beat frequencies in the diffraction pattern and need to be examined carefully.
This method can be used to investigate the locomotion of other nematodes. The environment can be changed to another medium. Wavelengths may be changed as well. Working in the visible range of the electromagnetic spectrum is easiest and safest.
A more refined model will simulate the diffraction spectra more realistically in the future. A future model may include a worm that can change orientations, which would not affect frequency locations but relative peak heights. A more realistic model would allow for a probabilistic distribution of thrashing frequencies, which would broaden the peaks as in the experimental data. A spread in frequencies would account for variations in thrashing frequencies.
The current worm shape is crude, especially in the head and tail region, which should be more tapered than in the current model. It may be interesting to conduct a detailed analysis of the time series of the signal since it could give clues about the complexity of the locomotion in different mutants.
It is worth considering the practicality of expanding this technique into characterizing multiple nematodes simultaneously. This method should be understood as a complementary method to existing methods using traditional microscopes. This method has an advantage in not requiring a microscope during the data-acquisition so that the worm may move out of the focal plane. The averaged frequency spectra show clear differences in worm motion and can be quantified by the prevalent frequency peaks, which is a novel method in quantifying worm locomotion. Data analysis of the diffraction signatures is in further development and will hopefully lead to an automated identification process of multiple mutants and individuals.
Disclosures
The authors have nothing to disclose.
Acknowledgements
We thank Juan Vasquez for his computational contributions with this project. We are grateful for the support of the Vassar College Undergraduate Research Summer Institute (URSI), the Lucy Maynard Salmon Research Fund and the NSF award No. 1058385.
Materials
| Name | Company | Catalog Number | Comments |
|---|---|---|---|
| Tunable Helium-Neon laser | Research Electro-Optics | 30602 | Four wavelengths can be selected between 543 nm and 633 nm. |
| 2 Front Surface Aluminum Mirrors | Thorlabs | PF10-03-F01 | |
| Photodiode: SI Amplified Detector | Thorlabs | PDA 100A | |
| Quartz Cuvette | Starna Cells | 21/G/5 | Plastic cells may be used as well. |
| MatLab (Software) | MathWorks | R2016b (9.1.0.441655) | Use the fft command to simulate diffraction |
| Excel | Microsoft | 14.7.1 | Used for data analysis of Figure 4 |
| Caenorhabditis elegans Roller | University of Minnesota Caenorhabditis elegans Center (CGC) | Strain: OH7547 Genotype: otIs199. | https://cbs.umn.edu/cgc/home |
| Caenorhabditis elegans Wild Type | University of Minnesota Caenorhabditis elegans Center (CGC) | Strain:N2 Genotype: C. elegans wild isolate | https://cbs.umn.edu/cgc/home |
References
- Magnes, J., et al. Analysis of Freely Swimming C. elegans Using Laser Diffraction. Open J. Biophys. 2, 101-107 (2012).
- Magnes, J., Raley-Susman, K. M., Eells, R. Quantitative Locomotion Study of Freely Swimming Micro-organisms Using Laser Diffraction. J. Vis. Exp. (68), (2012).
- James, J. F. A Student's Guide to Fourier Transforms with Applications in Physics and Engineering. , Cambridge University Press. Cambridge. (1995).
- Korta, J., Clark, D. A., Gabel, C. V., Mahadevan, L., Samuel, A. D. T. Mechanosensation and mechanical load modulate the locomotory gait of swimming C. elegans. J. Exp. Biol. 210, (2007).
- Martin-Garcia, J. M., Conrad, C. E., Coe, J., Roy-Chowdhury, S., Fromme, P. Serial femtosecond crystallography: A revolution in structural biology. Arch. Biochem. Biophys. 602, 32-47 (2016).
- Thibault, P., Rankenburg, I. C. Optical diffraction microscopy in a teaching laboratory. Amer. J. Phys. 75 (9), 827-832 (2007).
- Miao, J., Ishikawa, T., Anderson, E. H., Hodgson, K. O. Phase retrieval of diffraction patterns from non crystalline samples using the oversampling method. Phys. Rev. B. 67, 174104(2003).
- Zhang, Y. P., Zhang, J. Q., Xu, W. Method for eliminating zero-order diffraction in lensless Fourier transform digital holography. Optik - International Journal for Light and Electron Optics. 124 (21), 4873-4875 (2013).
- Brody, A. H., Chou, E., Gray, J. M., Pokrywka, N. J., Raley-Susman, K. M. Mancozeb-induced behavioral deficits precede structural neural degeneration. NeuroToxicology. 34, 74-81 (2013).
- Stiernagle, T. The C. elegans Research Community. Maintenance of C. elegans. WormBook. , (2006).
- Dasalukunte, D., Öwall, V., Rusek, F., Anderson, J. B. Faster than Nyquist Signaling. Algorithms to Silicon. , Springer International Publishing. Switzerland. (2014).
- Edwards, S. L., et al. A novel molecular solution for ultraviolet light detection in Caenorhabditis elegans. PLoS Biol. 6 (8), e198(2008).
- Bilbao, A., Wajnryb, E., Vanapalli, S. A., Blawzdziewicz, J. Nematode Locomotion in Confined and Unconfined Fluids. Phys. Fluids. 25, 081902(2013).
Reprints and Permissions
