This is a protocol to mimic Alzheimer's Disease in rats by evaluation of spatial memory impairment, neuronal pathological changes, neuronal amyloid beta protein (Aβ) burden, and neurofibrillary tangles aggregation, induced by the injection of Aβ25-35 combined with aluminum trichloride and recombinant human transforming growth factor-β1.
Method Article
Establishment of a Valuable Mimic of Alzheimer's Disease in Rat Animal Model by Intracerebroventricular Injection of Composited Amyloid Beta Protein
* These authors contributed equally
In This Article
Summary
Abstract
Alzheimer's disease (AD) is an irreversible, progressive brain disease that slowly destroys memory and is accompanied by neuron loss and structure change. With the increase of AD patients worldwide, the pathology and treatment of the disease has become a focus in the International Pharmaceutical Industry. Thus, the establishment of the animal model to mimic AD in the laboratory is of great importance.
Here, we describe a detailed protocol for establishing a mimic of AD in a rat animal model though intracerebroventricular injection of amyloid beta protein 25-35 (Aβ25-35) combined with aluminum trichloride (AlCl3) and anterodorsal thalamic nucleus injection of recombinant human transforming growth factor-β1 (RHTGF-β1) to rats. The related markers of AD were measured, including: spatial memory, neuronal structure and substructure, neuronal Aβ, and neurofibrillary tangles (NFT) production. This rat model demonstrates spatial memory impairment, neuronal structure and substructure pathological changes, neuron intracellular Aβ burden, and NFT aggregation, and provides a close mimic of the neuronal structure and function disorder to that of clinical AD patients. Thus, the presented AD rat modelprovides a valuable in vivo tool for exploring neuronal function, neuronal pathology, and drug screening of AD.
Introduction
It is well known that AD is a chronic and progressive neurodegenerative disease, with gradual memory loss as the main clinical syndrome. In the general pathology, there is nervous tissue atrophy, neuron and synapse loss, as well as neuronal subcellular structure and function disorders, which are all involved in the development and clinical manifestation of AD1,2. It is reported that when animals were intracerebroventricularly injected with Aβ, some neurotoxic events occur in the brain involving neuron loss, calcium homeostasis disruption, neuron apoptosis, and reactive oxygen species overproduction3. However, multiple factors are involved in the pathogenesis of AD and thus it is essential to establish a better model of AD.
A detailed protocol is described here for establishing an in vivo mimic AD model through intracerebroventricular injection of Aβ25-35 and AlCl3, combined with anterodorsal thalamic nucleus injection of RHTGF-β1 to rats. This rat modelhighly mimics human neuronal function and histopathogenesis of AD, including memory impairment, neuron loss and structure damage, apoptosis, intracellular Aβ burden, and NFT aggregation4,5,6,7,8,9. The AlCl3 prevents the deposited Aβ from forming soluble Aβ, and the RHTGF-β1 can promote deposited Aβ production and facilitate AD occurrence10. This attack from several factors to the neuron is in accordance with the multi-pathogenesis of AD.
The entire experiment spanned 86 days: Figure 1 shows a timeline of the experimental design, with the time point of animal surgery, animal model screening, animal spatial memory test, and sample preparation. On the first day of operation, RHTGF-β1 was microinjected into the anterodorsal thalamic nucleus. On the second day of operation, Aβ25-35 and AlCl3 were microinjected into the lateral ventricle daily for 14 consecutive days in the morning and 5 consecutive days in the afternoon, respectively. All rats were allowed to recover for 45 days after the operation. The Morris water maze was used to screen for successful model rats with memory impairment and to assess rats' spatial memory. The rats underwent 4 consecutive days of water maze training with 2 trials per day, and on day 4 of training, the rats were evaluated with the Morris water maze performance for memory impairment. All rats continued to be fed 37 days after the animal model screening. The spatial memory of rats was tested in the Morris water maze over 7 consecutive days, from day 79 to day 85 after the operation. All rats were sacrificed by decapitation on day 86 for brain sample preparation.
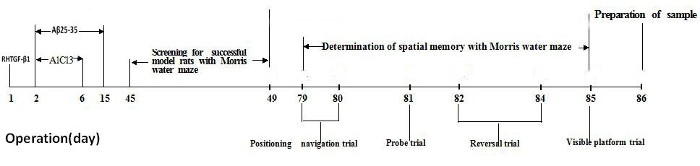
Figure 1. Timeline of the experimental design. Please click here to view a larger version of this figure.

Protocol
This procedure was in accordance with the Regulations of Experimental Animal Administration issued by the State Committee of Science and Technology of China on Oct. 31, 198811. Scientists should follow the guidelines established and approved by their institutional and national animal regulatory organizations.
NOTE: Animal and regents: Four-month-old male Sprague-Dawley rats (300-350 g) were supplied for this experiment. All rats were housed in groups (four or five per cage) at a temperature of 23 ± 1 °C with a 12-h light-dark cycle. Food and water were available ad libitum. The rats were acclimatized to the housing conditions for 7 days before the procedure was performed. Aβ25-35 was dissolved in 1% DMSO saline to 1 mg/mL, and sonicated for 5 min in an ultrasonic oscillator until completely dissolved. AlCl3 and RHTGF-β1 were dissolved in saline at 1% and 0.1 mg/mL, respectively. Congo red, silver nitrate, and other chemicals were of analytical grade and were purchased from ordinary commercial sources.
1. Surgical Procedure
Note: 20 male Sprague-Dawley rats were microinjected with composited Aβ into the lateral ventricle and anterodorsal thalamic nucleus, and designated as the composited Aβ-treated group. Another 20 rats were subjected to the same operation but received 0.1% DMSO saline microinjection, and designated as the sham-operated group.
- Anaesthetize the rats with 100% isoflurane by inhalation and then restrain on a Brain Stereotaxic Apparatus.
- Shave the fur on the vertex of the head with surgical scissors and disinfect with iodophor. Then, cover disposable surgical towel on the head.
- Make an incision on the head skin along the median longitudinal calvaria with surgical bistouries and scissors.
- Separate the subcutaneous tissue and fascia, wipe the skull calvarium with a sterile dry cotton for stopping the bleeding, and mark the bregma with a marker pen.
- Refer to the Rat Brain Stereotaxic Map12; considering the bregma as the point of origin, mark the three points, the anterodorsal thalamic nucleus (ad) (posterior (P): 2.0 mm to the bregma; lateral (L): 1.4 mm to the midline) for injecting RHTGF-β1 and fixing one screw, the lateral ventricle (LV) area (posterior (P): 0.8 mm to the bregma; lateral (L): 2.0 mm to the midline) for injecting Aβ25-35 and AlCl3, and the second screw fixing place (Front (F): 2.0 mm to the bregma; lateral (L): 1.5 mm to the midline).
- Gently drill three 1 mm diameter holes with a flexible bone drill, designated at the above three points of skull (1.5. step). Do not screw deeper than necessary to avoid stabbing the brain tissue.
- Stop the bleeding and clean the skull surface repeatedly with sterile dry cotton.
- Insert a needle linked to the micro-injection pump, to the brain at 4.6 mm depth and gently inject 1 μL RHTGF-β1 (10 ng) into the ad area. Stay needle 2 min after injection and slowly pull out the needle (Supplemental File 1).
- Fix the two screws into the skull, designated in the points of ad and the second screw fixing place of skull (which were designated at 1.5. step) with a small screwdriver. Do not screw deeper than necessary to avoid stabbing the brain tissue.
- Assemble the cannula implantation system (Supplemental File 2), Insert the dummy cannula into the guide cannula after disinfection by high pressure.
- Insert the stainless-steel tubing guide cannula to the brain at 4.6 mm into LV area through the skull hole (Supplemental File 3), with the help of cannula holder of rats’ stereotaxic apparatus.
- Mix the denture base material with denture base water at ratio of 1.5 g per 1 mL, put the paste to cover the guide cannula plastic pedestal and two screws for immobilizing the guide cannula and till cover the whole skin incision for avoiding the skin infection.
- On day 2 of the operation, anaesthetize the rats with isoflurane inhalation using the Small Animal Anesthesia Machine. Draw out the dummy cannula, insert the internal cannula into the guide cannula, and screw the fixing screw to immobilize the internal cannula.
- Set the polyethylene pipe that links the microinjection pump to the internal cannula and regulate the injection speed to 1 μL/min. Microinject the Aβ25-35 or AlCl3 to the LV.
- Microinject 4 μg (1 μL) Aβ25-35 daily for 14 days in the morning and 3 μL AlCl3 (1%) daily for 5 days in the afternoon under isoflurane anesthesia.
- Wait 5 min after finishing the injection, gently draw out the internal cannula and insert the dummy cannula again into the guide cannula.
- On day 15 post surgery (which corresponds to the last injection day of Aβ25-35) dismantle the cannula implantation system. Gently remove the denture base material solid with surgical scissors and forceps, unscrew the two screws, pull out the guide cannula, and disinfect the wound with betadine. Fill in the hole of the skull with bone cement and suture the skin with a simple interrupted suture method.
- Perform the same operation with the sham-operated group and microinject 0.1% DMSO saline.
- Postoperative nursing
- House 2 rats per cage after operation and provide food for 30 days.
Note: 18 rats in the sham-operated group survived (90% success rate of operation), and 19 rats in the composited-treated Aβ group survived (95% success rate of operation).
- House 2 rats per cage after operation and provide food for 30 days.
2. Screening for Successful Model Rats and Assessment of Spatial Memory with Morris Water Maze
- Morris water maze
Note: The Morris water maze was used to assess rat spatial memory13. The Morris water maze is a stainless-steel circular tank with 120 cm diameter and 50 cm depth. The water maze test was performed, based on the "gold standards" paradigm described in Behavioral Neuroscience by J. Nunez14.- Blacken the pool water with several drops of food coloring.
- Maintain the depth of water at 31.5 cm and the temperature at 23 ± 1 °C.
- Set a 1.5 cm circular transparent plexiglass platform below the water surface.
- Maintain that all spatial signals around the water maze are invariable during the water maze tests.
- Divide the pool into 4 equal quadrants by imaginary lines for descriptive data collection.
- Place the hidden platform in the first quadrant (Q1) of water maze.
- Capture the rat swimming behaviors (measured by latency, trajectory, or crossing number) through a video camera, over the water maze linked to a computer-based graphics analytic software.
- Screening for successful model rats to the composited Aβ-treated group
- On day 45 of surgery, perform the Morris water maze training for 4 consecutive days to screen for successful model rats with memory impairment and collect the screening ratio (SR).
Note: The SR is defined as the average latency of each composited Aβ-treated rat and the sham-operated group of rats to find the hidden platform under the water surface on day 4 of water maze training. “A” is the average latency of each composited Aβ-treated rat to find the hidden platform and “B” is the average latency of the sham-operated group of rats to find the hidden platform, on day 4 of water maze training, in the following equation:

When SR was larger than 0.2 for one composited Aβ-treated rat, the rat was regarded as a successful model rat with impaired memory of composited Aβ-treated rat15. The intraday memory performance was calculated to the data of 2 trials by the average value of rats to find the hidden platform. The process of the Morris water maze test was designed such that the rats were permitted to swim in the water maze tank and search for the hidden platform within 60 s. If a rat did not find out the hidden platform within 60 s, then the rat was put on the platform with hand of experimenter. When a rat reached on the hidden platform (independently or assisted), the rat was let stay there for 20 s. Then, the rat was removed from the tank and allowed a physical recovery for 10 s between the 2 trials.
- On day 45 of surgery, perform the Morris water maze training for 4 consecutive days to screen for successful model rats with memory impairment and collect the screening ratio (SR).
3. Neuron examination
- On day 86 post surgery, under isoflurane anesthesia, euthanize the rats by decapitation (Figure 1).
- Put the brain on ice and gently separate the two hemispheres at the raphe. Take the left hemisphere of the optic chiasma and fix in 4% formaldehyde for light microcopy observation of neuron hematoxylin and eosin (HE), Congo red, or silver nitrate stain (see Sections 4-6). Fix the right hemisphere hippocampus CA1 area in 2.5% glutaraldehyde for electron microcopy observation (Section 7).
- Process the brain for the light/electron microcopy sample preparation, as previously described16,17.
4. Neuron HE Staining
- Deparaffinize each slide (20 min each) with gradient alcohol (100%, 95%, 90%, 80%, and 70% alcohol) to distilled water in a fume hood.
- Stain for 3 min with hematoxylin (0.5% w/v), and then rinse with tap water to remove the unbound dye from slides.
- Rinse with 0.1% hydrochloric acid in alcohol for 1 s to remove the color of unstained nuclei.
- Immerse in 0.5% ammonia solution for 2 min until the background turns light blue.
- Stain for 1 min with 1% eosin.
- Dehydrate for 5 min with gradient alcohol (70%, 80%, 90%, 95%, and 100% alcohol).
- Clear in xylene and mount with resinous mounting medium.
- Observe and count the living neurons of the HE stain per 0.125 mm in the middle CA1 of the hippocampus and per 0.0352 mm2 in the cerebral cortex at a magnification of 400x with an optical microscope by a person blinded to the experimental design.
5. Congo Red Staining for Assaying Neuron Aβ Burden
- Deparaffinize each slide (20 min) with gradient alcohol (100%, 95%, 90%, 80%, and 70% alcohol) to distilled water in a fume hood.
- Stain for 20 min with Congo red working solution (0.5 g Congo red, 80 mL methyl alcohol, 20 mL glycerinum).
- Rinse in distilled water for 5 min.
- Differentiate quickly with alkaline 80% alcohol solution (0.2 g alcohol/100 mL potassium hydroxide) for 3 s.
- Rinse twice, each for 5 min with distilled water.
- Counterstain in Gill's hematoxylin for 3 min.
- Rinse in tap water for 2 min.
- Dip in ammonia water (add a few drops of ammonium hydroxide to tap water and mix well) for 30 s or until the sections turn blue.
- Rinse in tap water for 5 min.
- Dehydrate with gradient alcohol (70%, 80%, 90%, 95%, and 100% alcohol).
- Clear in xylene and mount with resinous mounting medium.
- Observe and count the cells stained with Congo red at a magnification of 400x, with an optical microscope by a person blinded to the experimental design.
6. Silver Nitrate Staining for Assaying Neuron NFT Formation
- Deparaffinize each slide (20 min) with gradient alcohol (100%, 95%, 90%, 80%, and 70% alcohol) to distilled water in a fume hood.
- Immerse in 20% silver nitrate solution and capping agent for 20 min in the dark.
- Wash in distilled water twice, 5 min for each time.
- Immerse in silver ammonia solution. Drop ammonia solution into 20% silver nitrate solution, and add until the solution goes from turbidity to clarification. Simultaneously, stir the solution with a glass rod for 15 min and then put into the 1% diluted ammonium hydroxide for 2 min.
- Place the slide into the developing working solution for 3-7 min until the black block in the axon can be observed.
- Immerse in the 0.1% diluted ammonia solution for 1 min and then rinse with water for 1 min.
- Dispose with 5% sodium thiosulfate for 2 min and then rinse with water for 5 min.
- Dehydrate with gradient alcohol (70%, 80%, 90%, 95%, and 100% alcohol).
- Clear in xylene and mount with resinous mounting medium.
- Observe and record the cell for silver nitrate stain at a magnification of 400x with an optical microscope by a person blinded to the experimental design.
7. Hippocampal Neuron Ultrastructure Measurement
- Cut the rat hippocampus CA1 into several cubes (1 x 1 x 1 mm3) and place in 2.5% glutaraldehyde for 2 h at 4 °C.
- Rinse the cubes with PBS three times (pH 7.2, 10 min for each time).
- Fix the cubes in 1% osmic acid for 2 h at 4 °C.
- Rinse the cubes in double distilled water 3x (10 min for each time).
- Dehydrate with gradient alcohol 50%, 70%, and 90% (10 min for each), 100% two times (15 min for each time).
- Replace by propylene oxide two times (15 min for each time), propylene oxide:resin at 1:1 (60 min for each time at room temperature), and propylene oxide:resin 1:4 (60 min for each time at room temperature). Soak in resin (120 min, at room temperature).
- Embed in EPON 812 and polymerize (5 h/35 °C, 5 h/60 °C, 5 h/80 °C).
- Cut the semithin sections (1 µm), stain by methylene blue, and localize under the microscope.
- Stain the ultra-thin sections (50 nm) with uranyl-o-acetate and lead citrate.
- Examine under a JEM-1400 electron microscope and collect images.
Results
All data are presented as mean ± SEM. SAS/STAT package was used to calculate the statistical analysis. The group differences in latency to find the hidden platform in memory acquisition and memory re-learning test were analyzed by two-way analysis of variance (ANOVA) with repeated measures. The group differences in the probe trial and number of neurons were analyzed by one-way ANOVA followed by Duncan’s multiple-range test. p < 0.05 was considered statistically significant18.
Screening for Successful Model Rats with Memory Impairment for the Composited Aβ-treated Group:
The results in Figure 2AA1 and 2AA2 show that the sham-operated group of rats always swam freely and the composited Aβ-treated group rats (Figure 2AB1, AB2) always swam around the pool perimeter in adaptive swimming in the Morris water maze. Over the 4 days of screening for memory impairment model rats, all rats had progressively declining times to find the hidden platform (latency) (Figure 2B). On day 4 of Morris water maze training, if the SR was more than 0.2 (which was based on the latency of each composited Aβ-treated rat and the sham-operated group of rats for finding the hidden platform), then the composited Aβ-treated rat was considered a successful model rat with memory impairment. 18 of the 19 rats (94.70%) that survived the operation passed the successful model screening. 6 rats of each group were chosen for the following experiments.

Figure 2. Screening for successful model rats with memory impairment in the composited Aβ-treated group using the Morris water maze training. (A) The adaptive swimming trajectory of rats in the Morris water maze. (AA1-AA2) Sham-operated group; (AB1-AB2) Composited Aβ-treated group. (B) Mean latency to find the hidden platform for 4 consecutive days of the screening trial in the Morris water maze training for the sham-operated group and the composited Aβ-treated group. Figure has been modified from Reference 4. Please click here to view a larger version of this figure.

Composited Aβ Caused Rat Memory Acquisition and Memory Re-learning Impairments:
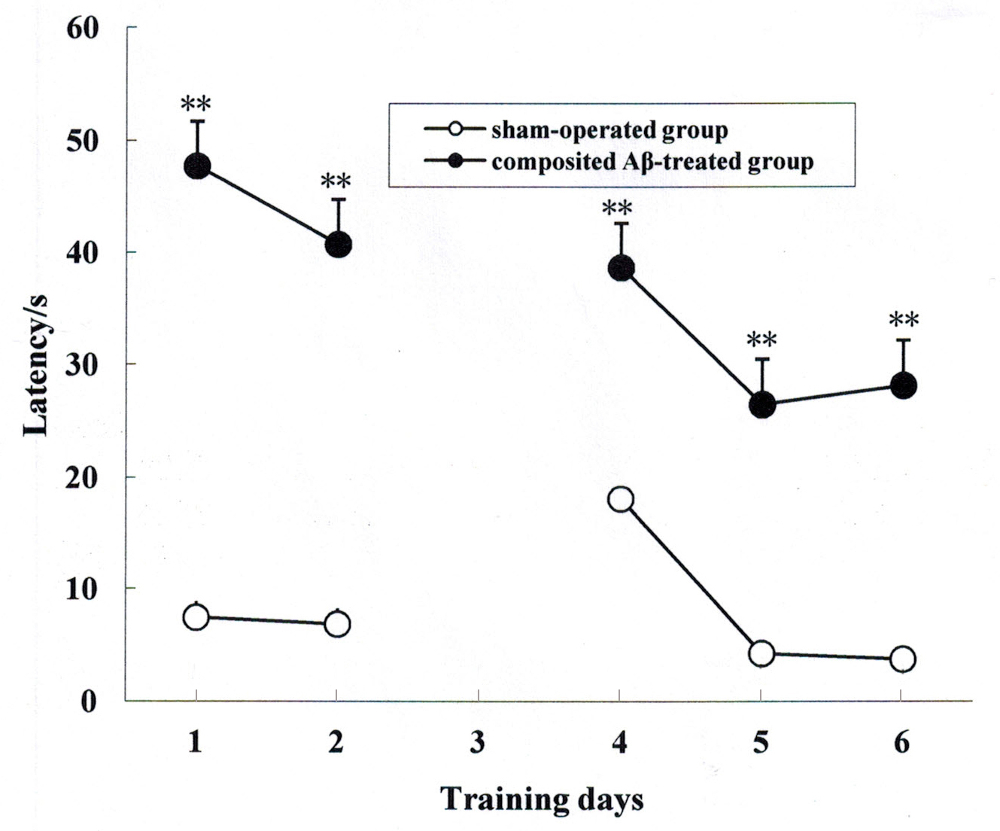
The rat memory acquisition was determined by the positioning navigation trial on day 1 and 2 of the Morris water maze test, which corresponded to day 79 and 80 post surgery. During the 2 days of the memory acquisition trial, all rats exhibited progressively declining latency to find the hidden platform. As shown in Figure 3, the latencies of the composited Aβ-treated group for finding the hidden platform were 360.67% and 558.28% (F (1, 5) = 238.67, p < 0.01) greater than those of the sham-operated group on day 1 and 2 of the Morris water maze test, respectively. This indicates that the composited Aβ can induce memory acquisition impairment in rats.
The rat memory re-learning was assayed by the reversal trial on day 4, 5, and 6 of the Morris water maze test, which corresponded to day 82, 83, and 84 post surgery. As shown in Figure 3, the latencies of the composited Aβ-treated group for finding the hidden platform were 306.20%, 650.16%, and 936.92% longer time than those of the sham-operated group (F (1, 5) = 138.76, p < 0.01). This demonstrates that the composited Aβ can elevate the memory re-learning impairment in rats (Figure 3).
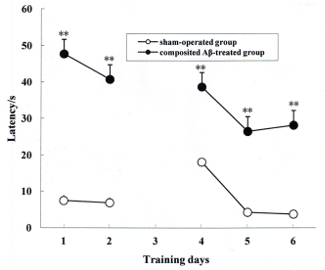
Figure 3. Composited Aβ caused rat memory acquisition and memory re-learning impairments. The positioning navigation trial was used to evaluate memory acquisition by 2 consecutive days swimming achievement on day 1 and 2 in the Morris water maze test. These were performed on day 79 and 80 post surgery. The reversal trial was used to evaluate memory re-learning by 3 consecutive days swimming score on day 4, 5, and 6 in the Morris water maze test, which corresponded to day 82, 83, and 84 of the operation. The line graph plots show the mean latency to find the hidden platform for each group on day 1, 2, 4, 5, and 6 in the Morris water maze test. Data were analyzed by two-way ANOVA (day x group) with repeated measures. Mean ± SEM. n = 6. **p < 0.01, vs. Sham-operated group. Figure has been modified from Reference 4. Please click here to view a larger version of this figure.
Composited Aβ Caused Rat Memory Retention Impairment:
The rat memory retention was measured by probe trial on day 3 of the Morris water maze test, which corresponded to day 81 post surgery. In the 1 day memory retention trial, the composited Aβ-treated group took less swimming time, swimming distance, and crossing number in Q1 within 60 s, which corresponded to 32.14%, 30.11%, and 78.95% (p < 0.01), respectively, than those of the sham-operated group (Figure 4A, 4B). These results show that the composited Aβ can produce memory retention impairment in rats.
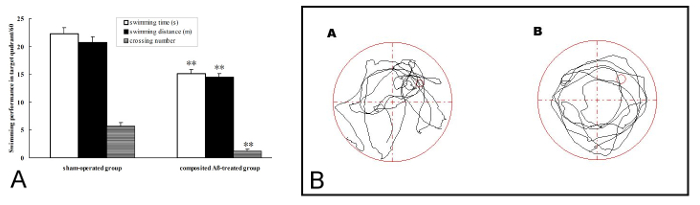
Figure 4. Composited Aβ produced rat memory retention impairment. The probe trial was used to evaluate memory retention by 1 day swimming achievement on day 3 in the Morris water maze test, which was conducted on day 81 post surgery. (A) Swimming time, swimming distance, and crossing number in Q1 within 60 s in the probe trial (no platform). Data were analyzed by one-way ANOVA with the multiple-range test. Mean ± SEM. n = 6. **p < 0.01, vs. the Sham-operated group. (B) The swimming trajectory of rats in the probe trial. (A) Sham-operated group, showing greater swimming time and distance in the target quadrant (Q1). (B) Composited Aβ-treated group, showing less swimming time and distance in target quadrant (Q1). Figure has been modified from Reference 4. Please click here to view a larger version of this figure.
Composited Aβ Influenced Rat Swimming Speed:
The rat swimming speed was calculated by the visible platform trial on the day 7 of Morris water maze test, which corresponded to day 85 post surgery. The rat swimming speed, based on the calculation of swimming distance and time to step on the platform, of each group in the pool was not significantly different. Therefore, the individual differences in rat swimming speed could be excluded, which indicates that motivation and motor skills were essentially intact in all rats (Figure 5).
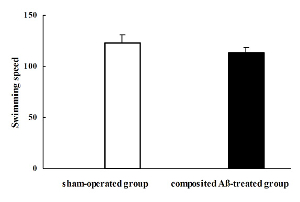
Figure 5. Composited Aβ influenced rat swimming speed. The rat swimming speed was calculated by the visible platform trial on day 7 of the Morris water maze test, which was conducted on day 85 after the operation. The rat swimming speed of each group was not significantly different. Data were analyzed by one-way ANOVA with the multiple-range test. Mean ± SEM. n = 6. Figure has been modified from Reference 4. Please click here to view a larger version of this figure.
Composited Aβ Caused Rat Neuronal Morphological Change:
All rats were killed by decapitation on day 86 of surgery. The visual inspection found that a yellow surface or a thin or collapsed cerebral cortex appeared in several composited Aβ-treated rats. Compared with the sham-operated group (Figure 6AA2), optical microscopy observation of the composited Aβ-treated group by HE stained, found hippocampal neuron pathological changes, such as neurofibrillary degeneration, neuronophagia, nuclear pyknosis, and nuclear margination (Figure 6AB2). Besides, the part of the cerebral cortex in the composited Aβ-treated group revealed typical colliquative necrosis, which was characterized by disrupted cell membranes, fragmented nuclei, and extensive inflammatory cells infiltration in the necrotic region (Figure 6AB3). This indicates that the composited Aβ may result in neuronal structural pathological injuries in rats.
In addition to pathological changes of neuronal structure, compared with the sham-operated group, the neuron count was also significantly decreased in the hippocampus and cerebral cortex (except for the colliquative necrosis sample) of the composited Aβ-treated group. The neuron number was 63.86% (p < 0.01) lower than that of sham-operated group in hippocampal CA1 sections of 0.125 mm, and 55.46% (p < 0.01) lower in cerebral cortex sections of 0.0352 mm2 (Figure 6B), which suggests that the composited Aβ can result in a decreased neuron count.
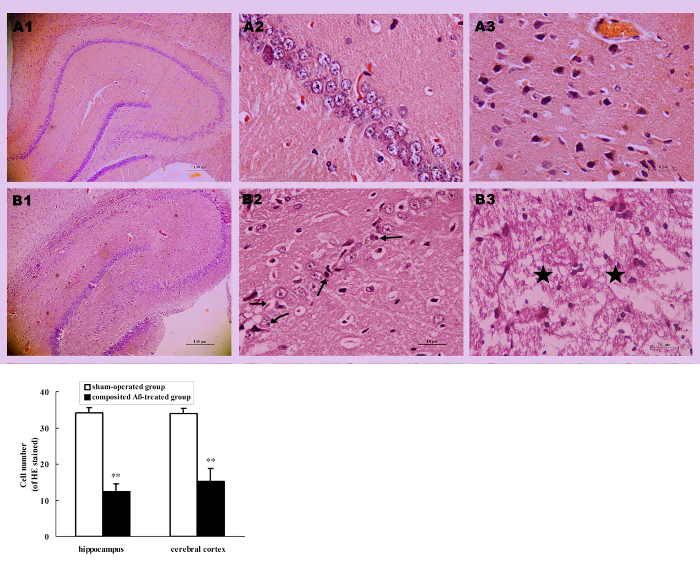
Figure 6. Composited Aβ caused rat neuronal morphological change. (A) Representative images of hippocampal and cerebral cortical neurons stained with HE. (A1-B1) Hippocampus 40x; (A2-B2) Hippocampus CA1 400x; (A3-B3) Cerebral cortex 400x. (A1-A3) Sham-operated group; (B1-B3) Composited Aβ-treated group; shows neuron marked loss, neurofibrillary degeneration (→), neuronophagia (←), nuclear pyknosis (↗), nuclear margination (↙) in hippocampus, typical colliquative necrosis (★), disrupted cellular membranes, large numbers of inflammatory cells infiltrated in the cerebral cortex in part of the composited Aβ-treated group. Scale bar of A1, B1 = 10 µm; Scale bar of A2, B2, A3, B3 = 100 µm. (B) Numbers of neurons with HE stain in the hippocampus and cerebral cortex, which were counted under a light microscope (400x). Each volume represents mean ± SEM from 9 visual fields of 3 independent samples (n = 3). **p < 0.01, vs. Sham-operated group. Figure has been modified from Reference 4. Please click here to view a larger version of this figure.
The electron microscopy observed the subcellular ultrastructure of hippocampus neurons. The substructure of hippocampal neurons in the composited Aβ-treated group (Figure 7B1–B4) were significantly destroyed, showing mitochondrial swelling and cristae breakage, increased mitochondrial electron density, dilated rough endoplasmic reticulum, depolymerized polyribosomes and polymicrotubules, some postsynaptic density (PSD), many secondary lysosomes, and lipofuscin sediment in cytoplasm, as compared to the sham-operated group (Figure 7A1–A4). The nuclear membrane was crude and sunken, the euchromatin was condensed and denatured, the myelin sheath layers were loose or degeneration, and internal axons and fibers were attenuated. These results demonstrate that the composited Aβ can produce neuron sub-structure damage in rats.
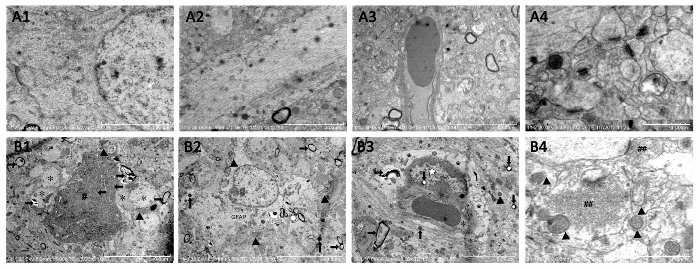
Figure 7. Subcellular structure of hippocampal neuron assessed by electron microscopic observation. A1-A4: Sham-operated group. Scale bar of A1 = 4 µm, 12,000x; Scale bar of A2 = 3 µm, 15,000x; Scale bar of A3 = 5 µm, 10,000x; Scale bar of A4 = 1 µm, 35,000x. (B1-B4) Composited Aβ-treated group. (B1) Neuron and nuclear pyknosis (←), euchromatin condensation or degeneration (#), astrocyte foot swell (*), high electron density mitochondria (▲), myelin sheath layers loose or attenuation (→); (B2) Greater GFAP, high electron density mitochondria (▲), myelin sheath layers loose or attenuation (), greater secondary lysosomes (↑), pericytes pyknosis, pericytes euchromatin condensation or degeneration (☆), astrocyte foot swell (*), high electron density mitochondria (▲), more lipofuscin (↓), myelin sheath layers loose or attenuation (→). B4: more excitatory neurotransmitter (##), high electron density or injury membrane mitochondria (▲), less synapsis. Scale bar of B1, B2 = 10 µm, 5,000x; Scale bar of B3 = 5 µm, 8,000x; Scale bar of B4 = 1 µm, 40,000x. Figure has been modified from Reference 4. Please click here to view a larger version of this figure.
Composited Aβ Caused Aβ Burden in Rat Neurons:
Congo red staining was used to detect the Aβ burden on neurons. The results show that the composited Aβ can notably induce the intracellular Aβ burden in the rat hippocampus and cerebral cortex (Figure 8A). The positive number of cells with Aβ red stained by Congo red in the hippocampus and cerebral cortex of the composited Aβ-treated group are 8.05- and 4.09-fold (p < 0.01) greater than those of the sham-operated group (Figure 8B). This demonstrates that composited Aβ can increase neuron Aβ burden in rats.
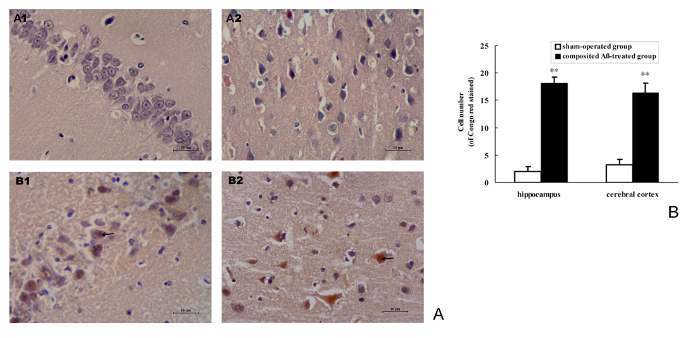
Figure 8. Composited Aβ caused Aβ burden in rat neurons. (A) Representative images of positive Aβ neuron stained by Congo red in the hippocampus and cerebral cortical.(A1-B1) Hippocampus CA1 400x; (A2-B2) Cerebral cortex 400x. (A1-A2) Sham-operated group; (B1-B2) Composited Aβ-treated group, shows more Aβ positive cells stained by Congo red. Scale bar = 10 µm, 400x. (B) Positive numbers of Aβ neurons stained by Congo red in the hippocampus and cerebral cortex, which were counted under a light microscope (400x). Each volume represents mean ± SEM from 9 visual fields of 3 independent samples (n = 3). **p < 0.01, vs. Sham-operated group. Please click here to view a larger version of this figure.
Composited Aβ Caused NFT Deposition in Rat Neurons:
Silver nitrate staining was used for detecting the NFT deposition in neurons. The results show that composited Aβ can noticeably cause the intracellular NFT deposition in the rat hippocampus and cerebral cortex (Figure 9A). The positive number of cells with NFT brown stained by silver nitrate in the hippocampus and cerebral cortex of the composited Aβ-treated group are 9.75- and 4.82-fold (p < 0.01) greater than those of the sham-operated group (Figure 9B). This demonstrates that the composited Aβ can increase the neuron NFT aggregation in rats.
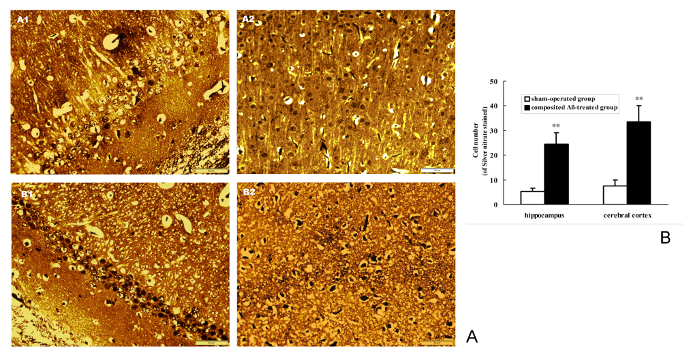
Figure 9. Composited Aβ caused NFT aggregation in rat neurons. (A) Representative images of positive NFT neurons stained by silver nitrate in hippocampus and cerebral cortex. (A1-B1) Hippocampus CA1 400x; (A2-B2) Cerebral cortex 400x. (A1-A2) Sham-operated group; (B1-B2) Composited Aβ-treated group. showing the more NFT positive cell stained by silver nitrate in composited-treated group. Scale bar = 10 µm, 400x. (B) Positive NFT neurons numbers of stained by silver nitrate in hippocampus and cerebral cortex, which were counted under a light microscope (400x). Each volume represents mean ± SEM from 9 visual fields of 3 independent samples (n = 3). **p < 0.01, vs. Sham-operated group. Please click here to view a larger version of this figure.
Discussion
It is well known that the loss of learning and memory are major clinical symptoms in AD patients2. The procedure described here is an in vivo method to study AD; we have adapted a previously published protocol that tested a medication to alleviate memory deficits and neuronal injuries in a rat model4. Our protocol provides important details to obtain valuable data, as well as a high survival rate of animals that successfully model operation, memory deficits, neuron injuries, Aβ burden, and NFT deposition, to mimic AD (in the present experiment, the survival rate and successful model rate of operation are more than 90%). These successful model rats were used to measure their spatial memory with the Morris water maze test. The positioning navigation trial found that the composited Aβ can cause rat memory acquisition impairment; the probe trial found that the composited Aβ can decrease rat memory retention; and the reversal trial found that the composited Aβ can result in rat re-learning impairment. These Morris water maze test data show that the composited Aβ can induce rat spatial memory. Overall, injecting rats intracerebroventricularly with Aβ25-35 in combination with AlCl3 and TGF-β1 created a feasible and credible in vivo AD-like animal model for the laboratory.
Previous studies have shown that the brain volume in AD patients is 10% less than that of healthy individuals. Various atrophies can be found in the cerebral hemisphere by visual observation. The degree of cortical atrophy is positively related to the memory impairment19. In the histology, the large number of neuron loss and severe morphological pathology directly disturb the memory function in AD patients20. In the present study, light/electron microscopic observation found that the rats microinjected with composited Aβ displayed dramatic neuropathological changes, including neuron loss, and neuronal and subcellular structure disruption. This result corroborates the rat spatial memory disorder induced by composited Aβ, and is similar to the state of AD patients.
It is well known that the brain Aβ burden and NFT aggregation are considered the most important histopathogenic traits in AD. They can destroy the neuronal structure, disturb the neural signaling, disrupt the neuronal function, and result in advanced dementia17. The present animal model found Aβ burden and NFT aggregation in brain, which agree with the AD patient state. Therefore, the present neuron injuries in rats induced by composited Aβ can be used as a model to study neuronal pathology and treatment strategy of AD.
The following are examples of screening drug effects in AD rat models: Zhao et al., reported that both flavonoids from Scutellaria stems and leaves (SSF) and Scutellaria barbata (SBF) can attenuate rat memory impairment and apoptosis induced by composited Aβ8,9. Guo et al., also reported that SBF can inhibit NFT aggregation and tau protein over-phosphorylation at Ser199, Ser214, Ser202, Ser404, and Thr231 side, and decrease GSK-3β, CDK5, and PKA protein and mRNA expression in composited Aβ-treated rats21. Simultaneously, Shang et al., have also reported that SBF can suppress the astrocyte and microglia proliferation, and lower Aβ1-40, Aβ1-42, and β-site APP cleaving enzyme 1 (BACE1) mRNA expression in the brain of composited Aβ rats22. Based on the above results, our animal model is advantageous over other AD-like model, which involve more neuronal function and structure disorder.
Concerning other AD-like model, single intracerebroventricular injection of Aβ to rats can cause rat memory deficits, neuron loss, and neurogliocyte proliferation, but may or may not have Aβ and NFT deposition23. Rats exposed to high dose Al appear to have a high success rate, mimic AD, and a cost-effective animal model, with memory impairment, neuron loss, neurogliocyte proliferation, and senile plaque (SP) and NFT aggregation in the brain. However, the high dose of Al may cause rat liver injuries and anorexia, accompanied with decreased weight24. The aged rat is another AD-like model. The aged rats demonstrate memory deficits, neuronal structure/substructure pathological changes, lipofuscin deposition, but without Aβ burden and NFT aggregation. Rats of more than 24 months of age are considered aged for this model, and therefore it requires a longer period of feeding and thus the cost is higher17,25. SAMP8 and APP transgenic mice are the closest mimic to AD and they are the most ideal models for investigating AD. But both animal models are higher priced and are limited to use in the laboratory26,27. Compared with the above animal models, our model of composited Aβ-treated animal model has a lower cost and high performance, making it an ideal tool for studying AD.
In conclusion, intracerebroventricular injection of Aβ25-35 combined with AlCl3 and TGF-β1 to rats offers a valuable in vivo animal model to better understand the spatial memory impairment, neuronal injuries, Aβ burden, and NFT deposition underlying AD. This model provides a fast and relatively simple experimental protocol with a high animal survive rate and high model successful rate of operation, as well as a high rate of duplication, which showed to be more economic. The present animal model is an effective model to mimic AD and can further validate itself by being used to mimic various other diseases.
Disclosures
The authors have nothing to disclose.
Acknowledgements
The project was supported by the Hebei Provincial Natural Science Foundation (No. C2009001007, H2014406048), the Hebei Provincial Administration of Traditional Chinese Medicine (No. 05027), and the Key Subject Construction Project of Hebei Provincial College, China.
Materials
| Name | Company | Catalog Number | Comments |
|---|---|---|---|
| Sprague-Dawley rat | Beijing Vital River Laboratory Animal Technology Co., Ltd, China | SCXK(Jing) 2012-0001 | 300–350 g |
| Morris water maze | Chinese Academy of Medical Sciences and Peking Union Medical Research Institute, China | No | |
| Movable small animal anesthesi | RWD Life Science Co., Ltd. China | R580 | |
| Brain Stereotaxic Apparatus | RWD Life Science Co., Ltd. China | 68001 | |
| Flexible bone drill | Shanghai Soft Long Technology Development Co., Ltd. China | BW-sD908 | |
| Transmission electron microscope | Japan Co., Ltd. Japan | JEM-1400 | |
| Two channel microinjection pump | RWD Life Science Co., Ltd. China | RWD202 | |
| EM microtome | Hitachi Co., Ltd. China | H-7650 | |
| Dummy cannula | RWD Life Science Co., Ltd. China | 62001 | 0.D.0.64×I.D.0.0.45mm/M3.5 http://www.rwdls.com/English/Product/3985102014.html |
| Guide cannula | RWD Life Science Co., Ltd. China | 62101 | 0.D.0.40mm/M3.5 |
| Internal cannula | RWD Life Science Co., Ltd. China | 62201 | 0.D.0.41×I.D.0.25mm/ M3.5 M3.5 |
| Tighten the nut | RWD Life Science Co., Ltd. China | 62501 | 0.D.5.5mm/L7.5mm/M3.5 |
| Fixing screw | RWD Life Science Co., Ltd. China | 62514 | M1.2×L2.0mm(100BAO) |
| The screwdriver | RWD Life Science Co., Ltd. China | 62999 | 45*1mm |
| PE Tubing | RWD Life Science Co., Ltd. China | 62302 | |
| Amyloid beta 25-35 | Sigma Aldrich Co. USA | SCP0002-5MG | |
| Recombinant human transforming growth factor-β1 | PeproTech Inc. USA | 100-21 | |
| Aluminium trichloride | Tianjin Kemiou Chemical Reagent Co., Ltd. China | 3011080 | |
| Congo red | Tianjin Kemiou Chemical Reagent Co., Ltd. China | 3010016 | |
| Silver nitrate | Sinopharm Chcmical Reagent Co., Ltd. China | 20150720 | |
| Denture base material | Shanghai New Century Dental Materials Co., Ltd. China | 20170609 |
References
- Robinson, M., Lee, B. Y., Hane, F. T. Recent Progress in Alzheimer's Disease Research, Part 2: Genetics and Epidemiology. J. Alzheimers. Dis. , (2017).
- Hane, F. T., Lee, B. Y., Leonenko, Z. Recent Progress in Alzheimer's Disease Research, Part 1: Pathology. J. Alzheimers Dis. , (2017).
- Perl, D. P. Neuropathology of Alzheimer's disease. Mt. Sinai. J. Med. 77, 32-42 (2010).
- Wu, X. G., Wang, S. S., Miao, H., Cheng, J. J., Zhang, S. F., Shang, Y. Z. Scutellaria barbata flavonoids alleviate memory deficits and neuronal injuries induced by composited Aβ in rats. Behav. Brain Funct. 12, 33-43 (2016).
- Guo, K., Wu, X. G., Miao, H., Cheng, J. J., Cui, Y. D., Shang, Y. Z. Regulation and mechanism of Scutellaria bartata flavonoids on apopotosis of cortical neurons and cytochondriome induced by composited Aβ. Chin Hosp Pharm J. 35, 1994-1999 (2015).
- Guo, K., Miao, H., Wang, S. S., Cheng, J. J., Shang, Y. Z. Scutellaria barbata flavonoids inhibits NFT aggregation and regulatory mechanism in rats induced by composited Aβ. Chin. J. Pathophysio. 32, 2147-2156 (2016).
- Hou, X. C., et al. Scutellaria Barbata flavonoids inhibit the brain's Aβ and NFT abnormal generation and affect the related enzymes expression in rats induced by composited Aβ. Chin J New Drugs. , Accepted (2017).
- Zhao, H. X., Guo, K., Cui, Y. D., Wu, X. G., Shang, Y. Z. Effect of Scutellaria barbata flavonoids on abnormal changes of Bcl-2, Bax, Bcl-xL and Bak protein expression in mitochondrial membrane induced by composite Aβ25-35. Chin J Pathophysiol. 30, 2262-2266 (2014).
- Cheng, J. J., et al. Flavonoid extract from Scutellaria stem and leaf attenuates composited Aβ- induced memory impairment and apoptosis in rats. Chin.J. New Drugs. 25, 2627-2636 (2016).
- Fang, F., Yan, Y., Feng, Z. H., Liu, X. Q., Wen, M., Huang, H. Study of Alzheimer's disease model induced multiple factors. Chongqing Med. 36, 146-151 (2007).
- Regulations for the Administration of Affairs Concerning Experimental Animals. The Ministry of Science and Technology of the People's Republic of China. , 10-31 (1988).
- Bao, X. M., Shu, S. Y. The stereotaxic atlas of the rat brain. , People's medical publishing house. (1991).
- Morris, R. Developments of a water-maze procedure for studying spatial learning in the rats. J. Neurosic. Methods. 11, 47-60 (1984).
- Nunez, J. Morris Water Maze Experiment. J. Vis. Exp. (19), e897(2008).
- Yu, J. C., Liu, C. Z., Zhang, X. Z., Han, J. X. Acupuncture improved cognitive impairment caused by multi-infarct dementia in rats. Physiol. & Behav. 86, 434-441 (2005).
- Shang, Y. Z., Miao, H., Cheng, J. J., Qi, J. M. Effects of amelioration of total flavonoids from stems and leaves of Scutellaria baicalensis Georgi on cognitive deficits, neuronal damage and free radicals disorder induced by cerebral ischemia in rats. Biol. Pharm. Bull. 29, 805-810 (2006).
- Song, H. R., Cheng, J. J., Miao, H. J., Shang, Y. Z. Scutellaria flavonoid supplementation reverses ageing-related cognitive impairment and neuronal changes in aged rats. Brain Inj. 23, 146-153 (2009).
- Wang, M., et al. Novel RAS inhibitors Poricoic Acid ZG and Poricoic Acid ZH attenuate renal fibrosis via a Wnt/β-Catenin patheway and targeted phosphorylation of smad3 signaling. J Agric Food Chem. 66, 1828-1842 (2018).
- Pini, L., et al. Brain atrophy in Alzheimer's Disease and aging. Ageing Res. Rev. 30, 25-48 (2016).
- Ubhi, K., Masliah, E. Alzheimer's disease: recent advances and future perspectives. J. Alzheimers Dis. 33, 85-94 (2013).
- Guo, K. Scutellaria barbata flavonoids inhibite NFTs aggregation, tau protein phosphorylation and the regulated mechanism of related enzymes in rats induced by composited Aβ. , Master's thesis (2016).
- Shang, Y. Z. Effects and Mechanism of Scutellaria Barbata Flavonoids on Rat's Memory Impairment Induced by Compound Aβ25-35. , Doctoral Thesis (2013).
- Zussy, C., et al. Alzheimer's disease related markers, cellular toxicity and behavioral deficits induced six weeks after oligomeric amyloid-β peptide injection in rats. PLoS One. 8, 1-20 (2013).
- Walton, J. R. Aluminum involvement in the progression of Alzheimer's disease. J. Alzheimers Dis. 35, 7-43 (2013).
- Neils-Strunjas, J., Groves-Wright, K., Mashima, P., Harnish, S. Dysgraphia in Alzheimer's disease: a review for clinical and research purposes. J. Speech Lang Hear Res. 49, 1313-1330 (2006).
- Morley, J. E., Farr, S. A., Kumar, V. B., Armbrecht, H. J. The SAMP8 mouse: a model to develop therapeutic interventions for Alzheimer's disease. Curr Pharm Des. 18, 1123-1130 (2012).
- Puzzo, D., Gulisano, W., Palmeri, A., Arancio, O. Rodent models for Alzheimer's disease drug discovery. Expert Opin Drug Discov. 10, 703-711 (2015).
Reprints and Permissions
