A clinical handheld photoacoustic imaging system will be demonstrated for real-time non-invasive small animal imaging.
Method Article
Hand-held Clinical Photoacoustic Imaging System for Real-time Non-invasive Small Animal Imaging
Opens in a new tab
In This Article
Summary
Loading...
$$\rightleftharpoonup{xx}$$
$$\longleftharp{xx}$$,
$$\longrightharp{xx}$$,
Abstract
Loading...
$$\rightleftharpoonup{xx}$$
$$\longleftharp{xx}$$,
$$\longrightharp{xx}$$,
Translation of photoacoustic imaging into the clinic is a major challenge. Handheld real-time clinical photoacoustic imaging systems are very rare. Here, we report a combined photoacoustic and clinical ultrasound imaging system by integrating an ultrasound probe with light delivery for small animal imaging. We demonstrate this by showing sentinel lymph node imaging in small animals along with minimally invasive real-time needle guidance. A clinical ultrasound platform with access to raw channel data allows the integration of photoacoustic imaging leading to a handheld real-time clinical photoacoustic imaging system. Methylene blue was used for sentinel lymph node imaging at 675 nm wavelength. Additionally, needle guidance with dual modal ultrasound and photoacoustic imaging was shown using the imaging system. Depth imaging of up to 1.5 cm was demonstrated with a 10 Hz laser at a photoacoustic imaging frame rate of 5 frames per second.
Introduction
Loading...
$$\rightleftharpoonup{xx}$$
$$\longleftharp{xx}$$,
$$\longrightharp{xx}$$,
For the detection and staging of cancer, different imaging techniques are available. Some of the widely used imaging modalities are magnetic resonance imaging (MRI), X-Ray computed tomography (CT), X-Ray, ultrasound (US), positron emission tomography (PET), fluorescence imaging, etc.1,2,3,4. But, some of the existing imaging techniques are either invasive, have harmful radiation, or are slow, expensive, bulky, or unfriendly to patients. Thus, there is a constant need to develop new, fast, and cost-effective imaging techniques for diagnostics and therapy5.
Photoacoustic imaging (PAI) is an emerging imaging technique, which combines rich optical contrast with high ultrasonic resolution at a deeper imaging depth5,6,7,8,9. In PAI, a short laser pulse is used for tissue irradiation. The light gets absorbed by the tissue which leads to a small temperature rise. Due to thermoelastic expansion, pressure waves (in the form of acoustic waves) are generated within the tissue. The generated acoustic waves (also known as photoacoustic (PA) waves) are acquired with a wideband ultrasound transducer (UST) outside the tissue boundary. These acquired PA signals can be used to reconstruct PA images, revealing the structural and functional information inside the tissue. PAI has a wide array of applications, including: blood vessel imaging, sentinel lymph node imaging, brain vasculature imaging, tumor imaging, molecular imaging, etc.10,11,12,13,14,15 PAI has numerous applications because of its advantages, namely: deeper penetration depth, good spatial resolution, and high soft tissue contrast. The contrast in PAI can be endogenous from blood, melanin, etc. When the endogenous contrast is not strong enough, exogenous contrast agents like organic dyes, nanoparticles, quantum dots, etc.16,17,18,19,20,21 can be used for improving the contrast.
Although PAI has numerous benefits relative to other imaging techniques, clinical translation is still a very big challenge. The main limitations are the bulky nature of the lasers being used, most of the USTs used for data acquisition are not compatible with clinical US systems, and the non-availability of commercially available clinical US imaging systems which give access to raw channel data. Only recently, commercial clinical US machines with access to raw data have become available22. In this work, we aim to demonstrate the feasibility of PAI with a handheld set-up using a clinical US platform. We aim to demonstrate this by showing non-invasive imaging of sentinel lymph nodes (SLNs) in a small animal model.
Invasive breast tumors are one of the leading causes of cancer death among women. Diagnosing and staging breast cancer early is vital for deciding treatment strategies, which play an important role in the prognosis of the patient. For breast cancer staging sentinel lymph node biopsies (SLNB) are usually used23,24. SLN is the primary lymph node where the possibility of finding cancer cells is the highest due to metastasis. SLNBs involve injecting a dye or a radioactive tracer, followed by cutting open the area with a small incision, and then locating the SLN visually in case of dyes or with the help of a Geiger counter, in case of a radioactive tracer. After identification, a few SLN are removed for histopathological studies24,25. Positive SLNB indicates that the tumor has metastasized to nearby lymph nodes and maybe to other organs. Negative SLNB indicates that the probability of metastasis is negligible26. SLNB has numerous complications associated with it like arm numbness, lymphedema, etc.27 To eliminate the SLNB associated complications, a non-invasive imaging technique is needed.
For SLN mapping in small animals and humans, PA imaging has been explored extensively with the help of different contrast agents15,28,29,30,31,32. However, the systems used currently cannot be used in a clinical scenario as pointed out earlier. Another concern to be addressed is the surgical procedure involved in SLNB28. Adapting minimally invasive procedures for fine needle aspiration biopsy (FNAB) was needed to reduce the recovery time and the side effects of the patients. In this work, a clinical US system was used for combined US and PA imaging was used. For ease of use in clinical setup, a custom made handheld holder for housing optical fiber and UST was designed. Methylene blue (MB) was used for identifying and mapping SLNs. Additionally, to eliminate the complications associated with the SLNB surgery, non-invasive real-time needle tracking is also demonstrated.
Access restricted. Please log in or start a trial to view this content.
Protocol
Loading...
$$\rightleftharpoonup{xx}$$
$$\longleftharp{xx}$$,
$$\longrightharp{xx}$$,
All animal experiments were performed according to the approved guidelines and regulations by the institutional Animal Care and Use committee of Nanyang Technological University, Singapore (Animal Protocol Number ARF-SBS/NIE-A0263).
1. Handheld Real-time Clinical PA and US Imaging System
- The schematic of the handheld clinical PAI system33 is shown in Figure 1a. It consists of a optical parametric oscillator (OPO) laser pumped by a frequency doubled nanosecond pulsed Nd:YAG pump laser, a bifurcated optical fiber bundle (Figure 1b), a custom-made 3D printed handheld probe holder (Figure 1c)33, clinical dual modal US and PA system, and a clinically compatible linear array UST (see Table of Materials).
- Run the software provided by the manufacturer in the clinical US system by clicking on the icon for the software from the desktop.
- From the touch screen, select the 'research' button to operate the US system in the research mode. Click on the combined US and PA imaging script from the list of scripts and click the run button for imaging in the combined mode.
- Synchronize the clinical US system with the laser using the laser trigger out or using a photodiode.
NOTE: Connect the fixed sync out from the laser to the US system sync in. Make sure to provide positive Transistor-transistor logic (TTL) signal as the sync signal. A photodiode signal can also be used for sync purpose. The US system sync in is connected to the photodiode detector using a photodiode bias module. Whenever the laser is ON, the photodiode gives a signal to trigger and sync both the laser and the US system. Perform this step every time. - To turn on the laser, switch on AC power, and turn the key to the left on the laser controller. Start the laser after ensuring the repetition rate is 10 Hz (F10 will be displayed on the display) and the Q-switch delay is as low as 170 µs to ensure low laser energy. To set the delay, press the select key till you see the delay value and increase it to 170.
NOTE: The laser takes approximately 20 min to warm up. - Open the software interface on a computer and in the goto menu enter the wavelength as 675 nm and press the 'start' button to set the wavelength at 675 nm.
NOTE: The laser can be tuned from 670 to 2,500 nm, however, it is unstable at 670 nm. - Press the shutter button and turn the laser on using the switch to align the laser beam to the fiber input.
- Using a 1 inch (2.5 cm) diameter plano-convex lens of focal length 15 mm, focus the laser beam to the fiber bundle such that all the light falls on the fiber input end.
NOTE: The optical fiber has 1,600 small fibers bundled together. It is bifurcated in the middle with two rectangular output ends which have 800 optical fibers each. The 800 fibers are packed into an area of 0.1 x 4 cm, to match with the dimensions of the UST. The core diameter of each optical fiber is 185 µm, with a numerical aperture of 0.22. - Switch OFF the laser after alignment.
- From the 4 probe holders with different angles of illumination (0°, 5°, 10°, and 15°) choose the appropriate probe holder based on the application (depth of imaging, size of the object, shape of the object, and location of the object).
NOTE: The probe holders were designed and 3D printed in the lab. It has three slots, two for the bifurcated optical fibers and the central one for the UST. The dimension of the probe holder was based on the dimensions of the optical fiber and the UST. Monte Carlo simulations were done to study the light illumination required for imaging SLNs at higher depth. SNR was higher at lower depths for an illumination of 15°33. - Fit the bifurcated optical fiber into the 3D printed probe holder at a light illumination angle of 15˚.
- Insert the UST into the center slot of the holder.
NOTE: Figure 1d shows the photograph of the probe holder with the optical fiber and UST. The linear array UST has 128 array elements. The center frequency of the UST is 8.5 MHz and the fractional bandwidth is 95%. The length of the UST is 3.85 cm. However, the system has only 64 parallel data-acquisition hardware and requires two laser pulses to collect data from all the 128 elements. Therefore, the effective frame rate of the system is half the pulse repetition rate of the laser, which is 5 frames per second34. - Adjust the distance between the UST and the fiber end to 1 cm by loosening the screws on the side and tighten it after adjusting the exact distance.
NOTE: The parameters are optimized for SLN imaging with simulation and phantom experiments33. The UST can be secured with the two screws on the probe holder. This gives the flexibility to vary the distance between the optical fiber and the UST. - Switch ON the laser and make sure to obtain a rectangular laser beam spot in front of the UST.
- Switch OFF the laser. Increase the laser energy (by increasing the delay) to the desired value for the imaging purpose.
NOTE: Refer to the manual for the maximum delay that can be set for the Nd:YAG laser. The desired delay value for this system for SLN imaging was set to 210.
2. Resolution Characterization
- Take the commercially available chicken tissue slab and cut it into a 6 x 6 cm2 slab. Using a knife cut it into 0.5 cm thick slices.
- Place a point object, like a 23 G needle of diameter 0.6 mm, on top of chicken breast tissue.
- Switch ON the laser.
Caution: Safety goggles should be worn when working with the laser for the remainder of the protocol. An exception was made during the alignment process, since the laser energy was weak. - Take PA images of the needle at different depths by stacking multiple chicken breast tissue slices of thickness 0.5 cm one-by-one up to 3 cm. Apply US gel between chicken breast tissue layers to improve US coupling.
- Save and store the beam-formed images as .mat file.
- Switch OFF the laser.
- Process the data with the in-house code using image processing software17.
NOTE: To determine the axial and lateral resolution, find the point-spread function from the normalized PA signals along the respective directions and fit them to a Gaussian distribution function17. Obtain the full width at half maximum.To obtain the point spread function, it is required to image a point. However, there is another way of obtaining a point spread function when imaging a point target is difficult (as in our case, for a very tiny point target the signal is quite small and therefore we use a slightly larger target). If the target is large, instead of directly getting the point spread function, one can obtain an edge spread function. Then by taking the first derivative of the edge spread function, one can get the point spread function. Therefore, it is not absolutely necessary to use a point target to calculate the resolution22.
3. Animal Preparation for SLN Imaging
NOTE: The handheld clinical imaging system described above was demonstrated for imaging small animal SLN. For experiments, 6- to 8-week-old healthy, female rats (NTac:Sprague Dawley, 220 ± 30 g) were procured. Female rats are used because the occurrence of breast cancer in male rats is less frequent. However, male rats can also be used for the studies. Additionally, in the literature, female rats are used more widely for the SLN imaging.
- Rat anesthetization
- Before imaging, anesthetize the rat with the anesthesia solution, which contains a cocktail of ketamine (100 mg/mL), xylazine (20 mg/mL), and injectable saline at a proportion of 2:1:1. Add 0.2 mL of the cocktail per 100 g of animal weight to a sterile surgical 1 mL syringe with needle (27G, ½ inch).
- Scruff the neck of the rat by hand and disinfect the right-lower quadrant of the abdomen with an alcohol swab. Inject anesthesia solution into the animal body.
- Ensure that the animal is anaesthetized by checking for reflex on toe pinch.
- For SLN imaging, remove hair from the region of interest gently with commercially available hair removal cream. Use as much as required to cover the area completely. Remove the cream with a wet cotton swab after 3 - 5 min of application. To prevent eyes from dryness and accidental laser damage, apply artificial tear ointment.
- Place blue underpad on the table and position the animal sideways on it. Administer inhalation anesthesia through a nose cone (0.75% of isoflurane along with oxygen (1.2 L/min)) to maintain the animal under anesthesia during experiments. Clip the pulse oximeter to the hind paw of the rat to monitor the heart rate and peripheral oxygen saturation throughout experiments.
NOTE: Make sure the animal is warm using a heating pad approved for animal use.
4. In Vivo SLN Imaging of Rats
- Before imaging, apply 0.5 to 1 mL of US gel on the skin using a syringe and spread it well using an applicator. Place a 0.5 cm thick chicken breast tissue slice of size 6 cm x 6 cm on the imaging area and apply more US gel on the chicken tissue to improve coupling.
NOTE: LNs are located under the skin (within 2-3 mm) in rats. In humans, LNs are at a depth of 1 cm. Hence, chicken tissue is placed in the imaging area of rat to mimic the human imaging scenario. Alternatively, tissue mimicking phantoms can be used in place of chicken tissue. - Switch on the laser. Place the handheld probe holder on top of the chicken tissue and scan it (move the holder right to left) in the combined US and PA mode.
NOTE: The area of the laser beam is approximately 3 cm2 and fluence is calculated to be approximately 8 mJ/cm2, which is less than the American National Standards Institute (ANSI) safety limit (20 mJ/cm2)35. The imaging depth is set to 2 cm in the clinical US system. Safety goggles should be worn at all times when the laser is switched on. - Set the imaging depth to 2 cm for PA imaging.
- Obtain a control image of the region of interest, above the front leg in the thoracic area, by moving the handheld probe from side to side before injection of the contrast agent.
NOTE: All the data is saved in the beam-formed data type for further processing. - Inject 0.2 mL of the contrast agent, (i.e., MB (10 mg/mL)) in the forepaw of the animal and massage it well for 2 min to facilitate contrast agent movement to the lymph nodes through the lymph vessels.
- Scan after 5 min with the handheld probe along the chicken tissue to locate the SLN with the help of the PA signal.
NOTE: All the frames are saved in the beam-formed data type. - Click on the 'freeze' button from the controls on the US system and click the 'export selected frames' button from the touch screen monitor to export the recorded data.
NOTE: Data can be stored in different formats namely, beam formed, scan converted, channel, and I.Q. - Add 2 more layers of 0.5 cm thick chicken tissue slices on top of the animal one by one and locate the SLN to demonstrate the feasibility of depth imaging up to 1.5 cm.
- After imaging, remove all the chicken tissue slices
- Switch off the laser.
5. PA Spectroscopy of SLN
- Place a 0.5 cm thick chicken breast tissue slice on the rat.
- Set the wavelength of the laser as 670 nm using the software.
- Switch on the laser. Scan with the probe along the chicken breast tissue on the area to locate the SLN with the help of the PA signal.
- Hold the probe stable after identifying the SLN.
- On the laser tuning software provided, enter the wavelength as 800 nm in the laser software, set the speed as 10 nm/s, and click the 'start' button.
NOTE: This will vary the wavelength from 670 nm to 800 nm at a speed of 10 nm/s. The wavelength range to be varied depends on the absorption spectrum of the contrast agent used. MB has a sharp peak around 670 nm. - Observe the change in PA signal with wavelength change.
- Switch off the laser.
- Remove the chicken tissue slice.
6. Real-time Needle Tracking Using PAI
- Place a 0.5 cm thick chicken breast tissue slice on the animal. Set the wavelength to 675 nm.
- Switch on the laser. Move the probe to locate and identify SLN on screen with the help of the PA signal.
- Real-time needle tracking
- Inject a 23 G needle, of dimensions 0.6 x 32 mm2, parallel to the UST through the chicken tissue into the animal to reach the SLN, while guiding it in real-time on the clinical US system monitor.
- After experiments, turn the laser off. Remove the chicken tissue and pulse oximeter from the animal and move the animal to the work bench. Clean the ultrasound gel on the rat with cotton wipes.
- Place the animal on its bedding and monitor it until it regains consciousness.
- Return the animal to its cage after its behavior is normal.
Access restricted. Please log in or start a trial to view this content.
Results
Loading...
$$\rightleftharpoonup{xx}$$
$$\longleftharp{xx}$$,
$$\longrightharp{xx}$$,
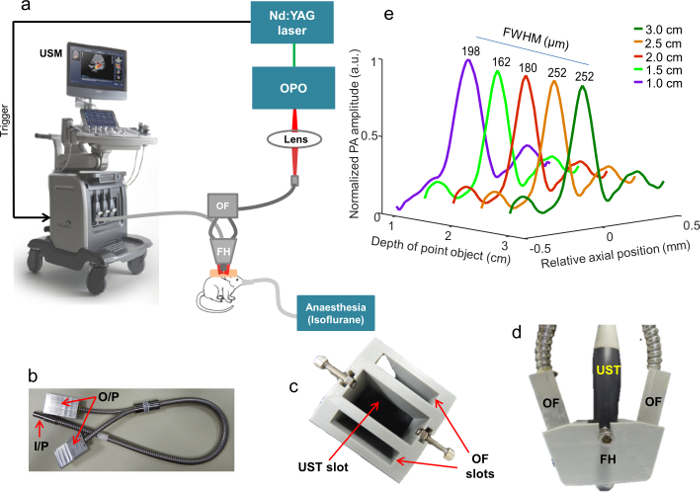
Figure 1: System description. (a) Schematic representation of the PAI system with dual modal clinical US system. OPO - optical parametric oscillator, OF - optical fiber bundle, FH - fiber holder, USM- clinical US machine. The fiber hol...
Access restricted. Please log in or start a trial to view this content.
Discussion
Loading...
$$\rightleftharpoonup{xx}$$
$$\longleftharp{xx}$$,
$$\longrightharp{xx}$$,
Currently the cost of screening, diagnosis, and treatment of cancer is very high. There are different imaging modalities which are being used for cancer screening and diagnosis. However, a lot of these imaging techniques have limitations including bulky machine size, invasive diagnosis, unfriendliness to patients, too expensive, requirement of ionizing radiation, or use of radioactive contrast agents. Therefore, an efficient, cost effective, real-time imaging and guiding system is much needed. Combined US and PA imaging ...
Access restricted. Please log in or start a trial to view this content.
Disclosures
Loading...
$$\rightleftharpoonup{xx}$$
$$\longleftharp{xx}$$,
$$\longrightharp{xx}$$,
The authors have no relevant financial interests in the manuscript and no other potential conflicts of interest to disclose.
Acknowledgements
Loading...
$$\rightleftharpoonup{xx}$$
$$\longleftharp{xx}$$,
$$\longrightharp{xx}$$,
The authors would like to acknowledge the financial support from the Tier 1 research grant funded by the Ministry of Education in Singapore (RG48/16: M4011617) and Tier 2 research grant funded by Ministry of Education in Singapore (ARC2/15: M4020238). The authors would like to acknowledge Dr. Rhonnie Austria Dienzo for his help with animal handling.
Access restricted. Please log in or start a trial to view this content.
Materials
| Name | Company | Catalog Number | Comments |
|---|---|---|---|
| Q-switched Nd:YAG laser | Continuum | Surelite | Pump laser |
| Optical parametric oscillator | Continuum | OPO laser | |
| Clinical ultrasound imaging system | Alpinion | E-CUBE 12R | Dual modal ultrasound and photoacoustic imaging system |
| Linear array ultrasound transducer | Alpinion | L3-12 | 128 element linear array transducer with centre frequency of 8.5 MHz, fractional bandwidth of 95%, |
| Bifurcated optical fiber | CeramOptec | Custom made | To couple the light from the laser to the handheld fiber holder |
| Lens | Thorlabs | LB1869 | Focus light from the laser to the optical fiber |
| Ultrasound gel | Progress/parker acquasonic gel | PA-GEL-CLEA-5000 | Acoustic coupling |
| Image Processing software | Mathworks | Matlab | Home made program using Matlab |
| Anesthetic Machine | medical plus pte ltd | Non-Rebreathing Anaesthesia machine with oxygen concentrator. | Supplies oxygen and isoflurane to animal |
| Pulse Oxymeter portable | Medtronic | PM10N with veterinary sensor | Monitors the pulse oxymetry of the animal |
| Animal distributor | In Vivos Pte Ltd, Singapore | Animal distributor that supplies small animals for research purpose. | |
| Breathing mask | Custom made | Used along with animal holder to supply anesthesia mixture to the animal | |
| chicken breast tissue | Pasar | Used to add depth to mimic human imaging scenario | |
| 23G needle | BD Precisionglide | 23G,1 and half inch | Used for realtime needle guidance |
| Holder for the fiber optic cable | Custom made | To hold the input end of the bifurcated cable | |
| Handheld probe | Custom made 3D printed | With two slots for the two output ends of the optical fiber and one slot for the ultrasound transducer | |
| Methylene blue (10 mg/mL) | Sterop | Contrast agent for PA imaging | |
| Laser tuning software | Surelite OPO PLUS | SLOPO | Software to tune the wavelength of OPO laser |
| Photodiode | Thorlabs | SP05/M | To detect the laser pulse to trigger the ultrasound system |
| Photodiode bias module | Thorlabs | PBM42 | To amplify the photodiode signal to tigger ultrasound signal |
| Depilatory cream | Reckitt Benckiser | Veet | Used to remove hair from the imaging area |
| Laser power meter | Ophir | Starlite, p/n: 7Z01565 | Used to measure the laser power |
References
Loading...
$$\rightleftharpoonup{xx}$$
$$\longleftharp{xx}$$,
$$\longrightharp{xx}$$,
- Yun, S. H., Kwok, S. J. Light in diagnosis, therapy and surgery. Nat. Biomed. Eng. 1, 0008(2017).
- Tseng, J., et al. Clinical accuracy of preoperative breast MRI for breast cancer. J. Surg. Oncol. , (2017).
- Baran, P., et al. Optimization of propagation-based x-ray phase-contrast tomography for breast cancer imaging. Phys. Med. Biol. 62 (6), 2315(2017).
- Huzarski, T., et al. Screening with magnetic resonance imaging, mammography and ultrasound in women at average and intermediate risk of breast cancer. Hered. Cancer Clin. Pract. 15 (1), 4(2017).
- Upputuri, P. K., Pramanik, M. Recent advances toward preclinical and clinical translation of photoacoustic tomography: a review. J. Biomed. Opt. 22 (4), 041006(2017).
- Wang, L. V., Yao, J. A practical guide to photoacoustic tomography in the life sciences. Nat. Methods. 13 (8), 627-638 (2016).
- Wang, L. V., Gao, L. Photoacoustic microscopy and computed tomography: from bench to bedside. Annu Rev Biomed Eng. 16, 155-185 (2014).
- Beard, P. Biomedical photoacoustic imaging. Interface Focus. 1 (4), 602-631 (2011).
- Yao, J., Wang, L. V. Photoacoustic tomography: fundamentals, advances and prospects. Contrast Media Mol Imaging. 6 (5), 332-345 (2011).
- Hai, P., et al. Label-free high-throughput detection and quantification of circulating melanoma tumor cell clusters by linear-array-based photoacoustic tomography. J. Biomed. Opt. 22 (4), 041004(2017).
- Upputuri, P. K., Kalva, S. K., Moothanchery, M., Pramanik, M. Pulsed laser diode photoacoustic tomography (PLD-PAT) system for fast in vivo imaging of small animal brain. Proc Spie. , 100645O (2017).
- Fakhrejahani, E., et al. Clinical report on the first prototype of a photoacoustic tomography system with dual illumination for breast cancer imaging. PLoS One. 10 (10), e0139113(2015).
- Wang, L. V., Hu, S. Photoacoustic Tomography: In Vivo Imaging from Organelles to Organs. Science. 335 (6075), 1458-1462 (2012).
- Pan, D., et al. Molecular photoacoustic imaging of angiogenesis with integrin-targeted gold nanobeacons. FASEB J. 25 (3), 875-882 (2011).
- Erpelding, T. N., et al. Sentinel Lymph Nodes in the Rat : Noninvasive Photoacoustic and US imaging with a clinical US system. Radiology. 256 (1), 102-110 (2010).
- Gawale, Y., et al. Carbazole-Linked Near-Infrared Aza-BODIPY Dyes as Triplet Sensitizers and Photoacoustic Contrast Agents for Deep-Tissue Imaging. Chem. Eur. J. 23 (27), 6570-6578 (2017).
- Sivasubramanian, K., et al. Near Infrared light-responsive liposomal contrast agent for photoacoustic imaging and drug release applications. J. Biomed. Opt. 22 (4), 041007(2017).
- Huang, S., Upputuri, P. K., Liu, H., Pramanik, M., Wang, M. A dual-functional benzobisthiadiazole derivative as an effective theranostic agent for near-infrared photoacoustic imaging and photothermal therapy. J. Mater. Chem. B. 4 (9), 1696-1703 (2016).
- Huang, S., Kannadorai, R. K., Chen, Y., Liu, Q., Wang, M. A narrow-bandgap benzobisthiadiazole derivative with high near-infrared photothermal conversion efficiency and robust photostability for cancer therapy. Chem. Comm. 51 (20), 4223-4226 (2015).
- Wu, D., Huang, L., Jiang, M. S., Jiang, H. Contrast Agents for Photoacoustic and Thermoacoustic Imaging: A Review. Int. J. Mol. Sci. 15 (12), 23616-23639 (2014).
- Pramanik, M., Swierczewska, M., Green, D., Sitharaman, B., Wang, L. V. Single-walled carbon nanotubes as a multimodal-thermoacoustic and photoacoustic-contrast agent. J. Biomed. Opt. 14 (3), 034018(2009).
- Kim, J., et al. Programmable Real-time Clinical Photoacoustic and Ultrasound Imaging System. Sci. Rep. 6, 35137(2016).
- McMasters, K. M., et al. Sentinel lymph node biopsy for breast cancer: a suitable alternative to routine axillary dissection in multi-institutional practice when optimal technique is used. J. Clin. Oncol. 18 (13), 2560-2566 (2000).
- Krag, D., et al. The sentinel node in breast cancer - a multicenter validation study. N. Engl. J. Med. 339 (14), 941-946 (1998).
- Borgstein, P. J., Meijer, S., Pijpers, R. Intradermal blue dye to identify sentinel lymphnode in breast cancer. The Lancet. 349 (9066), 1668-1669 (1997).
- Ung, O. A., South, N., Breast, W., Hospital, W. Australasian Experience and Trials in Sentinel Lymph Node Biopsy: The RACS SNAC Trial. Asian J. Surg. 27 (4), 284-290 (2004).
- Purushotham, A. D., et al. Morbidity after sentinel lymph node biopsy in primary breast cancer: results from a randomized controlled trial. J. Clin. Oncol. 23 (19), 4312-4321 (2005).
- Kim, C., et al. Handheld array-based photoacoustic probe for guiding needle biopsy of sentinel lymph nodes. J. Biomed. Opt. 15 (4), 046010(2010).
- Garcia-Uribe, A., et al. Dual-Modality Photoacoustic and Ultrasound Imaging System for Noninvasive Sentinel Lymph Node Detection in Patients with Breast Cancer. Sci. Rep. 5, 15748(2015).
- Kim, C., Song, K. H., Gao, F., Wang, L. V. Sentinel Lymph Nodes and Lymphatic Vessels: Noninvasive Dual-Modality in Vivo Mapping by Using Indocyanine Green in Rats-Volumetric Spectroscopic Photoacoustic Imaging and Planar Fluorescence Imaging. Radiology. 255 (2), 442-450 (2010).
- Pan, D., et al. Near infrared photoacoustic detection of sentinel lymph nodes with gold nanobeacons. Biomaterials. 31 (14), 4088-4093 (2010).
- Song, K. H., Kim, C., Cobley, C. M., Xia, Y., Wang, L. V. Near-infrared gold nanocages as a new class of tracers for photoacoustic sentinel lymph node mapping on a rat model. Nano Lett. 9 (1), 183-188 (2009).
- Sivasubramanian, K., Periyasamy, V., Wen, K. K., Pramanik, M. Optimizing light delivery through fiber bundle in photoacoustic imaging with clinical ultrasound system: Monte Carlo simulation and experimental validation. J. Biomed. Opt. 22 (4), 041008(2017).
- Sivasubramanian, K., Pramanik, M. High frame rate photoacoustic imaging at 7000 frames per second using clinical ultrasound system. Biomed. Opt. Express. 7 (2), 312-323 (2016).
- Laser Institute of America. American National Standard for Safe Use of Lasers. ANSI Standard Z136.1-2007. , NY. (2007).
- Prahl, S. Tabulated molar extinction coefficient for methylene blue in water. , Available from: http://omlc.ogi.edu/spectra/mb/mb-water.html (2016).
- Chapman, G. A., Johnson, D., Bodenham, A. R. Visualisation of needle position using ultrasonography. Anaesthesia. 61 (2), 148-158 (2006).
- Daoudi, K., et al. Handheld probe integrating laser diode and ultrasound transducer array for ultrasound/photoacoustic dual modality imaging. Opt. Express. 22 (21), 26365-26374 (2014).
Access restricted. Please log in or start a trial to view this content.
Reprints and Permissions
Request permission to reuse the text or figures of this JoVE article
Request Permission