We describe a method of synthesizing biocompatible 10-nm gold nanoparticles, functionalized by coating poly-ethylene glycol onto the surface. These particles can be used in vitro and in vivo for delivering therapeutics to nanoscale cellular and extracellular spaces that are difficult to access with conventional nanoparticle sizes.
Method Article
Synthesis of Functionalized 10-nm Polymer-coated Gold Particles for Endothelium Targeting and Drug Delivery
In This Article
Summary
Abstract
Gold nanoparticles (AuNPs) have been used extensively in medical research due to their size, biocompatibility, and modifiable surface. Specific targeting and drug delivery are some of the applications of these AuNPs, but endothelial extracellular matrices' defensive properties hamper particle uptake. To address this issue, we describe a synthesis method for ultrasmall gold nanoparticles to improve vascular delivery, with customizable functional groups and polymer lengths for further adjustments. The protocol yields 2.5 nm AuNPs that are capped with tetrakis(hydroxymethyl)phosphonium chloride (THPC). The replacement of THPC with hetero-functional polyethylene glycol (PEG) on the surface of the AuNP increases the hydrodynamic radius to 10.5 nm while providing various functional groups on the surface. The last part of the protocol includes an optional addition of a fluorophore to allow the AuNPs to be visualized under fluorescence to track nanoparticle uptake. Dialysis and lyophilization were used to purify and isolate the AuNPs. These fluorescent nanoparticles can be visualized in both in vitro and in vivo experiments due to the biocompatible PEG coating and fluorescent probes. Additionally, the size range of these nanoparticles render them an ideal candidate for probing the glycocalyx without disrupting normal vasculature function, which may lead to improved delivery and therapeutics.
Introduction
Nanoparticles have been applied to drug delivery and imaging for its ability to navigate through the body to reach target areas of interest1,2. The particles may accumulate within tumors via the leaky vasculature or localize where a target ligand is overexpressed and exposed. Gold, specifically, has become a commonly used nanoparticle material because of its unique chemical and physical properties that affect the transportation and release of therapeutics3. Gold is an effective nanoparticle material because its surface can be modified to bind to thiols and has high biocompatibility due to its low toxicity4. AuNPs are capable of being carriers of large biomolecular drugs and have been successful in delivering peptides, nucleic acids, and proteins, allowing AuNPs to be favorable for targeting2,4.
Unfortunately, nanoparticle drug delivery effectiveness has been hampered by the negatively charged glycocalyx, which is the extracellular coat on the membrane of most mammalian cells and has pore sizes of up to 7 nm5,6. This pore size is smaller than most nanoparticle drug carriers, which have typical diameters ranging from 50-200 nm. Under disease conditions, these glycocalyx pores become larger due to degradation, increasing permeability through to the endothelial cells. However, most nanoparticles are still too large to take advantage of this structural change in the glycocalyx. One implication of this size mismatch is that conventionally sized particles do not interact favorably with endothelial cells that line blood vessels. This affects the delivery of intravenously administered particles into the endothelium, and can also be said of particle transport through the blood brain barrier7,8,9,10.
One approach to combat this issue is to utilize smaller particles to pass through the small pores in the glycocalyx. Here, we synthesize a 10.5 nm ultrasmall gold nanoparticle, which normally should be deterred by intact, healthy glycocalyx. Once the glycocalyx begins to be compromised, the nanoparticle should easily penetrate the cells through the increasing pore size. The protocol in this paper details a synthesis of ultrasmall gold core coated with PEG, which increases the biocompatibility and reduces systemic clearance4. The PEG can also contain several types of functional groups, opening avenues for conjugation of targeting ligands, fluorophores, and therapeutics. Previously published results indicate that these ultrasmall nanoparticles tend to be taken up more favorably in regions of disrupted endothelial glycocalyx function even without any active targeting4,11. This indicates the feasibility and importance of utilizing particles of correct size for delivery applications. The following protocol presents the synthesis, purification and the characterization of the PEG-coated AuNPs (PEG-AuNP), with the discussion for tailoring the functional groups and conjugations for other applications.
Protocol
1. Preparation or Procurement of Stock Solutions (to Be Stored at Room Temperature or Frozen until Use)
- Prepare a 1 M sodium hydroxide (NaOH) stock solution by dissolving 400 mg NaOH in 10 mL ultrapure water at room temperature, and mixing the materials well.
NOTE: Ultrapure water is defined as water without impurities such as particulates, bacteria, nucleases, ions, or traces of organics. A purification system is used to obtain the ultrapure water, resulting in its resistivity of up to 18.2 mΩ·cm, indicating a low anionic contamination. The use of commercially available bottled ultrapure water is not recommended. Henceforth, this ultrapure water will be referred to as water, unless otherwise specified. - Prepare a 6M NaOH stock solution by dissolving 2.4 g of NaOH in 10 mL of water, and store the solution at room temperature.
- Prepare a 250 mM stock solution of chloroauric acid (HAuCl4) by dissolving 1 g of dried HAuCl4 in 10.16 mL of water. Dilute 1 mL of 250 mM HAuCl4 with 9 mL water to obtain working concentration of 25 mM HAuCl4. Store the HAuCl4 solution at room temperature.
- Prepare a 0.1 M carbonate buffer at pH 8.8, by dissolving 84 mg sodium bicarbonate in 10 mL water and adjusting the pH to 8.8 by adding 6 M NaOH from step 1.2. Store the carbonate buffer at room temperature.
- Mix 20 mL of tetrazolium compound, 3-(4,5-dimethylthiazol-2-yl)-5-(3-carboxymethoxyphenyl)-2-(4-sulfophenyl)-2H-tetrazolium salt (MTS), with a stabilizing agent, phenazine ethosulfate (PES) (see Table of Materials). Store the MTS/PES mixture in aliquots (for a maximum of 10 freeze-thaw cycles) at -20 °C in dark.
2. Synthesis of the Gold Nanoparticle Cores
- Prepare a diluted THPC solution by adding 12 µL of 80% THPC in water to 1 mL of water in a microcentrifuge tube at room temperature.
- Secure a 100-mL round bottom flask over the center of a magnetic stir plate. Pour 45 mL of water into the flask and stir the water at 300 rpm using a small egg-shaped magnetic stir bar. Add 0.5 mL of 1 M NaOH and 1 mL of diluted THPC solution. Continue to stir the reaction mixture vigorously for 5 min.
- Continue stirring the mixture and add 2 mL of 25 mM HAuCl4 solution. The color of the mixture will change from yellow to dark brown within seconds, indicating the formation of THPC capped AuNPs with a negative charge. Stir the mixture for an additional 15 min to allow for complete formation of the gold cores.
3. Addition of the Polymer Corona Around the Gold Nanoparticles
- During the 15 min period described in step 2.3, prepare the PEG solutions by dissolving each of the following in 1 mL water in 4 mL glass vials: 30 mg NH2-PEG-SH; 7.5 mg m-PEG-SH; 7.5 mg COOH-PEG-SH.
NOTE: The resulting concentrations should be 8.8 M NH2-PEG-SH, 3.75 M m-PEG-SH, and 3.75 M COOH-PEG-SH. - After reducing the stirring speed of the solution in the round bottom flask to 100 rpm, add the PEG solutions to the solution of THPC capped AuNPs dropwise. Continue to stir the mixture gently overnight, at room temperature, to ensure efficient removal of THPC and the replacement by PEG.
- For the next 72 h, use a 12-14 kDa molecular weight cutoff cellulose membrane to dialyze the stirred mixture against a 4 L bucket of water stirred at 60 rpm. Tie the ends of the membranes by dialysis clips and transfer the solution via pipette.
NOTE: This dialysis process with the 12-14 kDa cutoff membrane only removes unreacted PEG, THPC, and other chemical reactants, by diffusion along a concentration gradient. - To maintain high concentration gradient and promote continuous diffusion, change the water every 2 h for the first 6 h and every 6-12 h for the remaining 66 h.
NOTE: The purpose of this water change schedule is to accommodate the rapid diffusion that occurs early on, because of the initially high concentration within the sample. The dialysis process described above leaves the nanoparticle solution semi-purified, because the nanoparticles, precipitates, aggregates, and other large size impurities cannot pass through the pores of the 12-14 kDa cutoff membrane. - Filter the semi-purified nanoparticle solution into a 50-mL conical tube using a 0.2 µm syringe filter to remove the remaining precipitates, aggregates, and other large size impurities.
- Place the conical tube in a -80 °C freezer and allow the purified PEGylated AuNP (PEG-AuNP) solution to freeze for about 5 h.
- Use a freeze dryer to lyophilize the purified PEG-AuNP.
- Store the dry, purified PEG-AuNP at 4 °C until use.
4. Conjugating Fluorophores using N-hydroxysuccinimide (NHS) Ester onto the NH2 Groups on the PEG-AuNP
- Secure a 50-mL round bottom flask over the center of a magnetic stir plate. Fill the flask with 18 mL of water and stir the water at 100 rpm using an egg-shaped magnetic stir bar.
- Weigh 2 mg of the lyophilized PEG-AuNP in a 4 mL conical tube, using a high precision benchtop scale. Use an anti-static gun to eliminate static charge and clinging of the PEG-AuNP powder to the tube surface. Add 2 mL of water to the tube. Pour the 2 mL PEG-AuNP solution into the round bottom flask for further reconstitution in a total of 20 mL of water. Continue to stir the mixture at 100 rpm using an egg-shaped magnetic stir bar.
- Add 1 mL of 0.1 M, pH 8.8 carbonate buffer to the 20 mL of reconstituted AuNP contained in the round bottom flask. Continue stirring.
- Add 5 µL of 10 mg/mL fluorescent NHS ester in dimethyl sulfoxide.
NOTE: Any fluorescent dye can be used in this process. Stir the fluorescent PEG overnight. Keep it at room temperature and covered in foil. - For the next 72 h, remove excess fluorophores using the protocol described in step 3.3. Briefly, dialyze the stirred mixture using a 4 L bucket of water and a 12-14 kDa molecular weight cutoff cellulose membrane. Change the water every 2 h for the first 6 h and every 6-12 h for the remaining 66 h.
- Obtain 1 mL of the purified fluorescent PEG-AuNP solution, to be used for characterization described below in section 5. Freeze and lyophilize the remaining solution to obtain fluorescent nanoparticles in powdered form for storage at 4 °C, as described in steps 3.5-3.7.
- Use a 0.2 µm syringe filter to sterilize and remove any potential precipitates once reconstituted for cell culture applications.
5. Characterization of Fluorescent PEGylated Gold Nanoparticles
- Using transmission electron microscopy (TEM) to visualize the gold nanoparticle core and quantify the sizes
- Drop 10 µL of the purified fluorescent PEG-AuNP solution onto a carbon coated mesh TEM grid.
- After 5 min, use a piece of filter paper to carefully wick away excess liquid from the edge of the TEM grid until a film containing the fluorescent PEG-AuNPs is left behind.
- View the fluorescent PEG-AuNPs at 80 kV and at a magnification of 50,000-150,000. Take digital pictures.
NOTE: Only the gold core will be visible because the PEG is not electron dense on the TEM. - Using a measuring software, set the measurement scale in correlation to the scale bar. Calculate the diameters of approximately 20 gold cores, and then determine the average gold core diameter.
NOTE: The TEM imaging system automatically places a scale bar on the digital pictures.
- Measurement of hydrodynamic nanoparticle size using dynamic light scattering (DLS)
- Transfer 1 mg of lyophilized THPC-coated AuNPs into a microcentrifuge tube using the approach described in step 4.2. Transfer 1 mg of lyophilized PEG-AuNP in a separate tube. Add 1 mL of water to each tube and transfer each AuNP solution to a 1 mL clear plastic.
- Place a cuvette into a DLS instrument and measure spherical hydrodynamic diameters using the particle analyzer software that is built into the DLS system.
- Plot the measured hydrodynamic diameters using a histogram format.
NOTE: The histogram will group nanoparticles by size. The largest group of nanoparticles will clarify the diameter that best describes the size of the AuNPs synthesized in this protocol.
- Fluorometric fluorescence confirmation
NOTE: The same sample and cuvette from step 5.2 can be used to measure fluorescent signal.- Remove the cuvette from the DLS and insert into a spectrofluorometer. Set the excitation wavelength to 633 nm and read the emitted fluorescence signals along a wavelength range of 650-800 nm.
- Confirm that the peak is approximately 665 nm, which correlates to the emission peak for NHS.
NOTE: Adjust the excitation and emission wavelengths according to the fluorophore used in the process.
- MTS assay11 to assess biocompatibility
- In a 96-well clear bottom sterile tissue culture treated plate, pipette 100 µL of Dulbecco's Modified Eagle's Medium (DMEM; supplemented with 10% fetal bovine serum and 1% penicillin/streptomycin) and 3.2 x 10³ cells into each well.
NOTE: In this study, rat fat pad endothelial cells are used. A total of 21 wells are used to allow for 3 replicates for each of the 7 different nanoparticle concentrations (see step 5.4.3 for specific concentrations of interest). - Allow the cells to grow to confluency in humidity and 5% CO2 controlled incubators at 37 °C11.
- Prepare individual microcentrifuge tubes, each containing 300 µL of DMEM with nanoparticles of various concentrations. This study requires 7 different tubes of DMEM with the following PEG-AuNP concentrations: 0 µg/mL, 10 µg/mL, 50 µg/mL, 100 µg/mL, 250 µg/mL, 500 µg/mL, and 1,000 µg/mL.
- Aspirate the DMEM from the tube. Fill the wells in triplicate with 100 µL of DMEM media containing 0, 10, 50, 100, 250, 500, or 1,000 µg/mL of AuNP.
- Allow the cells and nanoparticles to co-incubate for a pre-determined length of time, here for 16 h.
- Near the end of the incubation period, thaw the MTS/PES mixture from step 1.5.
- After incubation, aspirate the DMEM and the suspended, loosely attached nanoparticles from the wells. Add 100 µL of fresh DMEM along with 20 µL of MTS/PES solution to obtain 1:5 MTS/PES to DMEM ratio according to the manufacturer's protocol. Incubate the cells with MTS/PES at 37 °C for 2 h.
NOTE: This 2 h incubation time is determined by the metabolic activity of endothelial cells and can be increased to up to 4 h for other cell types. Within the 2 h period, the MTS is metabolized by the endothelial cells into colored formazan that mixes with the DMEM. Biocompatibility of PEG-AuNP and the likelihood of cell viability will be demonstrated with more colored formazan. Toxicity of PEG-AuNP and the chance that the cells are dying will be shown with less intense color. - Perform colorimetric analysis of each well by reading absorbance at 492 nm with a compatible plate reader.
- For each nanoparticle concentration, calculate the average absorbance from triplicate absorbance values. Divide the average absorbance by the value obtained from averaging absorbance in wells containing 0 µg/mL nanoparticles.
NOTE: These wells that contain no AuNPs serve as controls for calculating percentage cell viability in response to nanoparticle treatment administered in other wells.
- In a 96-well clear bottom sterile tissue culture treated plate, pipette 100 µL of Dulbecco's Modified Eagle's Medium (DMEM; supplemented with 10% fetal bovine serum and 1% penicillin/streptomycin) and 3.2 x 10³ cells into each well.
- Fluorescence confocal microscopy assessment of nanoparticle uptake in adherent endothelial cells with intact or dysfunctional glycocalyx11
- Seed 1.0 x 10⁴ cells/cm2 rat fat pad endothelial cells onto sterile 12 mm glass coverslips and feed cells with DMEM supplemented with 10% fetal bovine serum and 1% penicillin/streptomycin. Allow the cells to grow to full confluency in humidity and CO2 controlled incubators at 37 °C, for approximately 3 days.
- Add treatments to modify the glycocalyx, if applicable. For example, 2 h treatment of the cultured endothelial cells with 2.5 x 10⁻⁶ IU heparinase III enzyme degrades the glycocalyx by specifically cleaving its heparan sulfate component.
NOTE: Healthy glycocalyx can be modeled by growing the endothelial cells as described in step 5.5.1 without the addition of degradation enzymes. - With the endothelial glycocalyx left intact or rendered dysfunctional, incubate the endothelial cells with fluorescent AuNPs at 550 µg/mL for 16 h or other desired time.
- Gently wash the cells with 2 mL of 37 °C 1% bovine serum albumin in phosphate buffered saline (PBS; containing 100 mg/L calcium and 100 mg/L magnesium). Submerge the cells in 2 mL of 2% paraformaldehyde and 0.1% glutaraldehyde in PBS, and allow the cells to fix for 30 min at room temperature.
- Remove the aldehyde fixing solution and wash the cells with room temperature PBS for three 5-min cycles.
- Prior to primary antibody application, expose endothelial cells to 2% goat serum in PBS for 30 min at room temperature to block non-specific binding sites. Cells must be fully covered by the blocking solution.
- Incubate endothelial cells overnight with 1% anti-heparan sulfate primary antibody in 2% goat serum in PBS in 4 °C to label the heparan sulfate component of the glycocalyx. Ensure that the fixed cells are fully in contact with the antibody solution.
- The next day, wash out the antibody with room temperature PBS for three 10 min cycles.
- Incubate the endothelial cells with 1:1,000 dilution of the appropriate fluorescent secondary antibody for 30 min at room temperature, in the dark or covered with aluminum foil.
- Wash out the secondary antibody with room temperature PBS for three 10 min cycles.
- Mount the coverslip onto microscope slides using an anti-fade mounting medium containing 4',6-diamidino-2-phenylindole, dihydrochloride (DAPI) for nuclei staining. Seal the edges of the coverslip using nail polish.
- Image the fluorescent immunostained endothelial cell samples with confocal microscopy, using blue, green, and far red channels to visualize the nuclei, heparan sulfate glycocalyx, and the nanoparticles, respectively.
Results
The synthesized AuNPs, coated with THPC or PEG (Figure 1A and Figure 1B, respectively), are imaged with TEM and the particles sizes are measured using the TEM and DLS to ensure proper nanoparticle size distribution. Figure 2 shows the TEM image of a THPC-AuNP sample at 80 kV and 150,000x magnification. The diameters of the THPC-AuNP particles range from 2-3 nm, based on the calibration bar in TEM images. This THPC-AuNP size is also evident in the DLS size measurement histogram shown in Figure 2, in which the THPC coated AuNP is shown to have a peak at 2.5 nm. PEGylation is not visible under TEM as the polymers are not electron dense. TEM imaging of PEG-AuNP samples simply confirms the presence of individual dispersed particles, which is expected because the PEG polymer corona around the nanoparticles aid in prevention of aggregation. For these PEG-AuNP samples, the DLS size measurement histogram shows a shift in the peak, to approximately 10.5 nm on the DLS. Attachments of further ligands or drugs onto functional groups will impact the size of the nanoparticle as well, and should be taken into consideration when measuring the diameter.
The fluorophore addition (Figure 1C) is confirmed by using a fluorometer to measure fluorescence signal from a sample of nanoparticles, as shown in Figure 3. When excited with a wavelength of 633 nm, the emission is measured to have a maximum between 660 and 672 nm, which matches the manufacturer's product information of maximum emission at 665 nm. Attachment of other fluorescent probes should be checked in a similar manner to ensure fluorescent response.
The biocompatibility of the particles and related cell viability are assessed using the MTS assay to check relative cell metabolism of MTS after 16 h incubation with various concentrations of the nanoparticles. The fluorophore conjugated PEGylated AuNPs shows no significant toxicity, as indicated by the similar levels of cell viability at all concentrations up to 1 mg/mL (Figure 4A). This biocompatibility may change depending on the therapeutic or the ligand attached to the remaining functional groups to further customize the particles. Drug attachments tend to increase toxicity, but depending on the working concentrations, it may not affect the viability in a significant manner.
Uptake of fluorescent, PEGylated AuNPs (Figure 1C) by adherent cells is assessed using cultured rat fat pad endothelial cells with intact or dysfunctional glycocalyx (Figure 4B). The dysfunctional glycocalyx conditions are achieved by adding heparinase III enzyme to the culture, resulting in a degradation of the heparan sulfate glycocalyx component and compromising the matrix12. Figure 4B shows the different levels of uptake of PEG-AuNPs, as red dots on the cross-sectional view of the representative endothelial cells. A healthy glycocalyx deters uptake of these gold nanoparticles, but a substantial increase is observed when the enzyme is employed11. This result highlights the potential of these ultrasmall nanoparticles to deliver therapeutics to endothelial cells in a manner controlled by distinct interactions that are based on glycocalyx health.
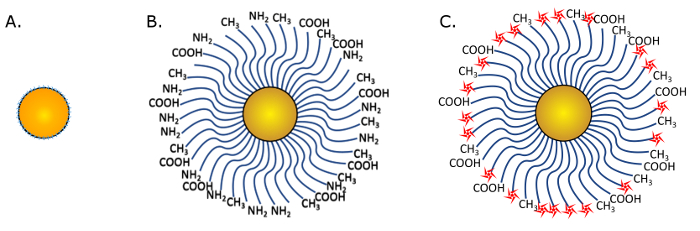
Figure 1: Gold nanoparticle schematics. (A) THPC coated AuNP nanosphere before PEG replacement. (B) PEGylated AuNP with 3 types of PEG terminations, including COOH, NH2, and CH3. Blue waves represent the polymer. (C) Conjugated nanoparticles for fluorescence imaging. Red stars show the fluorophores conjugated to NH2 functional groups. Please click here to view a larger version of this figure.
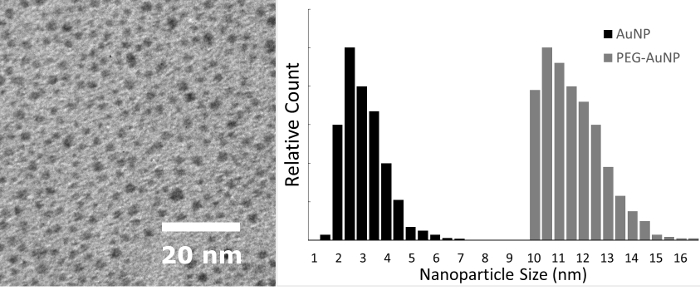
Figure 2: Size measurements of gold nanoparticles. Left: TEM of gold nanoparticles prior to addition of PEG at 80 kV and 150,000X magnification, with scale bar shown. Right: Histogram of the nanoparticle size measured by DLS before (AuNP) and after (PEG-AuNP) the THPC replacement with PEG. The DLS results for THPC-coated AuNP quantify what is visualized by TEM. The DLS PEG-coated AuNP results overcome the challenge of the inability to visualize PEG by TEM due to the polymers not being electron dense. A TEM of PEG-AuNP will show only the core gold nanoparticles and will look the same as a THPC-capped AuNP. Please click here to view a larger version of this figure.
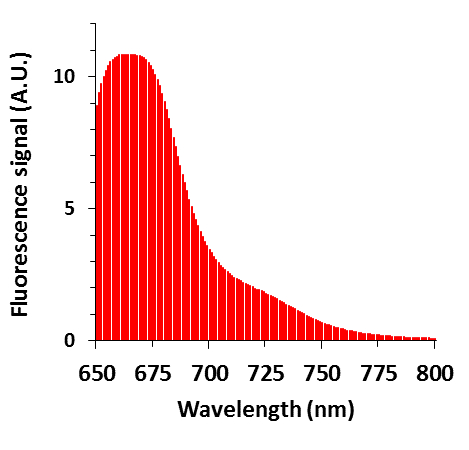
Figure 3: Fluorescence data of the fluorescent PEG-AuNP. The fluorescence peak at 667 nm matches the emission of the fluorophore conjugated to PEG-AuNP. A.U.: arbitrary units.
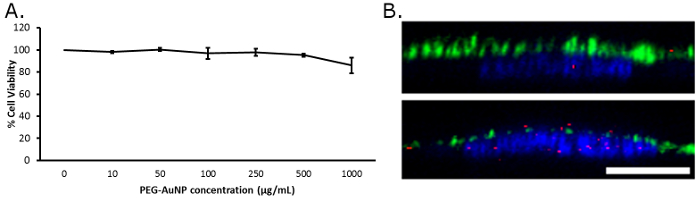
Figure 4: Cell interactions with the fluorescent PEG-AuNP. (A) Cell viability (MTS metabolism) plot for rat fat pad endothelial cells after 16 h co-incubation with fluorescent PEG-AuNP. (B) Confocal cross-sectional images of fixed rat fat pad endothelial cells stained with DAPI for the nuclei (blue) and antibody against heparan sulfate, a glycocalyx component (green). Top image is a healthy glycocalyx and bottom is a degraded glycocalyx layer; there is significantly more red fluorescence from the nanoparticles in the sample with degraded glycocalyx. Scale bar is 10 µm. Please click here to view a larger version of this figure.
Discussion
This technique is an effective method for synthesizing customizable, ultrasmall PEG coated AuNPs. An important part of this procedure is the initial formation of THPC capped gold nanoparticles, which can be confirmed by the color change from yellow to brown that will occur after HAuCl4 has been added to the contents in the round bottom flask (Protocol step 2.3). No color change indicates that there are no nanoparticles formed and that the initial steps should be checked and repeated before proceeding. In the case the color changes to something other than brown such as wine red or grey, the resulting particles will likely not be around the target 2.5 nm and a new batch should be made as well.
After the formation of the gold core, the exchange of THPC for PEG and the purification procedures contain several key steps for successful completion of the protocol. Mixing overnight allows for the replacement reaction to go to completion. Failed purification could occur if the dialysis water is not changed with the prescribed frequency. Aggregation and precipitation of the particles can also occur if the particles are left in dialysis for more than 72 h. Other potential issues could be observed during freeze drying. If the ultrasmall PEG coated AuNP solution was not completely frozen or if the lyophilizer was not set up correctly, samples may be lost. Refer to the lyophilizer manual, as some equipment may require different sample preparations.
The ease of synthesis and the biocompatibility of the resulting particles represent advantages for using these PEG-AuNPs. In addition, these nanoparticles have the advantage of being able to interact with nanoscale cellular structures as demonstrated by the ability to identify degraded glycocalyx by uptake of these nanoparticles. This advantage can be leveraged for the development of new atherosclerosis therapies and preventive measures. Beyond what we present here, another advantage of this protocol is that it allows for extensive customization of the particles as well as increased stability and storage capabilities by attaching thiol containing PEG onto the gold nanoparticles4. The other end of the PEG chain can contain any functional group, and a myriad of molecules can be conjugated to those groups. In this protocol, all three common functional groups are attached (methyl, carboxyl, and amino). The ratio of the PEG is chosen to prioritize fluorescent detection first, then the ability to incorporate a secondary targeting moiety using the carboxylic acid group. The ratios of these groups can be tweaked based on the application, and the lengths and shapes of the polymers can be adjusted as well.
To measure particle uptake, we conjugated a fluorescent probe to one of the functional groups. It should be noted that any conjugation beyond what we have described will result in a change of surface properties of the nanoparticle. Each iteration of the nanoparticles with respect to additional components and conjugation reactions should be tested for the desired properties.
This method produces ultrasmall gold nanoparticles intended to overcome the defensive properties of the endothelial extracellular glycocalyx, which hampers uptake of conventionally sized nanoparticles. However, the small size lends to difficulty in both the imaging and drug loading aspect. These particles are significantly smaller than the typical nanoparticle size range, and as a result the surface area available for attachments of therapeutics and targeting moieties is greatly decreased. This may lead to difficulty picking up individual signals in imaging applications, although clusters of particles can still be readily identified, as shown in the confocal images. The reduced surface for attachments of targeting ligands and therapeutics may require more particles to be administered to achieve target dosage requirements. However, the smaller particles will be more efficient in the delivery when taking the glycocalyx into consideration.
These novel ultrasmall particles are capable of delivery into difficult to reach nanoscale areas within the body with minimal disruption of the microenvironment. The addition of the PEG allows for increased biocompatibility and offers functional groups for heavy customization of the particles for diverse applications. The smaller size compared to typical nanoparticles comes with some shortcomings, but if developed strategically, the ultrasmall particle is a promising approach to accommodation of the difficult to penetrate, intricate, and fragile glycocalyx in vascular targeting and drug delivery.
Disclosures
The authors declare that they have no competing financial interests.
Acknowledgements
This work was supported by the Northeastern University Chemical Engineering Department, Start-up Funds and a Tier 1 Pilot Study Grant from the Northeastern University Provost Office, NIH K01 HL125499, and NSF-IGERT grant NSF/DGE-096843. The authors would also like to thank Thomas J. Webster and his lab for their assistance as well as the Nanomedicine Science and Technology Center and Pharmaceutical Sciences Department at Northeastern University.
Materials
| Name | Company | Catalog Number | Comments |
|---|---|---|---|
| Sodium hydroxide (NaOH) | Sigma Aldrich | 795429 | |
| Gold (III) Chloride trihydrate (HAuCl4.3H2O) | Sigma Aldrich | 520918 | |
| Sodium bicarbonate | Sigma Aldrich | S5761 | |
| Tetrakis (hydroxymethyl) phosphnium chloride | Sigma Aldrich | 404861 | |
| Mono-functional mPEG-thiol | Layson Bio Inc. | MPEG-SH-2000-1g | Mw: 2,000 Da |
| hetero bi-functional anime-PEG-thiol | Layson Bio Inc. | NH2-PEG-SH-3400-1g | Mw: 3,400 Da |
| Carboxymethyl-PEG-thiol | Layson Bio Inc. | CM-PEG-SH-2000-1g | Mw: 2,000 Da |
| Cellulose dialysis membrane (12-14 kDa) | Sigma Aldrich | D9777 | |
| Zerostat anti-static instrument | Sigma Aldrich | Z108812 | |
| Alexa Fluor 647 (AF647) carboxylic acid succinimidyl ester | Fisher | A20006 | Fluorophore |
| Fisherbrand Qualitative Grade Plain Filter Paper Circles - P5 grade | Thermo Fisher Scientific | 09-801-B | |
| Transmission electron microscopy | JEOL USA | JEOL JEM-1000 | TEM |
| Dynamic Light Scattering | Brookhaven Instruments Corporation | Brookhaven 90 Plus Particle Size Analyzer | DLS |
| Fluorometer | Horiba Scientific | Jobin Yvon Fluromax 4 | Fluorometer |
| CellTiter 96 AQueous One Solution Cell Proliferation Assay (MTS) | Promega | G3582 | MTS |
| Plate reader | Molecular Devices | SpectraMax M4 | Plate reader |
| 10E4 epitope HS mouse monoclonal IgM antibody (primary antibody) | Amsbio | 370255 | Primary antibody |
| Alexa Fluor 488 goat anti-mouse IgG (secondary antibody) | Thermo Fisher Scientific | R37120 | Secondary antibody |
| VECTASHIELD mounting medium with DAPI | Vector Laboratories | H-1000 | With DAPI |
| Confocal Microscope | Carl Zeiss Meditex AG | Zeiss LSM 700 | Confocol microscopy |
References
- Veiseh, O., Gunn, J., Zhang, M. Design and fabrication of magnetic nanoparticles for targeted drug delivery and imaging. Adv. Drug Deliv. Rev. 62 (3), 284-304 (2010).
- Feng, X., et al. Conjugated polymer nanoparticles for drug delivery and imaging. ACS Appl. Mater. Interfaces. 2 (8), 2429-2435 (2010).
- Ghosh, P., Han, G., De, M., Kim, C. K., Rotello, V. M. Gold nanoparticles in delivery applications. Adv. Drug Deliv. Rev. 60 (11), 1307-1315 (2008).
- Kumar, R., et al. Third generation gold nanoplatform optimized for radiation therapy. Transl. Cancer Res. 2 (4), 1-18 (2013).
- Tarbell, J. M., Ebong, E. E. The endothelial glycocalyx: a mechano-sensor and -transducer. Sci. Signal. 1 (40), (2008).
- Reitsma, S., Slaaf, D. W., Vink, H., van Zandvoort, M., oude Egbrink, M. G. A. The endothelial glycocalyx: composition, functions, and visualization. Pflugers Arch. 454 (3), 345-359 (2007).
- Becker, B. F., Jacob, M., Leipert, S., Salmon, A. H., Chappell, D. Degradation of the endothelial glycocalyx in clinical settings: searching for the sheddases. Br. J. Clin. Pharmacol. 80 (3), 389-402 (2015).
- Muzykantov, V., Muro, S. Targeting delivery of drugs in the vascular system. Int. J. Transp. Phenom. 12 (1-2), 41-49 (2011).
- Simone, E., Ding, B. -S., Muzykantov, V. Targeted delivery of therapeutics to endothelium. Cell Tissue Res. 335 (1), 283-300 (2009).
- Lockman, P. R., Mumper, R. J., Khan, M. A., Allen, D. D. Nanoparticle technology for drug delivery across the blood-brain barrier. Drug Dev. Ind. Pharm. 28 (1), 1-13 (2002).
- Cheng, M. J., Kumar, R., Sridhar, S., Webster, T. J., Ebong, E. E. Endothelial glycocalyx conditions influence nanoparticle uptake for passive targeting. Int. J. Nanomedicine. 11, 3305-3315 (2016).
- Fels, J., Jeggle, P., Liashkovich, I., Peters, W., Oberleithner, H. Nanomechanics of vascular endothelium. Cell Tissue Res. 355 (3), 727-737 (2014).
Reprints and Permissions
