For some patients, the only option for fertility preservation is cryopreservation of ovarian tissue. Unfortunately, delayed revascularization undermines follicular viability. Here, we present a protocol to co-transplant human ovarian tissue with endothelial cells for utilization as a cell-based strategy combining accelerated perfusion with a direct paracrine delivery of bioactive molecules.
Method Article
Co-transplantation of Human Ovarian Tissue with Engineered Endothelial Cells: A Cell-based Strategy Combining Accelerated Perfusion with Direct Paracrine Delivery
In This Article
Summary
Abstract
Infertility is a frequent side effect of chemotherapy and/or radiotherapy and for some patients, cryopreservation of oocytes or embryos is not an option. As an alternative, an increasing number of these patients are choosing to cryopreserve ovarian tissue for autograft following recovery and remission. Despite improvements in outcomes among patients undergoing auto-transplantation of cryopreserved ovarian tissue, efficient revascularization of grafted tissue remains a major obstacle. To mitigate ischemia and thus improve outcomes in patients undergoing auto-transplantation, we developed a vascular cell-based strategy for accelerating perfusion of ovarian tissue. We describe a method for co-transplantation of exogenous endothelial cells (ExECs) with cryopreserved ovarian tissue in a mouse xenograft model. We extend this approach to employ ExECs that have been engineered to constitutively express Anti-Mullerian hormone (AMH), thus enabling sustained paracrine signaling input to ovarian grafts. Co-transplantation with ExECs increased follicular volume and improved antral follicle development, and AMH-expressing ExECs promoted retention of quiescent primordial follicles. This combined strategy may be a useful tool for mitigating ischemia and modulating follicular activation in the context of fertility preservation and/or infertility at large.
Introduction
Cancer remains among the leading causes of death in the developed world, yet decades of research have yielded significant progress for most types of cancer, and in some cases nearly doubled survival rates1. Unfortunately, chemotherapeutic agents are often gonadotoxic, depleting the reserve of primordial follicles in ovaries and reducing fertility2. This growing population can benefit from various methods of fertility preservation including oocyte and/or embryo cryopreservation, however, patients requiring prompt initiation of cancer therapy and pre-pubertal patients are ineligible for these options. As an alternative, some patients have chosen to cryopreserve ovarian tissue before undertaking their therapeutic regimen, and upon recovery and remission, auto-transplanting tissue to restore fertility3. Yet, to date, graft survival and follicular output following auto-transplantation remain relatively low4, mainly due to tissue ischemia and hypoxia5,6,7. Despite numerous efforts to improve the viability of ovarian cortical grafts using anti-oxidants8,9, pro-angiogenic cytokines10,11,12,13, or mechanical manipulations14, graft ischemia in a 5 to 7 day window post-transplant undermines the viability and survival of the graft7. To address this, we developed a cell-based strategy to facilitate anastomosis of host and graft vessels and thus hasten reperfusion of ovarian tissue.
In addition to the ischemic insult to grafted ovarian tissue in the post-transplant window, the disruption of inter-follicular signaling may contribute to depletion of the pool15,16. Because exogenous endothelial cells (ExECs) contribute to stable and functioning vessels in the periphery of the graft, they present a unique opportunity to convey a defined molecular input to transplanted tissue. As a proof of principle, ExECs were engineered to express super-physiological levels of Anti-Mullerian hormone (AMH), a member of the transforming growth factor beta (TGFβ) superfamily that has been shown to restrict follicular growth17. Comparison of follicular distribution in grafts co-transplanted with control and AMH-expressing cells verifies the biological activity and potency of engineered exECs.
In summary, by improving graft viability and suppressing premature mobilization of the follicular pool, this approach can increase the productivity of auto-transplanted ovarian tissue in patients undergoing fertility preservation. Moreover, the ExEC-based platform enables experimental interrogation of molecular regulators that have been implicated in follicular development.
Protocol
All procedures involving animal subjects have been approved by the Institutional Animal Care and Use Committee (IACUC) at Weill Cornell Medical College. All xenotransplantation experiments using ovarian tissue were performed in accordance with relevant guidelines and regulations. Human ovarian tissue was collected from patients scheduled for chemotherapy or radiotherapy for cancer treatment or prior bone marrow transplantation. The institutional review board (IRB) Committee of Weill Cornell Medical College approved the collection of tissue for potential autologous use, and upon the patient's informed consent a donation of up to 10% of their ovarian tissue for research use was performed.
1. Collection of Human Ovarian Tissue
NOTE: When an ovarian tissue is transported from a remote facility transit, time should not exceed 5 h18,19.
- Collect the ovarian tissue and rinse with a sterile saline solution.
- Place the ovary in a sterile container.
- Pour Leibovitz's L-15 medium until the ovary is completely immersed in the medium.
- Close and seal the container.
- Transport the container on ice.
2. Processing the Procured Ovarian Tissue, Adapted from Schmidt et al.18
- Preparations for ovarian processing and freezing
- Prepare 100 mL of medium for processing: Leibovitz's L-15 medium 99 mL + 1 mL antibiotic-antimycotic solution. Filter media using 0.2 µm filter. Keep the medium refrigerated.
- Prepare 100 mL of freezing solution using DMSO as a cryo-protectant. Add 69.64 mL Leibovitz's L-15 medium, 17.66 mL fetal bovine serum (FBS), 3.42 g of sucrose (to create a final concentration of 0.1 mol/L), 10.65 mL DMSO (to create a final concentration of 1.5 mol/L), and 1 mL antibiotic-antimycotic solution. Filter the medium using a 150 mL filter unit, 0.2 µm. Store the medium at 4 °C.
- Sterilize the surgical tools using an autoclave programmed for a wrapped solids sterilization cycle.
- Upon arrival of the tissue
- Set the sterile surgical tools in the biosafety cabinet: scalpel with blade number 21, sharp fine curved scissors and forceps at varied sizes: long (about 150 mm length) and 2 medium-sized (about 110 mm length).
- Wear sterile gloves, open the container within the biosafety cabinet. Take the ovary and place it in a 150 mm Petri dish and pour cold medium prepared in step 2.1.1 on top of the ovary to prevent dehydration of the ovarian tissue.
- Isolate the ovary from any residual tissue and rinse it with cold medium until it's devoid of tissue and blood.
- Place the ovary in a clean 150 mm Petri dish, add cold medium, prepared in step 2.1.1 until the ovary is half submerged in it.
- Dissection of the ovarian tissue
- Bisect the ovary and remove the medulla first by sharp dissection, using curved fine scissors. Then scrape the medulla away, using a sterile scalpel with a blade number 21. Precede until the cortical tissue is 1-1.5 mm in thickness.
- Cut the cortical tissue into slivers of 2-3 mm in width, the length of the strip will be the entire length of the ovarian piece that was processed.
3. Ovarian Tissue Slow Freezing, Adapted from Newton et al. and Oktay et al.6,20
- Preparation for freezing
- Label cryovials (1.8 mL).
- Add 1.5 mL of the freezing solution prepared in step 2.1.2 to each vial.
- Transfer one cortical strip per cryogenic vial containing the freezing solution.
- Equilibrate the cortical strip for 20 min on a rotating plate, apply gentle agitation at 4 °C.
- Slow freezing of ovarian tissue
- Load the cryovials into a programmable planer freezer starting at 0 °C.
- Cool at 2 °C/min to -7 °C.
- Keep the tissues at this constant temperature for 10 min.
- Perform manual seeding for ice crystal nucleation induction, by touching each cryovial with a cotton tip immersed in liquid nitrogen (LN2).
- Continue to cool at 0.3 °C/min until sample temperature reaches -40 °C.
- Cool at a faster rate of 10 °C/min to -140 °C.
- Transfer cryovials to the dewar for storage in LN2 (-196 °C).
4. Preparations for the Surgeries (Bilateral Oophorectomy and Co-transplantation)
- Preparation of plates
- A day prior to thawing the ovarian tissue for transplantation
- Place a piece of a plastic paraffin film at the bottom of a 50 mm Petri dish, spray it with 70% Ethanol until it will be completely covered.
- Leave the Petri dishes overnight in the biosafety cabinet. Prepare 2 Petri dishes per mouse.
- At the day of surgeries
- Aspirate the ethanol from the Petri dish containing the plastic paraffin film within the biosafety cabinet.
- Leave the Petri dish lead half open until ethanol evaporates completely.
- Close the lid of the Petri dish when the plastic paraffin film is completely dry. Keep it within the biosafety cabinet.
- Label wells of a 6 well plate accordingly, 0.1 mol/L Sucrose+ 1 mol/L DMSO, 0.1 mol/L Sucrose+ 0.5 mol/L DMSO, 0.1 mol/L Sucrose, Basic Thawing Solution (BTS), Medium.
- A day prior to thawing the ovarian tissue for transplantation
- Preparation of the solutions
- Prepare 100 mL of BTS: Leibovitz's L-15 medium 79 mL + FBS 20 mL + Antibiotic-Antimycotic solution 1 mL. Filter with a 0.22 µm filter system.
- Prepare 10 mL of BTS with 0.1 mol/L Sucrose. Scale 0.342 g of Sucrose and add 10 mL of BTS prepared in step 4.2.1, Agitate gently until the Sucrose is completely dissolved. Filter the solution using a syringe filter 0.22 µm.
- Prepare the solutions according to Table 1. Cover tubes containing DMSO with aluminum foil. Keep refrigerated until use.
5. Ovarian Tissue Rapid Thawing
- Take out of the LN2 dewar a vial containing frozen ovarian tissue and keep it at room temperature for 30 s.
- Wipe the vial clean using a tissue paper.
- Immerse the vial in a 30 °C water bath for 1-2 min until its' content is thawed.
- Open the vial and place the cortical strip in the first well that contains 3ml of the first solution (0.1 mol/L Sucrose+ 1 mol/L DMSO, prepared in step 4.2.3).
NOTE: All steps involving opening the lid of the plate will be done under laminar flow. - Incubate the 6 well plate on a rotating plate at 4 °C for 5 min. Keep the plate covered with aluminum foil for this step.
- Transfer the cortical strip into the second well containing 3 mL of the second solution (0.1 mol/L Sucrose+ 0.5 mol/L DMSO, prepared in step 4.2.3).
- Incubate the 6 well plate on a rotating plate for gentle agitation at 4 °C for 5 min. Keep the plate covered with aluminum foil for this step.
- Transfer the cortical strip into the third well, containing 4 mL of solution (BTS with 0.1 mol/L Sucrose, prepared in step 4.2.2).
- Incubate on a rotating plate for gentle agitation at 4 °C for 5 min.
- Transfer the cortical strip into the fourth well containing 4 mL of solution (BTS, prepared in step 4.2.1).
- Incubate on a rotating plate for gentle agitation at 4 °C for 5 min.
- Transfer the cortical strip into the last well containing 4 mL of cold medium (prepared in step 2.1.1). Keep thawed ovarian tissue on ice until performing the transplantation.
6. Encapsulation of the Ovarian Tissue
- Prepare the following solutions
- Prepare 25 mL of 20 mmol/L HEPES buffer in 0.9% saline. Filter and store at 4 °C.
- Prepare 1 mL of CaCl2 at the concentration of 1 mol/L. Filter and store at 4 °C.
- Prepare a Fibrinogen 50 mg/mL stock solution
- Add 1 g of Fibrinogen into 20 mL of 20 mmol/L HEPES buffer in 0.9% saline by slowly mixing fibrinogen into the HEPES buffered saline over several hours at 37 °C.
- Label 1.7 mL micro-centrifuge tubes.
- Filter the solution through a 0.45 µm syringe filter and then through a 0.2 µm syringe filter.
- Aliquot the solution into 200 µL into micro-centrifuge tube and store at -20 °C.
- Prepare a Thrombin 100 U/mL stock solution
NOTE: Thrombin solutions adsorb to glass, aliquot the solution in plastic tubes/vials.- Add 2.5 mL of 0.9% sterile saline to 250 U of Thrombin.
- Gentle shake until the solution to completely dissolve.
- Label 1.7 mL micro-centrifuge tubes.
- Filter through a 0.2 µm syringe filter, aliquot 50 µL into micro-centrifuge tubes and store at -80 °C.
- Make a Fibrin clot of 70 µL, obtaining a final concentration of 10 mg/mL fibrinogen and 5 U/mL Thrombin
NOTE: Make sure to work fast, the solution clots in a few seconds. Also, avoid the addition of bubbles to the mixture.- Prepare a Fibrinogen solution in a 1.7 mL micro-centrifuge tube.
- Add 360 µL of 20 mmol/L HEPES Buffer in 0.9% saline solution to the aliquoted 200 µL of the Fibrinogen stock, prepared in step 6.2.4.
- Mix by gentle pipetting.
- Keep it on ice.
- Prepare a Thrombin solution in a second micro-centrifuge tube.
- Add 148.7 µL of DMEM to the aliquoted 50 µL of the Thrombin stock, prepared in step 6.3.4.
- Mix by gentle pipetting.
- Add 1.3 µL of 1 mol/L CaCl2.
- Mix by gentle pipetting.
- Keep it on ice.
- Prepare a single cell suspension, In a third micro-centrifuge tube.
- Detach the engineered endothelial cells from the plate using an enzyme cell detachment medium.
- Spin down the and count the cells using a hemocytometer with a cover glass.
- Use 20,000 cells per every 1 mm2 of ovarian tissue. Calculate 20,000x area of ovarian tissue in mm2.
- Spin down the engineered endothelial cells and re-suspend it in basic medium (DMEM) to reach a total volume of 16.8 µL.
- Keep it on ice.
- Place a piece of ovarian tissue on a sterile gauze sponge to dry it for a few seconds.
- Place the piece of ovarian tissue on top of the plastic paraffin film within the 50 mm Petri dish.
- Add 39.2 µL of the Fibrinogen solution, prepared in step 6.4.1.2, into the cell suspension prepared in step 6.4.3.4, mix by gentle pipetting. Keep it on ice.
- Add 14 µL of the Thrombin solution prepared in step 6.4.2.4. Mix gently by pipetting once. Work fast.
- Place the mixture on top of the ovarian tissue, pipet it in the form of an elongated droplet.
- Place the Petri dish with the clot in the incubator at 37 °C.
- Prepare a Fibrinogen solution in a 1.7 mL micro-centrifuge tube.
7. Bilateral Oophorectomy and Co-transplantation of Human Ovarian Tissue with Engineered Endothelial Cells to NSG Mice
NOTE: Ten to fourteen-week-old female NSG mice21 were used (Jackson Labs).
- Prepare all surgical tools, as elaborated in step 2.1.3, make sure you have all sutures, pads, and surgical tapes handy.
- Anesthetize the mouse using an anesthesia system with Isoflurane.
- Place the mouse in the induction chamber, close lid and open the appropriate stopcock.
- Open flowmeter to 1,000 mL/min. Turn on the vaporizer and set it to deliver 2-3.5%.
- Observe effects of anesthesia; loss of consciousness, slow and regular breaths.
- Transfer to the nose cone to maintain anesthesia. Turn the vaporizer to deliver 1-3%, depending on vital signs.
- Verify absence of pedal or tail reflex. If the reflex is present, increase isoflurane until it's absent.
- Trim the mouse's back hair, from the tail up to the clavicles line, using an electric hair trimmer.
- Place the mouse in a prone position on the surgical platform.
- Fix the nose cone to the surgical platform using a surgical tape.
- Tape the mouse's limbs gently to the surgical platform using a 1.25 cm-wide surgical paper tape.
- Use a sterile lubricant jelly and insert a thermometer PR. Fix the thermometer by taping it to the surgical platform using a 1.25 cm wide perforated plastic surgical tape.
- Tape the tail to the surgical platform by using a 2.5 cm wide surgical paper tape.
- Heat, using an infrared or a hot water heating pad, and monitor the mouse's body temperature throughout the procedure. Keep body temperature within the range of 35-37 °C.
- Clean the trimmed area with a sterile Povidone-Iodine Solution swab stick and wipe using sterile alcohol prep.
- Repeat step 6.9 twice more.
- Place a drop of sterile ocular lubricant vet ointment over each of the mouse's eyes to protect from dehydration and damage to the cornea.
- Cover the mouse using a sterile surgical drape.
- Inject Buprenorphine (1 mg/Kg) sub-cutaneous (S/C).
- Perform a longitudinal medial dorsal incision using a scalpel (blade #21).
- Perform a bilateral oophorectomy, use a dorsal approach.
- Free the subcutaneous connective tissue by blunt dissection using the scissors.
- Pinch the fascia laterally to the midline make an incision and reach the peritoneal cavity using the sharp scissors.
- Grab the ovarian fat pad and the ovary gently with tweezers and pull it out of the abdominal cavity.
- Grasp the ovary and the fat pad with a vascular clamp.
- Ligate the ovary and the fat pad using a 4/0 monofilament absorbable suture at the base of the ovary, distal to the fallopian tube.
- Clip the ovary distal to the tie. Make sure there is no bleeding from the base of the stump.
- Place the tissue back into the abdominal cavity and suture the fascia using a 6/0 braided absorbable suture.
- Repeat stages 7.15.1-7.15.7 at the contralateral side.
- Co-transplant the ovarian tissue.
- Perform a horizontal incision in the fascia above the Gluteus Maximus, at the length that fits the clots dimensions. Create a pocket within this virtual space by opening the scissors underneath the fascia.
- Pick up one piece of encapsulated cortical tissue, as prepared in step 6.4.8 and place it in this pocket.
- Suture the fascia using a 6/0 braided absorbable suture.
- Repeat stages 7.16.1-7.16.3 at the contralateral side as well.
- Close the dorsal wall using simple interrupted stitches with a 4/0 monofilament absorbable suture.
- Inject Lidocaine 0.5% (1.2 mL/Kg) S/C at the incision site.
- Use a sterile alcohol prep to clean the skin.
- Turn off the isoflurane while monitoring the mouse's temperature.
- Provide 1-2 min of O2, without Isoflurane. Keep on warming the mouse until it starts to move and return to consciousness.
- Place the mouse in a clean recovery cage and later house the mouse in a separate cage until the complete healing of the surgical wound.
- Inject Buprenorphine (1 mg/Kg) S/C as needed every 8-12 h, for 24 h postoperatively.
- Keep the mice in separate cages when all food, water, bedding, and cages are autoclaved, until the end point of the experiment. Keep the cages in a pressurized ventilated room. Use personal protective equipment whenever handling the mice.
Results
To determine whether co-transplantation of ExECs provides a benefit to patients' tissue, thawed ovarian cortical strips were divided into equal sized pieces and engrafted bilaterally into immuno-compromised, NOD scid gamma (NSG), mice. With one side embedded in a fibrin clot alone (no ECs) and the other containing ExECs (Figure 1a), each mouse served as its own control. ExECs were obtained via isolation of primary endothelium from human umbilical cords and subsequent treatment with Adenoviral gene fragment E4-ORF1, as previously described22,23. Within passages 2-5, human umbilical vein ECs (hUVEC) were treated with lentiviral particles that encode constitutive expression cDNA encoding the adenoviral gene fragment E4-ORF1. This treatment enhances the survival and the angiogenic potential of the endothelium as previously described22,23. After two weeks, functionally perfused vessels were formed from GFP-labeled exECs at the interface of host tissue and the graft (Figure 1b). In order to label functional blood vessels, mice were injected with 100 mL lectin (0.5 mg/mL) under isoflurane anesthesia 10 minutes prior to harvesting the tissue. Quantification of follicles at 2 weeks following transplant demonstrated a significant benefit to relative follicle count in ExECs-assisted grafts that was clearly evident at two weeks (Figure 1c). Exogenous ECs formed functional vessels when co-transplanted with ovarian tissue (Figure 1b) and cortical pieces co-transplanted with the mouse or human ExECs increased the number of surviving follicles relative to control grafts (Figure 1c). This benefit was linked to the decreased fibrotic area in ExECs-assisted grafts (Figure 1d) — from each transplanted graft, 3 sections were stained with Trichrome, an established means of delineating the fibrotic tissue24, to evaluate fibrotic area: a middle section and a 600 µm depth section from the upper and lower sides of the graft. Stained sections were scanned and analyzed using ImageJ to quantify the surface area and the fibrotic area was manually outlined and quantified as a percentage of the entire graft area (ImageJ software). Final values were calculated for each graft as the average of the 3 sections analyzed. Importantly, grafts that were co-transplanted with human foreskin fibroblasts showed poor tissue viability and relatively few follicles. (Figure 1e).
We next assessed the long-term function of ovarian tissue grafts with and without ExECs (Figure 2a, d, f, h). Following 14 weeks, mice were stimulated daily with menotropins for variable lengths of time before animals were sacrificed, with the progression of follicle growth being monitored in two mice via MRI (Figure 2b-c). Developing follicles were noted in both control (Figure 2e) and ExECs-assisted grafts (Figure 2g, i). More and larger sized follicles were noticed in the ExECs-assisted grafts (Figure 2g, i). Compared to antral follicles derived from the same patient's tissue, stimulated with menotropins and co-transplanted with ExECs, the granulosa cell layer in the more advanced follicle displayed increased expression of the ovulatory markers CD4425 and HABP126, as well as increased cell-death (Caspase), and reduced proliferation (Ki67) (Figure 2j).
Several studies have shown that the pool of follicles is prematurely activated following graft of ovarian tissue27,28,29,30. We observed a similar trend in multiple grafts from a single patient at 2, 3 and 14 weeks (Figure 3a). To capitalize on the presumed function of AMH in repressing activation and/or growth of follicles17,31, we engineered ExECs with lentivirus to constitutively express and thus provide a direct paracrine source of secrete AMH to transplanted ovarian tissue (Figure 3b). Lentiviral transduction increased 100-fold above GC in ExEC which otherwise expressed undetectable amounts of AMH. Granulosa cells tumor cells, on the other hand, secreted a basal level of AMH in the cell culture supernatant. (Figure 3c). Two weeks after co-transplantation, vessels derived from ExECs were observed at the host-graft interface and immunostaining revealed abundant AMH protein in the lumen of vessels derived from AMH-ExECs (Figure 3d) relative to vessels formed from control ExECs. In order to test the function of AMH independently from the pro-angiogenic influence of ExECs, we used mesenchymal stem cells (MSC) that were isolated from fragments of the ovarian medulla. These cells were transduced with lentiviral particles encoding AMH and expanded in culture for use in co-transplantation. Upon co-transplantation with AMH-ExECs, a 2-fold increase was observed in the proportion of primordial follicles. This, however, leads to a decrease in the percentage of primary follicles. AMH-MSCs lead to increased retention of primordial follicles by 10-fold relative to control MSCs (Figure 3f, h). The most significant benefit to the retention of the quiescent follicular pool was conferred by AMH-ECs when a comparison was made between MSCs, ExECs, non-cellular grafts (Ctl), AMH-MSCs ExEC and AMH-ExECs (Figure 3i).
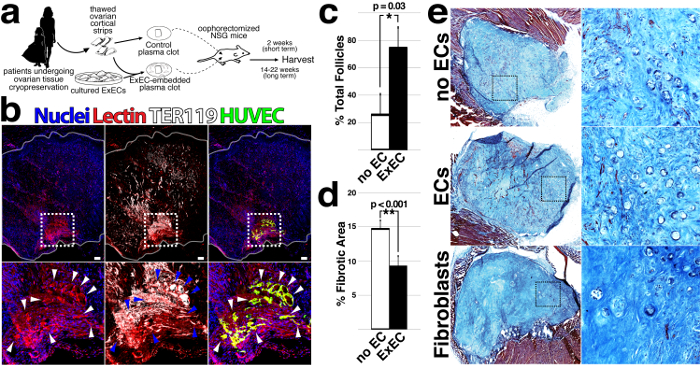
Figure 1: Co-transplantation of ovarian cortical strips with ExECs improves the viability and preserves the follicular pool. (a) Scheme of the experimental design. Frozen-thawed human ovarian tissue was encapsulated in a fibrin clot, with or without ExECs. The clots were transplanted into oophorectomized NSG mice and harvested at the end point of the experiment. (b) Human cortical grafts co-transplanted with hUVEC-derived ExECs (green); red blood cells are labeled by TER-119 and boundaries of the graft are outlined in white. (c) The median percentage of total follicles from transplantation with and without the mouse or human exECs + MAD. *P <0.05. (d) The median percentage of the fibrotic area from transplantation with and without the mouse or human ExECs + MAD. **P <0.001. (e) Representative sections of ovarian grafts co-transplanted with ExECs, without cells, and with human foreskin fibroblasts. This figure has been modified from Man et al. Sci Rep. 2017 Aug 15;7(1):8203. doi: 10.1038/s41598-017-08491-z. Please click here to view a larger version of this figure.
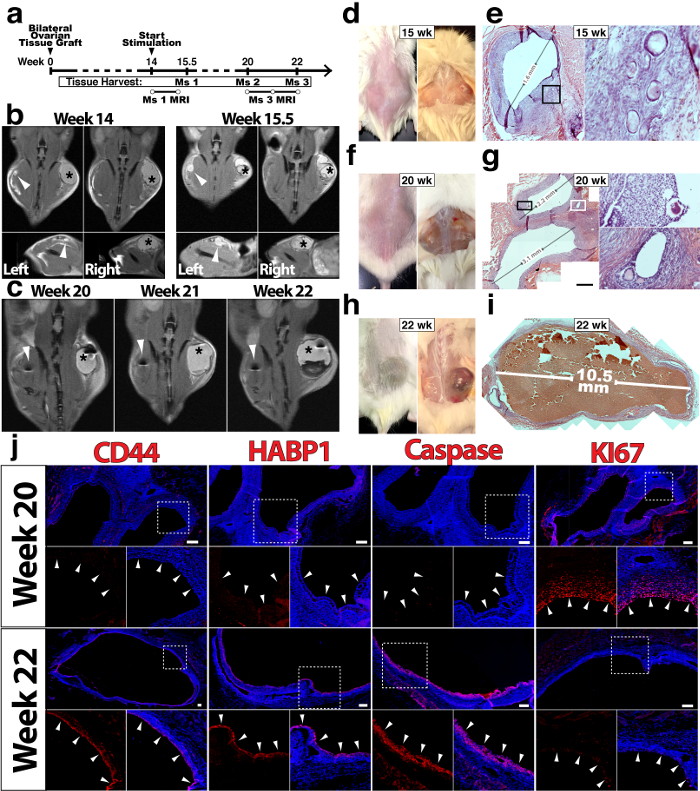
Figure 2: Long-term viability and function of ovarian tissue grafts are improved by exECs. In figures b, c, d, f, and h the grafts on the left are the control-no ECs, while on the right side the grafts co-transplanted with ExECs. (a) Experimental scheme for long-term xenograft of ovarian cortical tissue. (b) In figures b and c, the asterisk (right side) represents the ovarian tissue co-transplanted with ECs, while the arrowhead (left side) represents the ovarian tissue transplanted with no cells. Mouse #1 was xenografted with tissue from a 6 year-old donor and monitored by MRI at the onset of stimulation (14 weeks, left) and again after ten days of stimulation (15.5 weeks, right). (c) Mouse #3 was xenografted with tissue from a 19 year-old donor and monitored by MRI at 6 (20 weeks post-transplant), 7 (21 w), and 8 (22 w) weeks following the onset of stimulation. (d) Macroscopic image of the engrafted human ovarian tissue harvested at 15.5 weeks Mouse #1, the graft on the right side is the ExEC-assisted graft and a histological view of the control graft is shown in (e). (f) Macroscopic image of the grafts, mouse #2 was sacrificed after 20 weeks and control and exEC-assisted grafts were harvested for histological analysis; the ExEC-assisted graft is shown in (g). (h) Macroscopic image of the grafts in mouse #3 which was sacrificed after 22 weeks, histological analysis of the ExEC-assisted graft is shown in (i). (j) Sections of the ExEC-assisted grafts from Mouse #2 and Mouse #3 were stained for molecular markers and are enlarged in the associated box. Scale bars = 100 µm. This figure has been modified from Man et al. Sci Rep. 2017 Aug 15;7(1):8203. doi: 10.1038/s41598-017-08491-z. Please click here to view a larger version of this figure.
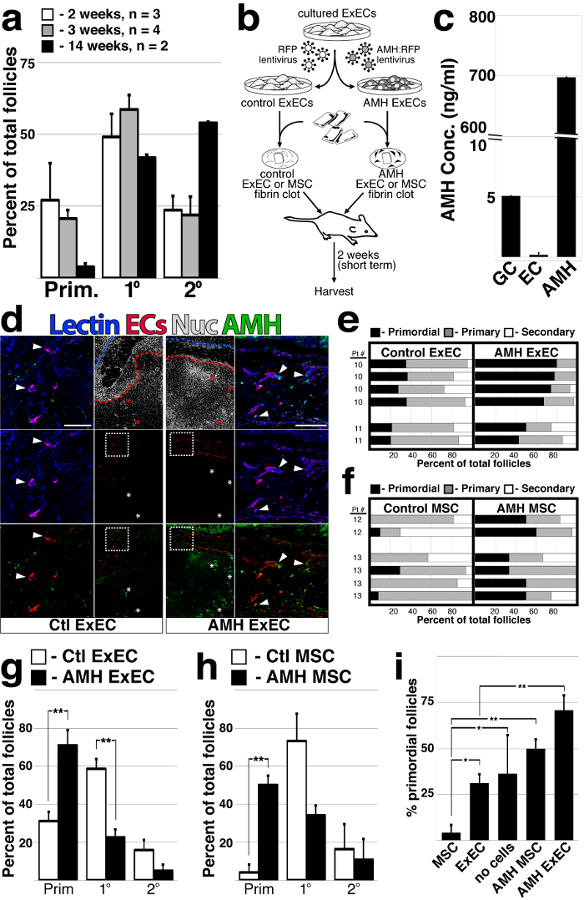
Figure 3: ExECs engineered to express AMH preserve a quiescent follicular pool. (a) The proportion of follicles was quantified for multiple ovarian tissue fragments from the same patient that were co-transplanted with ECs for long and short-term intervals; n = 3 at 2 weeks, n = 4 at 3 weeks and n = 2 at 14 weeks. (b) Scheme of the experimental design. Frozen-thawed human ovarian tissue was encapsulated in a fibrin clot, with either ExECs/MSCs transduced with an RFP lentiviral particle serving as a control, or ExECs/MSCs transduced with an AMH-mCherry lentiviral particle generating AMH-ECs/MSCs. The clots were transplanted into oophorectomized NSG mice and harvested at 2 weeks. (c) ExECs were transduced with lentivirus encoding secreted human AMH; cell culture supernatant of AMH-transduced exECs was compared to COV-434 culture granulosa cell tumor line and control ExECs. (d) Two weeks after transplant, ovarian tissue fragments that were co-transplanted with either ECs (left) or AMH-ExECs (right) were stained with an antibody specific for AMH protein. (e) The relative proportion of follicles in xenografts co-transplanted with control and AMH-ExECs was quantified after 2 weeks (n = 6). (f) The relative proportion of follicles in xenografts co-transplanted with control and AMH-MSCs was quantified after 2 weeks (n = 6). (g) The median + MAD of the relative proportion of follicles was compared in xenografts transplanted with control and AMH-transduced ExECs (n = 6) following 2 weeks. (h) The median + MAD relative proportion of follicles was compared in xenografts transplanted with control and AMH-transduced MSCs (n = 6) following 2 weeks. (i) The median percentage of the observed primordial follicles per graft in xenografts transplanted with MSCs (n = 6), ExECs (n = 6), AMH-MSCs (n = 6), and AMH-ExECs (n = 6) was compared in aggregate to control conditions (no cells, n = 15). Insets in (d) are enlarged in the boxes to the right for AMH-ExECs and to the lest for Ctl ExECs; red and blue stroke lines in (d) outline ovarian tissue and host tissue, respectively. Error bars in (c) represent standard deviation between 3 replicates. Error bars in (a, g-i) represent MAD between the number of replicates listed or shown in the graph. Scale bar = 100 µm (d). *P <0.05, **P <0.005. This figure has been modified from Man et al. Sci Rep. 2017 Aug 15;7(1):8203. doi: 10.1038/s41598-017-08491-z. Please click here to view a larger version of this figure.
| Solution | Sucrose-BTS (prepared in step 4.2.2) in μL | DMSO in μL |
| Sucrose-BTS with 1 mol/L DMSO | 2787 | 213 |
| Sucrose-BTS with 0.5 mol/L DMSO | 2894 | 106 |
Table 1: Sucrose solution preparation.
Discussion
Here we demonstrate that co-transplantation of exECs provides a significant benefit to ovarian tissue viability and function following xenograft in mice. Standards for clinical application of ovarian tissue auto-transplantation for fertility preservation have not been set and the optimal parameters (size, transplantation site, duration of graft, etc.)32,33,34 for enhanced recovery of the follicular pool remain undefined. When auto-transplantation is performed, avascular grafting of thawed cortical ovarian tissue is performed mainly in pelvic sites such as the remaining ovary, ovarian fossa, or broad ligament35,36. Since no end-to-end anastomosis takes place, this transplantation method results in a wave of ischemic tissue loss and premature activation of follicles residing within the graft. Therefore, while co-transplantation with exECs entails delivery of proliferative endothelial cells that require much further scrutiny before being considering for clinical application, this approach can expedite tissue revascularization and may salvage a robust proportion of follicles within ovarian grafts.
These findings put forth a novel vascular cell-based strategy for optimizing ovarian tissue viability and function following transplantation. Given the growing pool of patients opting to cryopreserve ovarian tissue and recent calls for ovarian tissue transplantation to move from experimental status to open clinical application37,38, this method may offer a therapeutic strategy that enables greater viability of grafts, thereby reducing the number of ovarian cortical strips that must be transplanted and increasing their longevity and/or function.
Premature recruitment, or "burnout", has also been linked to the depletion of the follicular pool during chemotherapy39, as well as following auto transplantation of ovarian tissue34. Numerous studies have identified signaling pathways that function to activate of suppressing follicular mobilization, and the disruption of this regulatory function can result in a mass activation of the follicular pool during a critical ischemic window when the metabolic needs of nascent follicles are unable to be met. Application of exECs in this context would not only accelerate reperfusion but due to their engraftment potential, exECs can also be engineered to provide a direct paracrine supply of factors that direct follicular mobilization. The notion of utilizing AMH as a modulator of follicular growth has been applied by other groups as well. Kano et al. delivered AMH via either osmotic pumps containing recombinant protein or IP injection of viral particles40. These approaches resulted in a similar trend in the retention of primordial follicles, but the delivery was systemic. As an alternative, exECs secreting AMH provide a local and sustained source of AMH, however, the incorporation of engineered vascular cells in ovarian tissue grafts is limited by myriad risks associated with cell-based therapies. Immune response to foreign antigens on exECs is possible and use of proliferative cells raises the possibility of cells circulating, implanting and fostering neoplastic growth elsewhere in the body. While these limitations preclude translation of this approach for current patients undergoing auto-transplantation, these experiments substantiate the potential for pro-angiogenic influences and repression of premature follicular mobilization to augment the output of ovarian tissue grafts and establish a robust xenograft model for the mechanistic study of human ovarian physiology.
Disclosures
Michael Ginsberg is an employee of Angiocrine Biosciences, Inc., San Diego, CA, 92130, United States, that isolated, transfected with E4-ORF- 1 and labeled the endothelial cells we used.
Acknowledgements
Omar Alexander Man for the illustrations.
L.M. was supported by a Pilot Award from the Cornell Clinical and Translational Science Center and an ASRM research grant.
The authors would like to thank James lab members for critical reading of the manuscript.
Materials
| Name | Company | Catalog Number | Comments |
|---|---|---|---|
| Leibovitz’s L-15 medium | Gibco | 11415064 | |
| Antibiotic-Antimycotic | Gibco | 15240062 | Anti-Anti X100 |
| Sucrose | Sigma | S 1888 | |
| Fibrinogen | Sigma | F 8630 | from bovine plasma |
| Thrombin | Sigma | T 1063 | from human plasma |
| DMSO | Sigma | D 2650 | |
| DMEM | Gibco | 12491015 | |
| Enzyme Cell Detachment Medium | Invitrogen | 00-4555-56 | Accutase |
| Plastic paraffin film | Bemis NA | Parafilm M | |
| Surgical paper tape 2.5 cm | 3M | 1530-1 | Micropore |
| Surgical Paper tape 1.25 cm | 3M | 1530-0 | Micropore |
| Perforated plastic Surgical tape 1.25 cm | 3M | 1527-0 | Transpore |
| Monofilament Absorbable Suture | Covidien | UM-203 | Biosyn |
| Braided Absorbable Suture | Covidien | GL-889 | Polysorb |
| Povidone-iodine Solution USP 10% | Purdue Products | 67618-153-01 | Betadine Solution Swab Stick |
| Cryoviales | Nunc | 377267 | CryoTube |
| sterile ocular lubricant | Dechra | 17033-211-38 | Puralube |
| 1.7 ml micro-centrifuge tube | Denville | C-2172 | Eppendorf |
| Anasthesia system | VetEquip | V-1 table top system with scavenging | |
| Endothelial cells | Angiocrine Biosciences, Inc., San Diego, CA, USA | Isolated, transfected with E4-ORF- 1 and labeled endothelial cells | |
| Trichrome stain | Sigma | HT15-1kt | Trichrome Stain (Masson) Kit |
| Isolectin | Invitrogen | I32450 | isolectin GS-IB4 From Griffonia simplicifolia, Alexa Fluor™ 647 Conjugate |
References
- Siegel, R. L., Miller, K. D., Jemal, A. Cancer Statistics, 2017. CA Cancer J Clin. 67 (1), 7-30 (2017).
- Magelssen, H., Melve, K. K., Skjaerven, R., Fossa, S. D. Parenthood probability and pregnancy outcome in patients with a cancer diagnosis during adolescence and young adulthood. Hum Reprod. 23 (1), 178-186 (2008).
- Donnez, J., Dolmans, M. M., Diaz, C., Pellicer, A. Ovarian cortex transplantation: time to move on from experimental studies to open clinical application. Fertil Steril. 104 (5), 1097-1098 (2015).
- Stoop, D., Cobo, A., Silber, S. Fertility preservation for age-related fertility decline. Lancet. 384 (9950), 1311-1319 (2014).
- Aubard, Y., et al. Orthotopic and heterotopic autografts of frozen-thawed ovarian cortex in sheep. Hum Reprod. 14 (8), 2149-2154 (1999).
- Newton, H., Aubard, Y., Rutherford, A., Sharma, V., Gosden, R. Low temperature storage and grafting of human ovarian tissue. Hum Reprod. 11 (7), 1487-1491 (1996).
- Van Eyck, A. S., et al. Electron paramagnetic resonance as a tool to evaluate human ovarian tissue reoxygenation after xenografting. Fertil Steril. 92 (1), 374-381 (2009).
- Nugent, D., Newton, H., Gallivan, L., Gosden, R. G. Protective effect of vitamin E on ischaemia-reperfusion injury in ovarian grafts. J Reprod Fertil. 114 (2), 341-346 (1998).
- Kim, S. S., et al. Quantitative assessment of ischemic tissue damage in ovarian cortical tissue with or without antioxidant (ascorbic acid) treatment. Fertil Steril. 82 (3), 679-685 (2004).
- Abir, R., et al. Improving posttransplantation survival of human ovarian tissue by treating the host and graft. Fertil Steril. 95 (4), 1205-1210 (2011).
- Friedman, O., et al. Possible improvements in human ovarian grafting by various host and graft treatments. Hum Reprod. 27 (2), 474-482 (2012).
- Shikanov, A., et al. Fibrin encapsulation and vascular endothelial growth factor delivery promotes ovarian graft survival in mice. Tissue Eng Part A. 17 (23-24), 3095-3104 (2011).
- Soleimani, R., Heytens, E., Oktay, K. Enhancement of neoangiogenesis and follicle survival by sphingosine-1-phosphate in human ovarian tissue xenotransplants. PLoS One. 6 (4), e19475(2011).
- Israely, T., Dafni, H., Nevo, N., Tsafriri, A., Neeman, M. Angiogenesis in ectopic ovarian xenotransplantation: multiparameter characterization of the neovasculature by dynamic contrast-enhanced MRI. Magn Reson Med. 52 (4), 741-750 (2004).
- Buratini, J., Price, C. A. Follicular somatic cell factors and follicle development. Reprod Fertil Dev. 23 (1), 32-39 (2011).
- Dunlop, C. E., Anderson, R. A. The regulation and assessment of follicular growth. Scand J Clin Lab Invest Suppl. 244, discussion 17 13-17 (2014).
- Durlinger, A. L., et al. Control of primordial follicle recruitment by anti-Müllerian hormone in the mouse ovary. Endocrinology. 140 (12), 5789-5796 (1999).
- Schmidt, K. L., Ernst, E., Byskov, A. G., Nyboe Andersen, A., Yding Andersen, C. Survival of primordial follicles following prolonged transportation of ovarian tissue prior to cryopreservation. Hum Reprod. 18 (12), 2654-2659 (2003).
- Jensen, A. K., et al. Outcomes of transplantations of cryopreserved ovarian tissue to 41 women in Denmark. Hum Reprod. 30 (12), 2838-2845 (2015).
- Oktay, K., Newton, H., Aubard, Y., Salha, O., Gosden, R. G. Cryopreservation of immature human oocytes and ovarian tissue: an emerging technology? Fertil Steril. 69 (1), 1-7 (1998).
- Shultz, L. D., et al. Human lymphoid and myeloid cell development in NOD/LtSz-scid IL2R gamma null mice engrafted with mobilized human hemopoietic stem cells. J Immunol. 174 (10), 6477-6489 (2005).
- Ramalingam, R., Rafii, S., Worgall, S., Brough, D. E., Crystal, R. G. E1(-)E4(+) adenoviral gene transfer vectors function as a "pro-life" signal to promote survival of primary human endothelial cells. Blood. 93 (9), 2936-2944 (1999).
- Seandel, M., et al. Generation of a functional and durable vascular niche by the adenoviral E4ORF1 gene. Proc Natl Acad Sci U S A. 105 (49), 19288-19293 (2008).
- Meirow, D., et al. Cortical fibrosis and blood-vessels damage in human ovaries exposed to chemotherapy. Potential mechanisms of ovarian injury. Hum Reprod. 22 (6), 1626-1633 (2007).
- Assidi, M., et al. Identification of potential markers of oocyte competence expressed in bovine cumulus cells matured with follicle-stimulating hormone and/or phorbol myristate acetate in vitro. Biol Reprod. 79 (2), 209-222 (2008).
- Thakur, S. C., Datta, K. Higher expression of hyaluronan binding protein 1 (HABP1/p32/gC1qR/SF2) during follicular development and cumulus oocyte complex maturation in rat. Mol Reprod Dev. 75 (3), 429-438 (2008).
- Dolmans, M. M., et al. Short-term transplantation of isolated human ovarian follicles and cortical tissue into nude mice. Reproduction. 134 (2), 253-262 (2007).
- Amorim, C. A., et al. Impact of freezing and thawing of human ovarian tissue on follicular growth after long-term xenotransplantation. J Assist Reprod Genet. 28 (12), 1157-1165 (2011).
- Kawamura, K., et al. Hippo signaling disruption and Akt stimulation of ovarian follicles for infertility treatment. Proc Natl Acad Sci U S A. 110 (43), 17474-17479 (2013).
- Suzuki, N., et al. Successful fertility preservation following ovarian tissue vitrification in patients with primary ovarian insufficiency. Hum Reprod. 30 (3), 608-615 (2015).
- Campbell, B. K., Clinton, M., Webb, R. The role of anti-Müllerian hormone (AMH) during follicle development in a monovulatory species (sheep). Endocrinology. 153 (9), 4533-4543 (2012).
- Donnez, J., et al. Restoration of ovarian activity and pregnancy after transplantation of cryopreserved ovarian tissue: a review of 60 cases of reimplantation. Fertil Steril. 99 (6), 1503-1513 (2013).
- Ferreira, M., et al. The effects of sample size on the outcome of ovarian tissue cryopreservation. Reprod Domest Anim. 45 (1), 99-102 (2010).
- Gavish, Z., Peer, G., Roness, H., Cohen, Y., Meirow, D. Follicle activation and 'burn-out' contribute to post-transplantation follicle loss in ovarian tissue grafts: the effect of graft thickness. Hum Reprod. 30 (4), 1003(2015).
- Donnez, J., Dolmans, M. M. Fertility Preservation in Women. N Engl J Med. 377 (17), 1657-1665 (2017).
- Salama, M., Woodruff, T. K. New advances in ovarian autotransplantation to restore fertility in cancer patients. Cancer Metastasis Rev. 34 (4), 807-822 (2015).
- Donnez, J., Dolmans, M. M. Ovarian cortex transplantation: 60 reported live births brings the success and worldwide expansion of the technique towards routine clinical practice. J Assist Reprod Genet. 32 (8), 1167-1170 (2015).
- Meirow, D., et al. Transplantations of frozen-thawed ovarian tissue demonstrate high reproductive performance and the need to revise restrictive criteria. Fertil Steril. 106 (2), 467-474 (2016).
- Kalich-Philosoph, L., et al. Cyclophosphamide triggers follicle activation and "burnout"; AS101 prevents follicle loss and preserves fertility. Sci Transl Med. 5 (185), 185ra162(2013).
- Kano, M., et al. AMH/MIS as a contraceptive that protects the ovarian reserve during chemotherapy. Proc Natl Acad Sci U S A. 114 (9), E1688-E1697 (2017).
Reprints and Permissions
Explore More Articles
