This article describes the effect of dissimilar charging/discharging temperatures on the degradation of lithium iron phosphate-graphite pouch cells, aiming at simulating close to real case scenarios. In total, 10 temperature combinations are investigated in the range -20 to 30 °C in order to analyze the impact of temperature on degradation.
Method Article
The Effect of Charging and Discharging Lithium Iron Phosphate-graphite Cells at Different Temperatures on Degradation
Opens in a new tab
In This Article
Summary
Loading...
$$\rightleftharpoonup{xx}$$
$$\longleftharp{xx}$$,
$$\longrightharp{xx}$$,
Abstract
Loading...
$$\rightleftharpoonup{xx}$$
$$\longleftharp{xx}$$,
$$\longrightharp{xx}$$,
The effect of charging and discharging lithium iron phosphate-graphite cells at different temperatures on their degradation is evaluated systematically. The degradation of the cells is assessed by using 10 charging and discharging temperature permutations ranging from -20 °C to 30 °C. This allows an analysis of the effect of charge and discharge temperatures on aging, and their associations. A total of 100 charge/discharge cycles were carried out. Every 25 cycles a reference cycle was performed to assess the reversible and irreversible capacity degradation. A multi-factor analysis of variance was used, and the experimental results were fitted showing: i) a quadratic relationship between the rate of degradation and the temperature of charge, ii) a linear relationship with the temperature of discharge, and iii) a correlation between the temperature of charge and discharge. It was found that the temperature combination for charging at +30 °C and discharging at -5 °C led to the highest rate of degradation. On the other hand, the cycling in a temperature range from -20 °C to 15 °C (with various combinations of temperatures of charge and discharge), led to a much lower degradation. Additionally, when the temperature of charge is 15 °C, it was found that the degradation rate is nondependent on the temperature of discharge.
Introduction
Loading...
$$\rightleftharpoonup{xx}$$
$$\longleftharp{xx}$$,
$$\longrightharp{xx}$$,
Durability has become one of the pivotal topics of interest in lithium-ion batteries (LIB)1,2,3 research, not neglecting safety behavior, performance, and cost. Battery degradation is especially challenging for e-mobility applications as a relatively long lifetime is required4,5,6 compared to other applications (e.g., a few years for consumer electronics). The initial performance of LIBs (e.g., in terms of capacity and resistance) deteriorates over time due to electrochemical and calendar aging. Many factors (e.g., electrode material, environmental conditions, current loads, and cut-off voltages) can be decisive in degradation. The literature identifies temperature as one of the main factors affecting the degradation of electrode active materials and electrode-electrolyte side reactions7. Despite the vast amount of publications in the literature dealing with battery durability at different temperatures1,8,9,10,11,12, these studies only represent the specific cells, methods, and settings used. Hence, extrapolation to other cells is not trivial, making a quantitative comparison between different studies very difficult.
It can be anticipated that the cycling at different charging and discharging may have some influence on the degradation behavior of the battery because many of the processes causing degradation are temperature dependent. Moreover, in a number of applications, different charging and discharging temperatures represent a more convincing scenario [e.g., the battery of an e-bike charged in a temperature-controlled environment (indoor) and the e-bike cycled (i.e., discharged) at various temperatures (outdoor); seasonal and daily temperature fluctuations are experienced in many applications]. However, aging test results published in the literature usually study the same temperature for the charging and discharging steps. Also, relevant standards13,14,15,16,17 and test method manuals18,19,20 use the same temperature. We found in the literature one example of cycling at different temperatures (e.g., 45 °C, 65 °C)21 for the charge and discharge. The authors of this work described a higher fade in capacity at the higher temperature of discharge, which was attributed to solid electrolyte interface (SEI) layer growth and lithium plating21. The evaluation of battery degradation under conditions representative of realistic scenarios is desirable. Future standards and regulations might benefit from the results presented in this work on the testing of charge and discharge at different temperatures22.
As a general rule, higher testing temperatures accelerate degradation1,11,12, enhance the growth of the SEI11,23,24, and promote variations in the SEI11,23. On the other hand, low-temperature cycling results in unlikely challenges: plating and dendrite growth are facilitated (slow lithium-ion diffusion)25,26,27,28. Lithium metal can react further with the electrolyte leading to a reduced durability and reduced safety degree28,29.
Wang et al.8 published that the fade in capacity followed a power law relationship with the charge throughput (temperatures between 15 °C and 60 °C). Other authors have described a square-root of time relationship with fade in capacity10,30,31,32,33,34. This is supposed to represent the irreversible capacity loss attributed to the growth of SEI30,31 where active lithium is consumed. Capacity degradation also may have a share of linear degradation with time33,34,35. Finally, some simulations of the fade in capacity at various temperatures were validated with experimental results and the data showed an exponential dependency of degradation and temperature8,10.
In this work, the effect of different temperatures of charge and discharge on the degradation behavior of lithium iron phosphate (LFP)/graphite cells designed for sub-ambient temperatures is described. The number of possible temperature combinations was minimized using a design of experiment (DOE) method36; an approach used commonly in industrial optimization processes. This method was also applied by Forman et al.37 to study battery degradation, providing the minimum prediction error (D-Optimum). Alternatively, Muenzel et al.38 developed a multi-factor life prediction model reusing data from Omar et al.12. The data was fitted, and a degradation matrix was obtained.
In the current work, the data obtained was fitted by a non-linear least square fitting (polynomial) which includes first-order interactions between temperatures of charge and discharge. An analysis of variance (ANOVA) was used to evaluate the coefficients and the degree of polynomial. The method helps to understand the effect of temperatures of charge and discharge and their possible interactions. This information can be relevant to support the establishment of future fit for purpose and realistic protocols and standards.
Protocol
Loading...
$$\rightleftharpoonup{xx}$$
$$\longleftharp{xx}$$,
$$\longrightharp{xx}$$,
NOTE: The protocol followed in this work is explained in detail in Ruiz et al.39. A summary of the important steps is described below.
1. Pouch Cell Preparation and Formation
- Fabricate pouch cells in the format B5, having the dimension of 250 mm x 164 mm with an approximately 4-mm thickness, with artificial graphite as anode material, lithium iron phosphate (LFP) as cathode material, and a 25-µm thick polypropylene separator.
- Use 80 g of electrolyte: 1 M LiPF6 in ethylene carbonate:diethyl carbonate (2:3 w/w) containing 1% vinylene carbonate.
NOTE: The pouch cell fabrication was performed in a semi-automatic industrial pilot line consisting of the following steps: i) a slurry preparation containing the following active material: graphite for the anode and LFP for the cathode, a binder, and conductive additives in a lab-scale mixer, ii) a slurry coating on the current collectors (aluminum foil and copper foil, for cathode and anode electrodes, respectively), iii) a calendering for an optimized electrode performance in terms of, e.g., electrode density, porosity, thickness, electronic conductivity, and impedance, followed by iv) the assembly, electrolyte filling and sealing. - Carry out the formation of the cell. Create a cycling protocol with the battery cycler software using the following steps.
- Use the Build Test function of the battery cycler software. Click on the new file icon (see the blue arrow in Supplementary File 1a).
- Each line in the protocol code refers to a parameter of the cycling (e.g., rest time and cut-off voltage) (Supplementary File 1b).Fill out each step as required to perform a two-step constant current-constant voltage (CC-CV) charging at 0.1 C until 3.6 V, with a 10-mA cutoff current and a CC discharge at 0.1 C until 2.5 V. After the formation step, charge the battery cells at a 30% state of charge (SOC). Click the save button and provide a file name.
- Select the cell to be cycled by clicking on its corresponding channel (see blue arrow No. 1 in Supplementary File 2). That channel is marked in the "State" column as "selected". Then click on the run button (see blue arrow No. 2 in Supplementary File 2) on the top of the toolbar.
- Select the protocol (see blue arrow No. 1 in Supplementary File 3), set the capacity (Ah) of the cell (see blue arrow No. 2 in Supplementary File 3) and assign a chamber (see blue arrow No. 3 in Supplementary File 3). Define a valid filename and click on the start button.
2. Cell Fixture Prior to Electrochemical Testing
- Place each cell in corresponding holders consisting of two rigid plates (with a width and length of 300 mm x 300 mm, respectively, and a thickness of 12 mm) made of polycarbonate.
- Place a thermocouple in the center of one of the sides of each cell inside the holders to monitor the surface temperature variations.
- Place the cells and fixtures inside a temperature chamber to control the environmental temperature throughout the experiment. Place two cells following an identical protocol in the same temperature chamber.
- Connect the cells via a 4-wire connection to the cycler.
3. Electrochemical Cycling
- Cell conditioning
- Set the temperature at 25 °C in the environmental chamber. Allow at least 12 h to ensure a thermal equilibration.
- Perform three charge/discharge cycles using a battery cycler.
- Create a protocol for the battery cycler, following steps 1.3.1 and 1.3.2. In this case, adjust the protocol steps to a CC-CV charging at 0.1 C (from the rated capacity) up to 3.7 V (the CV phase until 0.01 C or 1 h), then CC discharge at 0.1 C until 2.7 V. Use a 30 min rest time after each cycling step.
- Follow steps 1.3.3 and 1.3.4 for the channel and protocol selection.
- When two cells are placed in the same temperature chamber (two cells following the same protocol), select the two corresponding channels at the same time. This guarantees the synchronization of the cycling and chamber temperature condition for the two cells.
- Perform a reference cycle (step 3.2) and use it for assessing the initial capacity (Ci) (Table 1).
- Reference cycling
- Perform the reference cycling as part of the cell conditioning (step 3.1.3) and at periodic intervals (i.e., following 25 long-term aging cycles, see below).
- Set the temperature of the chamber at 25 °C, when testing is performed at a different temperature, and allow sufficient time for a thermal stabilization (< 1 Kh-1).
- Perform two CC charge/discharge cycles using a battery cycler.
- Create a protocol for the battery cycler with the software, following steps 1.3.1. and 1.3.2. In this case, adjust the protocol steps to a CC charging-discharging at 0.3 C (e.g., IEC 62660-1:2011)13. After each cycling step, allow extra time for a temperature stabilization (< 1 Kh-1).
- Follow steps 1.3.3 and 1.3.4 for the channel and protocol selection.
- When two cells are placed in the same temperature chamber (two cells following the same protocol), select the two corresponding channels at the same time. This guarantees synchronization of the cycling and chamber temperature condition for the two cells.
- Long-term (aging)
- Perform 100 charge/discharge cycles. Create a protocol for the battery cycler with the software, following steps 1.3.1 and 1.3.2. In this case, adjust the protocol steps to a CC-CV charging of 1 C up to 3.7 V (CV phase until 0.1 C or 1 h) and a CC discharging of 1 C current up to 2.7 V with a constant temperature during charge (Tc) and during discharge (Td).
- Follow steps 1.3.3 and 1.3.4 for the channel and protocol selection.
- Carry out the long-term aging at several temperature combinations (10) for the 100 charge/discharge cycles from step 3.3.1, in the temperature range from -20 °C to 30 °C (see the test matrix in Table 1) developed through DOE D-optimization36 (a minimum error of prediction). Set a rest time in the testing protocol of 30 min after each charging or discharging step when Tc and Td are the same (tests No. 1 and 2, 3 and 4, 9 and 10, 13 and 14, and 19 and 20, Table 1). However, when Tc and Td are different (tests No. 11 and 12, 5 and 6, 7 and 8, 15 and 16, and 17 and 18, Table 1), set a rest time until the temperature is stable within 1 Kh-1.
- Perform a reference cycle after each set of 25 cycles (see step 3.2).
- Repeat each test once on a different fresh cell to assess its repeatability.
- Degradation rate
- Assess the cell degradation [Capacity Retention (CR)] using: i) the latest reference cycle and the first reference cycle, CRref (see step 3.2) and ii) the long-term Capacity Retention comparing with the first cycle, CRlong-term (see step 3.3) and the following equations (1 and 2):
(1)
(2)
- Use the battery cycler Client software to access the cycling data. First, select the template for visualization (file open in Supplementary File 4), and select the filename defined in step 3.1.2 or 3.2.3 where appropriate.
NOTE: Supplementary File 5 shows an example of the cycling data, with the capacity retention as a function of the cycle number (Supplementary File 5, top graph) and the variation of potential, and the current and temperature as a function of time (Supplementary File 5, bottom graph). Equations (1) and (2) can be determined directly from the plots using the software capabilities.
- Use the battery cycler Client software to access the cycling data. First, select the template for visualization (file open in Supplementary File 4), and select the filename defined in step 3.1.2 or 3.2.3 where appropriate.
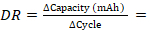
- Fit the degradation rates (DR) by using CRref and the total number of cycles (i.e., the reference cycles and long-term cycles) assuming that the DR depends on the charge Tc and discharge Td temperatures up to the quadratic term and interaction between those temperatures as follows in equation (3):
(3)
NOTE: Parameters Ai and their statistical significance are determined by a least-square fitting and an ANOVA, assuming that the measurement uncertainty (err) with a σ variance follows a normal distribution. The latter should be confirmed from the distribution of the residual of the fit.- For this purpose, use a software with the 'Fit model' function. Select the Stepwise option (blue arrow No. 1 in Supplementary File 6) and choose the Max K-Fold RSquare function (blue arrow No. 2 in Supplementary File 6) and click on GO. This splits the dataset to an equivalent training subset and the fitting is done on each subset separately. Select the best overall RSquare value to avoid overfitting.
- Click on Make model. Supplementary File 7 shows the results of the fitting. It also calculates the significance (PValue) of each parameter (Ai). In the 'Effect Summary' table, delete the least significant parameters. In this case, A4 (the quadratic dependence of the discharge temperature) was shown as not significant. Therefore, it was removed from further analysis. Supplementary File 8 shows the final fit with the actual data.
- Assess the cell degradation [Capacity Retention (CR)] using: i) the latest reference cycle and the first reference cycle, CRref (see step 3.2) and ii) the long-term Capacity Retention comparing with the first cycle, CRlong-term (see step 3.3) and the following equations (1 and 2):
4. Post-mortem Analysis
- Disassemble the cells. Carry out this step inside a glove box (< 5 ppm for O2 and H2O) to avoid contamination in the air. Cut the pouch cells using ceramic scissors. Cut small parts of the anode and cathode electrodes (5 mm x 5 mm) and mount them on scanning electron microscope (SEM) sample stubs.
- Avoid contamination by placing the SEM sample holder in a sealed container and directly transfer it to the SEM sample chamber through, for example, the use of a glove bag attached to the entrance of the chamber which is filled with inert gas.
- In order to reduce the exposure to the air, maintain an overpressure of inert gas in the glove bag.
- To examine in-depth the morphology of the electrodes before and after cycling, perform SEM imaging using two detectors for the secondary electrons: an in-lens detector and a standard secondary electron detector. Use as accelerating voltage for the in-lens detector and the secondary electron detector 1 kV and 15 kV, respectively.
- For each sample, characterize at least five different locations of the sample's surface to have representative SEM micrographs and to identify potential inhomogeneities of the surface. For each location, execute SEM imaging at the following magnifications: 1 kX, 3 kX, 5 kX, 10 kX, 20 kX, 50 kX, 75 kX, 100 kX, 150 kX, and 200 kX.
- Analyze the chemical composition of each electrode using an Energy Dispersive X-ray (EDX) spectrometer, with an 80-mm2 silicon drift detector (SDD).
- Use an accelerating voltage of 15 kV and a working distance of 13 mm to perform the elemental analysis using secondary electron images.
- Select for each material at least five different locations on the specimen surface and analyze a minimum of 5 points to generate spectra.
- Use different magnifications, ranging from 2 kX to 25 kX, to perform a semi-quantitative analysis and also to better target any specific particles or structural changes. As a result, for each sample, collect a minimum of 25 EDX spectra to investigate the elemental composition.
- Before starting the chemical analysis on a given location of a specimen, use copper for the spectral calibration. Finally, average values measured at different locations of each sample, with respect to the EDX mapping, use 2 h of acquisition time.
Results
Loading...
$$\rightleftharpoonup{xx}$$
$$\longleftharp{xx}$$,
$$\longrightharp{xx}$$,
Pouch cells (operational voltage range between 2.50 - 3.70 V) of a rated capacity of 6 Ah have been used for this study. The results obtained from their electrochemical characterization are divided into three sections: i) cycling at the same charging and discharging temperatures (step 1.1), ii) cycling at different discharging temperatures (and same charge temperature) (step 1.2) and iii) cycling at different charging temperatures (and same discharge temperature) (step 1.3).
The capacity retention vs. the total cycle number when Tc = Td is displayed in Figure 1a. A gap can be observed after every 25 cycles (for 4 cycles) corresponding to the reference cycling testing. An additional observation based on the graph is the quite uncommon behavior at Tc = Td at -20 °C testing conditions. After each block of 25 cycles, there is a drastic decay of capacity and then a recuperation during the reference cycling (done at 25 °C). For the other temperature combinations displayed in the graph, decay in the capacity is observed. This is most pronounced for the (30 °C, 30 °C) combination. Likewise, reference cycling affects the degradation trend of the long-term testing. The CR drops 0.5 - 1.0% after the reference cycle testing is > 12 °C and increases marginally when the cycling is < 12 °C.
Overall, the CRlong-term follows the order (average value for the duplicate tests) from more to less damaging as compared to the starting performance of the cell: 86% (30 °C, 30 °C), 90% (-20 °C, -20 °C), 96% (12 °C, 12 °C), 97% (5 °C, 5 °C), 100% (-5 °C, -5 °C). When the reference cycle testing is considered, the degradation follows the order: 86% (30 °C, 30 °C), 94 - 95% (5 °C, 5 °C), (12 °C, 12 °C), and (-5 °C, -5 °C), and 96.5% (-20 °C, -20 °C) (Table 1).
Figure 1b displays aging in terms of the capacity retention (%) vs. the temperature of cycling for all the samples evaluated when Tc = Td. Both the reference cycling and the long-term aging are displayed and fitted to a second-degree polynomial equation according to equation (3). The result corresponding to the CRlong-term for (-20 °C, -20 °C) was discarded from the fitting due to the observed peculiar behavior, which clearly does not follow the trend.
Figure 2a shows the discharge profiles during the long-term cycling. At a low C-rate [0.3 C (reference cycling) as compared to 1 C (long-term cycling)] and higher temperature [25 °C (reference cycling) as compared to -5 °C (long-term cycling)], extra characteristics appear in the discharge curve (Figure 2b), with three plateaus ranging 3.15 - 3.30 V. When the cycling evolves, there is a move of the plateaus to lower capacities and a small modification on the voltage of the plateaus potential.
Figure 3a shows the capacity evolution with cycling for cells No. 17 and 18 and No. 19 and 20, where Tc = 30 °C and Td = -5 °C and 30 °C, respectively. The data for the duplicate tests is presented with the intention to prove repeatability. Similar behavior was observed for the duplicates, thus in the following, only one test result will be displayed, and the CR values refer to the average value. Long-term cycling makes the capacity of the cell to reduce for the two temperature combinations, with a higher degradation at (30 °C, 30 °C) compared to (30 °C, -5 °C), 86% compared to 90% (Table 1).The opposite trend is found when comparing the reference cycles [cells No. 19 and 20 (30 °C, 30 °C) at 86% and cells No. 17 and 18 (30 °C, -5 °C) at 82%, Table 1]. At the end of the cycling, some bumps appeared on cells No. 17 and 18. A post-mortem evaluation of samples collected from cell No. 17 was carried out to comprehend the nature of those bumps. The results are shown and discussed in the Results. It needs to be noted that bumps developed over the course of time and were also visible in several other cells tested at various temperature combinations (not shown here).
Figure 3b displays the results corresponding to cells No. 3 and No. 5, with the same Tc = -5 °C, and a different Td = -5 °C and 30 °C, respectively. After 100 cycles, the capacity retention (100% and 91%, respectively) is higher at (-5 °C, -5 °C) than at (-5 °C, 30 °C). Tests performed when the same Tc and different Td are used are displayed in Figure 3c [cells No. 11 (12 °C, -10 °C) and No. 13 (12 °C, 12 °C)]. After 100 cycles, the capacity retention shows almost no degradation for the first cell and 96% for the second.
When the same Td (30 °C) and different Tc (-5 °C and 30 °C) are used, the capacity shows the behavior displayed in Figure 4a (cells No. 5 and No. 19). After 100 cycles, the retention in capacity is higher for the cells cycled at different temperatures (around 91%) than in the case of cells cycled at the same temperature (around 86%) (Table 1).
A long-term evaluation at Td = -5 °C and Tc = 30 °C and -5 °C, respectively (cells No. 3 and No. 17) is presented in Figure 4b. At the same Td, Tc = 30 °C is more damaging than Tc = -5 °C, as previously mentioned. The retention in capacity after 100 cycles is near 100% for cycling at (-5 °C, -5 °C) and 90% for cycling at (30 °C, -5 °C) (Table 1).
Finally, the performance when Td = -20 °C is displayed in Figure 4c (cells No. 1, No. 7, and No. 15 with Tc = -20 °C, 0 °C, and 15 °C, respectively). The data when cycling at (-20 °C, -20 °C) was previously explained. A rather similar result occurs in this figure but to a lower degree. This effect has also been detected by others40. The retention in capacity range is 90 - 102% relative to CRlong-term and ∼96% relative to CRref.
A visual examination of cell No. 17 (Tc = 30 °C, Td = -5 °C) showed significantly big bump parts (the white arrows in Figures 5a and 5b). Moreover, a zone of rippled structure at the bottom of the pouch and graphite electrodes was observed (the red circle, Figures 5a and 5b). This cell presented the highest rate of degradation and the lowest retention in capacity relative to CRref (Table 1).
Samples from the anode and cathode electrodes were harvested in 3 separate areas; the bump, the rippled, and the central areas (the latter with no visible imperfections). Fresh cells (after formation) were also opened and investigated for comparison purposes.
Figure 6 shows SEM images of the harvested anode materials. From the figure, it is evident that different morphological characteristics are distinguishable.

Figure 1. Capacity retentions. (a) This panel shows the capacity retention after 100 cycles at the same charge and discharge temperatures.(b) This panel shows the capacity retention (relative to long-term aging and reference cycling) vs. temperature.Cell tests: No. 1 (-20 °C, -20 °C), No. 3 (-5 °C, -5 °C), No. 9 (5 °C, 5 °C), No. 13 (12 °C, 12 °C), and No. 19 (30 °C, 30 °C). This figure has been modified from Ruiz et al.39. Please click here to view a larger version of this figure.

Figure 2. Discharge profiles for cells: No. 17 (30 °C, -5 °C). (a) This panel shows the long-term cycling (with a C-rate of 1 C and a temperature of -5 °C). (b) This panel shows the reference cycling (with a C-rate of 0.3 C and a temperature of 25 °C). This figure has been modified from Ruiz et al.39. Please click here to view a larger version of this figure.

Figure 3. Capacity retention for cells with same Tc and different Td. These panels show the capacity retentions and the effect of varying discharge temperatures of cells (a) No. 17 and 18 (30 °C, -5 °C) and No. 19 and 20 (30 °C, 30 °C), (b) No. 3 (-5 °C, -5 °C) and No. 5 (-5 °C, 30 °C), and (c) No. 11 (12 °C, -10 °C) and No. 13 (12 °C, 12 °C). This figure has been modified from Ruiz et al.39. Please click here to view a larger version of this figure.

Figure 4. Capacity retention for cells with different Tc and same Td. These panels show the capacity retentions and the effect of varying charge temperatures of cells (a) No. 5 (-5 °C, 30 °C) and No. 19 (30 °C, 30 °C), (b) No. 3 (-5 °C, -5 °C) and No. 17 (30 °C, -5 °C), and (c) No. 1 (-20 °C, -20 °C), No. 7 (0 °C, -20 °C), and No. 15 (15 °C, -20 °C). This figure has been modified from Ruiz et al.39. Please click here to view a larger version of this figure.

Figure 5. Post-mortem evaluations for cell No. 17. These panels show (a) a pouch cell after 100 cycles, and (b) an anode electrode after opening/harvesting. The white arrows indicate bumps testing and the red circle indicates a ripple area. Both features were generated during electrochemical testing. The external dimensions of the pouch cell are 250 mm x 164 mm. This figure has been modified from Ruiz et al.39. Please click here to view a larger version of this figure.

Figure 6. SEM imaging. These panels show SEM imaging at low and high magnifications for (a) a fresh anode (cell No. 17) at the (b) bump zone and (c) central zone, and for (d) the harvested anode (cell No. 17) at the (e) bump zone and (f) central zone. The next panels show secondary electrons SEM imaging for (g) a fresh and for the harvested anode from cell No. 17 at the (h) bump zone and (i) central zone (insert: a mapping with EDX indicates Cu-rich nanoparticles). This figure has been modified from Ruiz et al.39. Please click here to view a larger version of this figure.

Figure 7. Surface fitted [eq. (4)] and experimentally calculated rates of degradation (dots) in the charge/discharge temperature space from the reference cycles (R2 = 0.92). n = number of cycles. Red indicates a lower rate of degradation and blue a higher rate of degradation. This figure has been modified from Ruiz et al.39. Please click here to view a larger version of this figure.
| Cell test No | Tc /°C | Td /°C | ΔT /°C | C1 /Ah | CRlong-term (%) | Ci /Ah | R@1000Hz/ Ohm | CRref (%) | DR (Ah n-1) / Ah |
| 1 | -20 | -20 | 0 | 3.00 | 89.86 | 5.60 | 0.90 | 96.45 | -0.00208 |
| 2 | -20 | -20 | 0 | 3.00 | 90.21 | 5.61 | 0.93 | 96.46 | -0.00208 |
| 3 | -5 | -5 | 0 | 4.52 | 98.10 | 5.62 | 0.93 | 94.44 | -0.00349 |
| 4 | -5 | -5 | 0 | 4.51 | 102.00 | 5.72 | 1.00 | 96.40 | -0.00235 |
| 5 | -5 | 30 | 35 | 5.26 | 91.66 | 5.74 | 0.91 | 88.95* | -0.00627 |
| 6 | -5 | 30 | 35 | 5.29 | 90.82 | 5.72 | 0.82 | 89.14* | -0.00642 |
| 7 | 0 | -20 | 20 | 3.03 | 101.54 | 5.62 | 0.85 | 96.42 | -0.00219 |
| 8 | 0 | -20 | 20 | 3.04 | 99.00 | 5.65 | 0.93 | 96.22 | -0.00223 |
| 9 | 5 | 5 | 0 | 5.33 | 97.27 | 5.67 | 0.93 | 94.08 | -0.00239 |
| 10 | 5 | 5 | 0 | 5.35 | 97.00 | 5.64 | 0.84 | 94.31 | -0.00233 |
| 11 | 12 | -10 | 22 | 4.02 | 100.36 | 5.49 | 0.92 | 91.83 | -0.00335 |
| 12 | 12 | -10 | 22 | 4.03 | 99.30 | 5.51 | 0.90 | 90.41 | -0.00379 |
| 13 | 12 | 12 | 0 | 5.53 | 95.47 | 5.65 | 0.90 | 94.51 | -0.00331 |
| 14 | 12 | 12 | 0 | 5.51 | 96.09 | 5.64 | 0.88 | 94.90 | -0.00299 |
| 15 | 15 | -20 | 35 | 3.03 | 102.21 | 5.77 | 0.94 | 95.68* | -0.00379 |
| 16 | 15 | -20 | 35 | 3.01 | 102.11 | 5.72 | 0.95 | 95.60* | -0.00406 |
| 17 | 30 | -5 | 35 | 4.61 | 90.80 | 5.55 | 0.92 | 81.85 | -0.00994 |
| 18 | 30 | -5 | 35 | 4.62 | 90.00 | 5.60 | 0.95 | 81.20 | -0.01027 |
| 19 | 30 | 30 | 0 | 5.50 | 85.50 | 5.61 | 0.92 | 85.42 | -0.00794 |
| 20 | 30 | 30 | 0 | 5.48 | 86.00 | 5.57 | 0.90 | 86.09 | -0.00766 |
| * after 95 cycles, grey area indicates test protocols where Tc = Td | |||||||||
Table 1. Rated and calculated parameters for the cells tested at various temperature combinations. [Tc/°C: temperature of charge, Td/°C: temperature of discharge, ΔT/°C: | Td - Tc |, C1/Ah: first cycle capacity of the long-term aging, CRlong-term (%): capacity retention relative to the first cycle, Ci/Ah: initial capacity calculated by the reference cycle, CRref (%): capacity retention relative to the first reference cycle, DR (Ah n-1)/Ah: degradation rate calculated from the reference cycle after 100 cycles (linear trend assumed), n = number of cycles.]

Supplementary Files. Screenshots of the software usage. Please click here to download this file.
Discussion
Loading...
$$\rightleftharpoonup{xx}$$
$$\longleftharp{xx}$$,
$$\longrightharp{xx}$$,
The behavior for cycling at (-20 °C, -20 °C) (Figure 1a) can be attributed to (i) kinetic restrictions during charging (a reduced ion diffusion, a deprived charge transfer resistance at the interface of electrode/electrolyte41, a reduced ion conductivity, a charge imbalance, etc.) and/or (ii) lithium plating when charging at low temperatures can quickly diffuse when cycling at high temperatures42. When the temperature is back to 25 °C, the ion diffusion is increased and there is an equilibration of the unbalanced state. This would lead to a capacity recovery. A similar behavior was not found in the literature. For the type of cells under investigation, this temperature combination is not recommended for a continuous cycling due to fast capacity decay, although there is some partial recovery of capacity after a certain recovery time at room temperature.
On the other hand, cells cycled at (12 °C, 30 °C) were undesirably affected by the interruption to cycle the reference evaluation (this undoubtedly prolongs the overall testing time) (Figure 1a). These samples suffered from degradation since the beginning of the cycling and they could be more susceptible to additional degradation when comparing them with the samples cycled at < 12 °C.
The long-term aging with Tc = Td showed a close to second order polynomial relationship between the retention in capacity and the testing temperature (for the range of -5 °C to 30 °C, Figure 1b). Omar et al.12 showed a similar behavior (in the temperature range from -18 °C to 40 °C). The value at (-20 °C, -20 °C) was not taken into account as its behavior is drastically different from the general trend. From capacity measurements of CRref, it appears that cycling in the range -20 °C to 15 °C inflicts little degradation (Figure 1b). The different behavior demonstrated by CRref and CRlong-term can be explained as they are calculated on tests performed at different temperatures and different C-rates. Thus, they are sensitive to different processes: irreversible aging (the consequences of the degradation are perpetual)12,43 and reversible aging [the consequence of aging can be restored (e.g., extended rest times)]. It can be considered that, on the one hand, CRref is sensitive to irreversible degradation and, on the other hand, CRlong-term is sensitive to both reversible and irreversible degradation.
Discharge profiles during the long-term testing remain comparable (Figure 2a); the main difference is > 3 Ah (a drop in the discharge capacity)8. For the reference cycling (Figure 2b), three plateaus can be observed in the range 3.15 - 3.30 V, corresponding to the voltage difference between the cathode (3.43 V corresponding to the redox couple Fe3+/Fe2+)44 and the intercalation phases of the anode45,46. When cycling, there is a displacement to lower capacity values, due to the consumption of cyclable lithium, or a material degradation due to aging47.
When cycling at a given Tc, it was found that the long-term stability is higher at a lower Td. This is consistent with the general trend that higher temperatures lead to a higher degradation. This was observed for the three pairs of combinations evaluated and displayed in Figures 3a - 3c. Thus, cycling at Td = 30 °C leads to a higher degradation than Td = -5 °C, Tc being the same. Similarly, Td = 12 °C is more demanding than Td = -10 °C when Tc is the same (12 °C).
In some circumstances, the degradation trend found for the reference cycling is opposite to that shown for the long-term cycling. This is the case for (30 °C, -5 °C) vs. (30 °C, 30 °C) and (12 °C, -10 °C) vs. (12 °C, 12 °C) cycling. The reference cycle assessment only shows the irreversible degradation, whereas the long-term aging is influenced by both irreversible and reversible effects. Besides, 1 C cycling leads to higher ohmic drops (higher at lower temperatures). If the behavior of cells tested at (30 °C, -5 °C) is compared to cells tested at (-5 °C, 30 °C), it can be concluded that in both cases there is a comparable degradation [CRlong-term around 90% (Table 1)]. However, the CRref demonstrates a lower degradation at (-5 °C, 30 °C). Under these conditions (i.e., a given Td), a higher Tc means more degradation, as demonstrated by Figures 4a and 4b. Tc = 30 °C cycling degrades the cells more compared to Tc = -5 °C (when Td is the same). This is consistent with the interpretation of the data for other cycling conditions previously discussed.
As a summary, it can be concluded that cycling at (-5 °C, -5 °C), (0 °C, -20 °C), (5 °C, 5 °C), (12 °C, -10 °C) and (15 °C, -20 °C) over 100 cycles led to almost no degradation. The samples tested at Td = -20 °C proved to be stable (recovery in capacity at +25 °C, Figure 4c), making these samples suitable for sub-room temperature applications. This capacity recovery is less impressive when increasing Tc. The behavior shown by this set of samples indicates that there is a big component of reversible degradation at low temperatures (kinetic component).
The initial condition of the surface of the anode material (graphite) is typically smooth (Figures 6a and 6d). After cycling, the surface roughens, also observed by others48. The change in morphology is more obvious in the bumped zone (Figures6b and 6e) compared to the central part of the electrode (Figures 6c and 6f). When the magnification is increased, hemispherical particles are visible in the bumped zone (Figure 6e). These structures have an average diameter of 35 to 175 nm and have also been observed by others49,50,51. In these studies, they have been assigned to the plating of granular metallic Li particles49,50 on which the SEI layer grows50. A possible explanation for this platting can be assigned to: (i) some degree of overcharge as described by Lu et al.49 (10% overlithiation) or (ii) inhomogeneous compression on the electrodes as studied by Bach et al.52.
The secondary electron SEM depicts bright particles distributed in a cycled anode (Figure 6i). These particles are less visible in the rippled zone (supplementary data, FigureS1) and are not visible in the bump zone (Figure 6h). EDX investigations identified these particles as metallic Cu (see insert in Figure 6i and supplementary data in Figure S2). It is possible that Cu (current collector) dissolves and precipitates on the electrode (e.g., current collector corrosion occurs due to the reactivity with the electrolyte and when the anode potential is too positive vs. Li/Li+)28. In the bumped zone, traces of Cu having a concentration above the background signal have been also abserved. It is can be speculated that for some reason, the conditions in that zone do not favor the precipitation of Cu. Finally, traces of Fe have also been measured. This can be attributed to the dissolution of iron from cathode material (LiFePO4), as identified by others48,53,54. LiPF6 based electrolytes (HF traces)55, an evaluation of the cycled cathode showed no alterations compared to the fresh material (supplementary material, Figure S3). Further experiments are underway in order to characterize further these cathode materials.
The degradation rates (DRs) from Table 1 calculated from CRref were plotted vs. testing temperatures (charging and discharging), then fitted by the least-square method (2D). Figure 7 displays the surface-fitting generated, where the dots are the measured DRs. The dataset was divided into learning and verification datasets for the fitting. A polynomial function was selected (best R2). The red represents conditions with lower DRs and the blue represents conditions with higher DRs. The resultant model equation is:
(4) 

The statistical significance of the polynomial coefficients, confirmed by ANOVA, leads to a quadratic relationship of DR with Tc and a linear relationship with Td.
Other observations that can be helpful if suitable applications need to be selected: when Tc is around15 °C, DR is not-dependent of Td; when Tc < 15 °C, a higher degradation happens at a higher Td; when Tc > 15 °C, a lower degradation occurs at a higher Td; the lowest DR corresponds to (Tc = -7 °C, Td = -20 °C); the highest DR corresponds to (Tc = 30 °C, Td = -20 °C) or (Tc = -20 °C, Td = 30 °C).
The results presented in this work may be of relevance for the design of future standards and regulations in order to represent more realistic scenarios. Further experiments using other chemistries are needed to check the validity of these conclusions in order to find an optimum operating range depending on the application. Additional work will evaluate the effects of calendar aging.
Disclosures
Loading...
$$\rightleftharpoonup{xx}$$
$$\longleftharp{xx}$$,
$$\longrightharp{xx}$$,
The authors Matteo Destro and Daniela Fontana are employees of Lithops S.r.l that produces the battery cells used in this article. The other authors have nothing to disclose.
Acknowledgements
Loading...
$$\rightleftharpoonup{xx}$$
$$\longleftharp{xx}$$,
$$\longrightharp{xx}$$,
The authors thank Marc Steen and Lois Brett for their excellent support reviewing this manuscript.
Materials
| Name | Company | Catalog Number | Comments |
|---|---|---|---|
| artificial graphite | IMERYS | D50 about 6 µm. Catalog number cannot be disclosed for propietary reasons | |
| lithium iron phosphate | BASF | D50 about 11 µm. Catalog number cannot be disclosed for propietary reasons | |
| Cu foil | Schlenk | 16 µm thickness. Catalog number cannot be disclosed for propietary reasons | |
| Al foil | Showa Denko | 20 µm thickness. Catalog number cannot be disclosed for propietary reasons | |
| separator | Celgard | separator. Catalog number cannot be disclosed for propietary reasons | |
| Maccor cycler | Maccor | Maccor Series 4000 | Battery cycler |
| BIA chamber | BIA | BIA MTH 4.46 | environmental temperature chambers |
| SEM | Carl Zeiss, Germany | ZEISS SUPRA 50 | Scanning Electron Microscope |
| EDAX | Oxford Instruments, UK | Oxford X-MaxN 80 | Energy Dispersive X-ray spectrometer |
| SDD | Oxford Instruments, UK | AZtec software | Drift detector |
References
Loading...
$$\rightleftharpoonup{xx}$$
$$\longleftharp{xx}$$,
$$\longrightharp{xx}$$,
- Conte, M., et al. Ageing testing procedures on lithium batteries in an international collaboration context. 25th World Battery, Hybrid and Fuel Cell Electric Vehicle Symposium & Exhibition. , November 5 - 8, 2010 (2010).
- Barré, A., et al. A review on lithium-ion battery ageing mechanisms and estimations for automotive applications. Journal of Power Sources. 241, 680-689 (2013).
- Danzer, M., Liebau, V., Maglia, F. Aging of Lithium-ion Batteries for Electric Vehicles. , Woodhead Publishing. Amsterdam, The Netherlands. (2015).
- International Energy Agency (IEA). Technology Roadmap. Electric and Plug-in Hybrid Electric Vehicles. , Economic Co-operation and Development Publishing. Paris, France. (2011).
- Battery R&D Roadmap 2030. Battery Technology for Vehicle Applications. Eurobat E-Mobility. , Available from: http://www.eurobat.org/sites/default/files/eurobat_emobility_roadmap_lores_2.pdf (2015).
- SET Plan Secretariat. European Commission. Issues Paper No. 7 "Become competitive in the global battery sector to drive e-mobility forward". , Available from: http://setis.ec.europa.eu/system/files/integrated_set-plan/action7_issues_paper.pdf (2016).
- Shi, W., et al. Analysis of thermal aging paths for large-format LiFePO4/graphite battery. Electrochimica Acta. 196, 13-23 (2016).
- Wang, J., et al. Cycle-life model for graphite-LiFePO4 cells. Journal of Power Sources. 196 (8), 3942-3948 (2011).
- Steffke, K., Inguva, S., Van Cleve, D., Knockeart, J. SAE J1548: accelerated life test methodology for Li-ion batteries in automotive applications. SAE 2013 World Congress & Exhibition. , Detroit, MI (April 16 - 18, 2013) (2013).
- Ecker, M., et al. Development of a lifetime prediction model for lithium-ion batteries based on extended accelerated aging test data. Journal of Power Sources. 215, 248-257 (2012).
- Ramadass, P., Haran, B., White, R., Popov, B. N. Capacity fade of Sony 18650 cells cycled at elevated temperatures: Part I. Cycling performance. Journal of Power Sources. 112 (2), 606-613 (2002).
- Omar, N., et al. Lithium iron phosphate based battery - Assessment of the aging parameters and development of cycle life model. Applied Energy. 113, 1575-1585 (2014).
- International Electrotechnical Commission. Secondary lithium-ion cells for the propulsion of electric road vehicles - Part 1: performance testing. , Geneva, Switzerland. IEC 62660-1 (2011).
- International Organization for Standardization. Electrically propelled road vehicles - Test specification for lithium-ion traction battery packs and systems - Part 1: high-power applications. , Geneva, Switzerland. ISO 12405-1 (2011).
- International Organization for Standardization. Electrically propelled road vehicles - Test specification for lithium-ion traction battery packs and systems - Part 2: high-energy applications. , Geneva, Switzerland. ISO 12405-2 (2012).
- The Engineering Society for Advancing Mobility Land Sea Air and Space International. Life Cycle Testing of Electric Vehicle Battery Modules. , Warrendale, PA. SAE J2288 (2008).
- The Engineering Society for Advancing Mobility Land Sea Air and Space International. Recommended Practice for Performance Rating of Electric Vehicle Battery Modules. , Warrendale, PA. SAE J1798 (2008).
- Idaho National Laboratory. Battery Calendar Life Estimator Manual: Modeling and Simulation. , Idaho Falls, ID. INL-EXT-08-15136. Rev 1 (2012).
- Idaho National Laboratory. Battery Technology Life Verification Test Manual Revision 1. , Idaho Falls, ID. INL-EXT-12-27920 (2012).
- United States Advanced Battery Consortium LLC. USABC Electric Vehicle Battery Test Procedures Manual Revision 2. , Southfield, MI. (1996).
- Jalkanen, K., et al. Cycle aging of commercial NMC/graphite pouch cells at different temperatures. Applied Energy. 154, 160-172 (2015).
- Ruiz, V., et al. A review of international abuse testing standards and regulations for lithium ion batteries in electric and hybrid electric vehicles. Renewable and Sustainable Energy Reviews. 81, Part I 1427-1452 (2017).
- Inaba, M., Tomiyasu, H., Tasaka, A., Jeong, S. -K., Ogumi, Z. Atomic force microscopy study on the stability of a surface film formed on a graphite negative electrode at elevated temperatures. Langmuir. 20 (4), 1348-1355 (2004).
- Richard, M. N., Dahn, J. R. Accelerating rate calorimetry study on the thermal stability of lithium intercalated graphite in electrolyte. I. Experimental. Journal of the Electrochemical Society. 146 (6), 2068-2077 (1999).
- Broussely, M., et al. Main aging mechanisms in Li ion batteries. Journal of Power Sources. 146 (1-2), 90-96 (2005).
- Burns, J. C., Stevens, D. A., Dahn, J. R. In-situ detection of lithium plating using high precision coulometry. Journal of the Electrochemical Society. 162 (6), 959-964 (2015).
- Fleischhammer, M., Waldmann, T., Bisle, G., Hogg, B. -I., Wohlfahrt-Mehrens, M. Interaction of cyclic ageing at high-rate and low temperatures and safety in lithium-ion batteries. Journal of Power Sources. 274, 432-439 (2015).
- Vetter, J., et al. Ageing mechanisms in lithium-ion batteries. Journal of Power Sources. 147 (1), 269-281 (2005).
- Arora, P., White, R. E., Doyle, M. Capacity fade mechanisms and side reactions in lithium-ion batteries. Journal of the Electrochemical Society. 145 (10), 3647-3667 (1998).
- Spotnitz, R., Franklin, J. Abuse behavior of high-power, lithium-ion cells. Journal of Power Sources. 113 (1), 81-100 (2003).
- Broussely, M., et al. Aging mechanism in Li ion cells and calendar life predictions. Journal of Power Sources. 97-98, 13-21 (2001).
- Niikuni, T., Koshika, K., Kawai, T. Evaluation of the influence of JC08-based cycle stress on batteries in plug-in hybrid electric vehicle. EVS25 (World Battery, Hybrid and Fuel Cell Electric Vehicle Symposium). , Shenzhen, China, November 5 - 9, 2010 (2010).
- Betzin, C., Wolfschmidt, H., Luther, M. Long time behavior of LiNi0.80Co0.15Al0.05O2 based lithium-ion cells by small depth of discharge at specific state of charge for primary control reserve in a virtual energy storage plant. Energy Procedia. 99, 235-242 (2016).
- Schmalstieg, J., Käbitz, S., Ecker, M., Sauer, D. U. A holistic aging model for Li(NiMnCo)O2 based 18650 lithium-ion batteries. Journal of Power Sources. 257, 325-334 (2014).
- Belt, J., Utgikar, V., Bloom, I. Calendar and PHEV cycle life aging of high-energy, lithium-ion cells containing blended spinel and layered-oxide cathodes. Journal of Power Sources. 196 (23), 10213-10221 (2011).
- Atkinson, A., Donev, A., Tobias, R. Optimum Experimental Designs, with SAS. , Oxford University Press. Oxford, UK. (2007).
- Forman, J. C., Moura, S. J., Stein, J. L., Fathy, H. K. Optimal experimental design for modeling battery degradation. ASME 2012 5th Annual Dynamic Systems and Control Conference Joint with the JSME 2012 11th Motion and Vibration Conference. 1, DSCC 2012-MOVIC 2012 309-318 (2012).
- Muenzel, V., De Hoog, J., Brazil, M., Vishwanath, A., Kalyanaraman, S. A multi-factor battery cycle life prediction methodology for optimal battery management. e-Energy 2015 - Proceedings of the 2015 ACM 6th International Conference on Future Energy Systems. , 57-66 (2015).
- Ruiz, V., et al. Degradation studies on lithium iron phosphate - graphite cells. The effect of dissimilar charging - discharging temperatures. Electrochimica Acta. 240, This is an open access article under the CC BY license (http://creativeccommons.org/Licenses/by/4.0 495-505 (2017).
- Eddahech, A., Briat, O., Vinassa, J. M. Lithium-ion battery performance improvement based on capacity recovery exploitation. Electrochimica Acta. 114, 750-757 (2013).
- Zhang, S., Xu, K., Jow, T. Low-temperature performance of Li-ion cells with a LiBF4-based electrolyte. Journal of Solid State Electrochemistry. 7 (3), 147-151 (2003).
- Fan, J., Tan, S. Studies on charging lithium-ion cells at low temperatures. Journal of the Electrochemical Society. 153 (6), 1081-1092 (2006).
- Franco, A. A., Doublet, M. L., Bessler, W. G. Physical Multiscale Modeling and Numerical Simulation of Electrochemical Devices for Energy Conversion and Storage. , Springer-Verlag. London, UK. (2016).
- Padhi, A. K., Nanjundaswamy, K. S., Goodenough, J. B. Phospho-olivines as positive-electrode materials for rechargeable lithium batteries. Journal of the Electrochemical Society. 144 (4), 1188-1194 (1997).
- Dubarry, M., Liaw, B. Y. Identify capacity fading mechanism in a commercial LiFePO4 cell. Journal of Power Sources. 194 (1), 541-549 (2009).
- Kassem, M., et al. Calendar aging of a graphite/LiFePO4 cell. Journal of Power Sources. 208, 296-305 (2012).
- Physical Multiscale Modeling and Numerical Simulation of Electrochemical Devices for Energy Conversion and Storage. Franco, A. A., Doublet, M. L., Bessler, W. G. , Springer. London, UK. (2016).
- Zheng, Y., et al. Deterioration of lithium iron phosphate/graphite power batteries under high-rate discharge cycling. Electrochimica Acta. 176, 270-279 (2015).
- Lu, W., et al. Overcharge effect on morphology and structure of carbon electrodes for lithium-ion batteries. Journal of the Electrochemical Society. 159 (5), 566-570 (2012).
- Stark, J. K., Ding, Y., Kohl, P. A. Nucleation of electrodeposited lithium metal: dendritic growth and the effect of co-deposited sodium. Journal of the Electrochemical Society. 160 (9), 337-342 (2013).
- Honbo, H., Takei, K., Ishii, Y., Nishida, T. Electrochemical properties and Li deposition morphologies of surface modified graphite after grinding. Journal of Power Sources. 189 (1), 337-343 (2009).
- Bach, T. C., et al. Nonlinear aging of cylindrical lithium-ion cells linked to heterogeneous compression. Journal of Energy Storage. 5, 212-223 (2016).
- Klett, M., et al. Non-uniform aging of cycled commercial LiFePO4//graphite cylindrical cells revealed by post-mortem analysis. Journal of Power Sources. 257, 126-137 (2014).
- Amine, K., Liu, J., Belharouak, I. High-temperature storage and cycling of C-LiFePO4/graphite Li-ion cells. Electrochemistry Communications. 7 (7), 669-673 (2005).
- Koltypin, M., Aurbach, D., Nazar, L., Ellis, B. More on the performance of LiFePO4 electrodes-The effect of synthesis route, solution composition, aging, and temperature. Journal of Power Sources. 174 (2), 1241-1250 (2007).
Reprints and Permissions
Request permission to reuse the text or figures of this JoVE article
Request Permission