The overall goal of polysome profiling technique is analysis of translational activity of individual mRNAs or transcriptome mRNAs during protein synthesis. The method is important for studies of protein synthesis regulation, translation activation and repression in health and multiple human diseases.
Method Article
Polysome Profiling in Leishmania, Human Cells and Mouse Testis
In This Article
Summary
Abstract
Proper protein expression at the right time and in the right amounts is the basis of normal cell function and survival in a fast-changing environment. For a long time, the gene expression studies were dominated by research on the transcriptional level. However, the steady-state levels of mRNAs do not correlate well with protein production, and the translatability of mRNAs varies greatly depending on the conditions. In some organisms, like the parasite Leishmania, the protein expression is regulated mostly at the translational level. Recent studies demonstrated that protein translation dysregulation is associated with cancer, metabolic, neurodegenerative and other human diseases. Polysome profiling is a powerful method to study protein translation regulation. It allows to measure the translational status of individual mRNAs or examine translation on a genome-wide scale. The basis of this technique is the separation of polysomes, ribosomes, their subunits and free mRNAs during centrifugation of a cytoplasmic lysate through a sucrose gradient. Here, we present a universal polysome profiling protocol used on three different models - parasite Leishmania major, cultured human cells and animal tissues. Leishmania cells freely grow in suspension and cultured human cells grow in adherent monolayer, while mouse testis represents an animal tissue sample. Thus, the technique is adapted to all of these sources. The protocol for the analysis of polysomal fractions includes detection of individual mRNA levels by RT-qPCR, proteins by Western blot and analysis of ribosomal RNAs by electrophoresis. The method can be further extended by examination of mRNAs association with the ribosome on a transcriptome level by deep RNA-seq and analysis of ribosome-associated proteins by mass spectroscopy of the fractions. The method can be easily adjusted to other biological models.
Introduction
Regulation of gene expression in cells is controlled by transcriptional, posttranscriptional and posttranslational mechanisms. Advances in deep RNA sequencing allow the study of steady-state mRNA levels on a genome-wide scale at an unprecedented level. However, recent findings revealed that steady-state mRNA level does not always correlate with protein production1,2. The fate of an individual transcript is very complex and depends on many factors like internal/external stimuli, stress, etc. Regulation of gene expression during protein synthesis provides another layer of expression control necessary for a rapid response in changing conditions. Polysome (or "polyribosome") profiling, the separation and visualization of actively translating ribosomes, is a powerful method to study the regulation of protein synthesis. Although, its first experimental applications appeared in the 1960s3, polysome profiling is currently one of the most important techniques in protein translation studies4. Single mRNAs can be translated by more than one ribosome leading to the formation of a polysome. Transcripts can be stalled on ribosomes with cycloheximide5 and mRNAs containing different numbers of polysomes can be separated in the process of polysome fractionation by sucrose gradient ultracentrifugation6,7,8,9. RNA analysis of polysomal fractions then allows measurement of changes in the translational states of individual mRNAs on genome-wide scale and during different physiological conditions4,7,10. The method has been also used to reveal the roles of 5'UTR and 3'UTR sequences in control of mRNA translatability11, examine the role of miRNAs in translational repression12, uncover defects in ribosome biogenesis13, and understand the role of ribosome-associated proteins with human diseases14,15. During the last decade, a growing role for regulation of gene expression during translation has emerged that illustrates its importance in human diseases. The evidence for translational control in cancer, metabolic and neurodegenerative diseases is overwhelming15,16,17,18. For example, dysregulation of eIF4E-dependent translational control contributes to autism related deficits15 and FMRP is involved in stalling of ribosomes on mRNAs linked to autism14. Thus, polysomal profiling is a very important tool to study defects in translational regulation in multiple human diseases.
Protein analysis of polysomal fractions under different physiological conditions dissects the function of factors associated with ribosomes during translation. The polysome profiling technique has been used in many species including yeast, mammalian cells, plants, and protozoa10,19,20,21. Protozoan parasites like Trypanosoma and Leishmania exhibit limited transcriptional control of gene expression. Their genomes are organized into polycistronic gene clusters that lack promoter-regulated transcription22. Instead, developmental gene expression is predominantly controlled at the level of protein translation and mRNA stability in trypanosomatid species23,24. Therefore, understanding of translational control in the absence of transcriptional regulation is particularly important for these organisms. Polysomal profiling is a powerful tool to study posttranscriptional regulation of gene expression in Leishmania25,26,27,28.
The recent progress in detection of individual mRNAs levels by real time quantitative PCR (RT-qPCR) and full transcriptome by next-generation sequencing, as well as proteomics technologies, brings resolution and advantages of polysomal profiling to a new level. The use of these methods can be further extended by analysis of individual polysomal fractions by deep RNA sequencing combined with proteomic analysis to monitor the translational status of cells on a genome-wide scale. This allows the identification of new molecular players regulating translation under different physiological and pathological conditions. Here, we present a universal polysome profiling protocol used on three different models: the parasite Leishmania major, cultured human cells, and animal tissues. We present advice on the preparation of cell lysates from different organisms, optimization of gradient conditions, choice of RNase inhibitors and application of RT-qPCR, Western blot and RNA electrophoresis to analyze polysome fractions in this study.
Protocol
All animal treatments and handling of tissues obtained in the study were performed according to protocols approved by the Institutional Animal Care and Use Committee at the Texas Tech University Health Science Center in accordance with the National Institutes of Health animal welfare guidelines, protocol number 96005. Please sacrifice vertebrate animals and prepare tissues according to the guidelines from the Institutional Animal Care and Use Committee. If lacking such a committee, please refer to the National Institutes of Health animal welfare guidelines. Adult (>60 day old) C57BL/6 mice were used. All animals and tissues were obtained according to protocols approved by the Institutional Animal Care and Use Committee at the Texas Tech University Health Sciences Center in accordance with the National Institutes of Health animal welfare guidelines. For euthanasia, a single mouse was placed in a small chamber, and the air was displaced gradually with about 30% carbon dioxide to anesthetize and minimize the distress of the animal. Following cessation of breathing, we used cervical dislocation to confirm the death of the animal before harvesting tissues.
Caution: All work with live Leishmania and cultured human cells was done in biosafety cabinet in BSL-2 certified laboratory.
1. Preparation of Cytoplasmic Lysates from Leishmania Major , Cultured Human Cells, and Mouse Tissues
NOTE: There are several differences in the lysate preparations from the different source materials. Other steps including sucrose gradient preparation and polysomal fractionation are identical and do not depend on sample source.
- Leishmania major cytoplasmic lysate preparation
- Inoculate Leishmania major (FV1 strain) cells in 30 mL of 1x M199 medium29 containing 10% Fetal Bovine Serum (FBS) and penicillin/streptomycin mixture (100 units and 100 μg/mL correspondingly) at density of 1x10⁵ cells/mL.
NOTE: All steps involving Leishmania major cells must be conducted in a biosafety cabinet. - Place cells in the incubator and grow them at 27 °C until the logarithmic phase (mid log corresponds to 5x10⁶ cells/mL). It usually takes about two days to grow.
- Add cycloheximide to Leishmania major culture to a final concentration of 100 μg/mL to arrest the ribosomes on translated mRNAs. Place cells back in the incubator for 10 min at 27 °C.
- After cycloheximide treatment is completed, transfer cells to a 50 mL conical tube and spin them at 1,800 x g and 4 °C for 8 min. Discard supernatant.
- Wash cells with 30 mL of Dulbecco's phosphate buffered saline (DPBS). Centrifuge at 1,800 x g and 4 °C for 8 min.
- Discard the supernatant. Resuspend cells in 1 mL of DPBS.
- Take an aliquot of cells and mix it with 3.5% formaldehyde solution.
- Count cells by hemocytometer and determine their concentration. Transfer the desired number of cells into microfuge tube. Lysate prepared from 0.5x10⁸-2x10⁸ cells/mL is sufficient for one sucrose gradient loading.
- Spin the cells at 1,800 x g and 4 °C for 8 min. Discard the supernatant.
- Resuspend the cell pellet on ice in 1 mL of lysis buffer containing protease inhibitors and RNase inhibitor (20 mM HEPES-KOH, pH 7.4, 100 mM KCl, 10 mM MgCl2, 2 mM DTT, 1% NP-40, 1x protease inhibitor cocktail (EDTA-free), 200 units/mL RNase inhibitor).
- Pass the lysate through a 23-gauge needle three times. The lysate should become transparent after passage through the needle.
- Centrifuge at 11,200 x g and 4 °C for 10 min to clarify lysate. Transfer the clarified lysate to a fresh tube and keep it on ice until sucrose gradient ultracentrifugation.
- Collect 400-500 μL of the lysate as input (to analyze later), freeze it right away in liquid nitrogen for future protein analysis or add RNA purification reagent before freezing for RNA analysis.
- Inoculate Leishmania major (FV1 strain) cells in 30 mL of 1x M199 medium29 containing 10% Fetal Bovine Serum (FBS) and penicillin/streptomycin mixture (100 units and 100 μg/mL correspondingly) at density of 1x10⁵ cells/mL.
- Cytoplasmic lysate preparation from cultured human HeLa cells
- Split HeLa cells and seed them into 20 mL of the DMEM medium containing 10% FBS and penicillin/streptomycin mixture (100 units and 100 μg/mL correspondingly) with cell count 2x10⁵ cells/mL in a 15 cm plate.
- Grow HeLa cells at 37 °C, 5% CO2 for 20-24 h. Perform plasmid DNA transfection according to manufacturer's protocols.
- Propagate cells for 24 h after transfection at 37 °C, 5% CO2.
- Add cycloheximide to grown HeLa cells to the final concentration of 100 μg/mL to arrest the ribosomes on translated mRNAs and incubate cells for 10 min at 37 °C, 5% CO2. Aspirate medium. Wash the cells twice with cold DPBS on ice.
- Add 500 μL of lysis buffer (20 mM HEPES-KOH pH 7.4, 100 mM KCl, 5 mM MgCl2, 1 mM DTT, 0.5% NP-40, 1x protease inhibitor cocktail (EDTA-free), 200 units/mL of RNase inhibitor or 1 mg/mL heparin) to the plate and scrape the cells on ice.
- Transfer the lysed cells to the microfuge tube. Adjust the concentration of NP-40 to 0.5% and MgCl2 to 5 mM according to the increased volume of the sample.
- Pass the lysate through a 23-gauge needle 3-6 times.
- Spin at 11,200 x g and 4 °C for 8 min to clarify lysate. After centrifugation, transfer supernatant to a new tube. Use a spectrophotometer to evaluate cell lysis efficiency and to determine sample amount for the loading on the gradient. Add 10 μL of sample to 0.5 mL of 0.1% Sodium Dodecyl Sulfate (SDS). Blank against 0.1% SDS. Measure absorbance at 260 nm. Expected absorbance value is around 15-20 units/mL.
- Dilute all samples with lysis buffer to the same absorbance value before sucrose gradient centrifugation. Keep samples on ice until sucrose gradient centrifugation.
- Cytoplasmic lysate preparation from mouse testis
- Dissect the mouse testis. Make a small incision in the tunica albuginea and collect the seminiferous tubules of the testes and transfer them in a 15 mL conical tube containing 5 mL of DPBS supplemented with 0.1 mM phenylmethylsulfonyl fluoride (PMSF).
- Mix the tissue vigorously by inverting several times. Allow the tissue to settle at unit gravity on ice for 5 min.
- Remove and discard the cloudy buffer containing connective cells and tissue fragments. Repeat the procedure 2-3 more times. The remaining white pellet is enriched for seminiferous tubules and germ cells.
- Transfer the seminiferous tubule pellet to a 2 mL microcentrifuge tube and spin at 500 x g for 1 min. Discard the supernatant.
- Add 500 µL of lysis buffer (20 mM Tris-HCl, pH 7.4, 100 mM KCl, 5 mM MgCl2, 1 mM DTT, 0.5% NP-40, 1x protease inhibitor cocktail (EDTA-free), 1 mg/mL heparin or 200 units/mL of RNase inhibitor) to the tubules. Use a pipette to triturate the tissue.
- Transfer the suspension to a small (0.5-1.0 mL) Dounce homogenizer. Disrupt the tissue with seven to eight strokes of the glass pestle.
- Transfer the lysate to a 1.5 mL microcentrifuge tube.
- Centrifuge the sample at 12,000 x g and 4 °C for 8 min to clear the lysate. Transfer the supernatant to a new tube and store on ice until loading on the sucrose gradient.
- Collect 50 μL of the lysate as input sample, freeze it right away at -80 °C for future protein analysis; or add RNA purification reagent before freezing for RNA analysis.
2. Sucrose Gradient Preparation and Ultracentrifugation
- Prepare two sucrose gradient solutions (20 mM HEPES-KOH, pH 7.4, 100 mM KCl, 10 mM MgCl2, 1 mM DTT, 1x protease inhibitor cocktail), containing either 10% sucrose or 50% sucrose. (Tris-HCl, pH 7.4, can be used instead of HEPES). Add 200 units/mL RNase inhibitor or 1 mg/mL heparin according to the experimental design. Place an ultracentrifuge tube for SW 41 rotor into the marker block and draw the line along the upper level of the block. Transfer the tube into a stable rack.
- Take a 10-mL syringe with the layering device attached and fill the syringe with 10% sucrose solution (prepared as above). Gently release it at the bottom of the ultracentrifuge tube until it reaches the mark on the tube.
- Fill another syringe with 50% sucrose solution and carefully insert its layering device through the 10% sucrose layer to the bottom of the tube. Gently release sucrose solution starting from the bottom until it reaches the mark on the tube. Seal the tube with the provided cap.
- To prepare the sucrose gradient, turn the gradient maker device ON. Level the plate using the UP or DOWN buttons and press DONE. Leveling is important for linearity of the gradient.
- After leveling the plate press GRAD to open the gradient menu. Go to LIST on the gradient menu and select the SW 41 Ti rotor. Then choose the desired sucrose gradient from the list of the menu using UP and DOWN buttons. Press USE.
- Place the gradient tube holder on the gradient maker plate. Transfer the tube into the holder. Up to 6 gradients can be prepared at the same time. Press RUN. The gradient maker rotates the tubes at the programmed speed and angles forming a linear gradient. It will take only a few minutes to prepare the gradient.
- When process is completed, place the tubes in a rack. Take the caps off. Remove the same volume as the sample volume from the top of the ultracentrifuge tubes.
- Carefully load 400-500 μL of lysate containing 15-20 A260 units of polysomes on the top. Place the tubes in the rotor buckets and balance them.
- Centrifuge at 260,000 x g and 4 °C for 2 h using SW 41 rotor.
3. Polysome Fractionation and Sample Collection
NOTE: While lysate preparations have some differences depending on the source, gradient preparation and polysome fractionation protocols are the same for all types of lysates.
- After completion of the ultracentrifugation, place the rotor buckets with the tubes on ice. Turn fraction collector and gradient fractionator ON. Click SCAN on the fractionator menu. Put a rack with 24 collection tubes into the fraction collector.
- Fill up a rinse reservoir on the side of the fractionator with deionized water. Press the RINSE key for 10 s to rinse the pump on fractionator. Attach a rinse adaptor with the syringe filled with water to the piston for the calibration.
- Open the fractionator software on the computer. Press CALIBRATE. Use the DEFAULT settings and press OK. Be ready to inject water from syringe.
- Press OK to do calibration. Immediately start injecting water for the next 5 s. During this time, water will flow through the UV detector flow cell and the instrument will be calibrated. The sign ZERO CALIBRATION COMPLETED will appear. The instrument is ready for fractionation.
- Remove the rinse adaptor with the syringe. Attach a tip to the piston of the fractionator.
- Open the brass air valve and press AIR key for 10 s to dry tubing and flow cell. Close the air valve.
- Gently remove the gradient tube from the rotor bucket and place it in the rack. Apply the tube holder cap to the top of the tube and carefully move the tube into the tube holder and lock it in position.
- Place the holder under the piston of the fractionator. Often, polysomal bands can be seen by eye. Introduce the desired settings for fraction numbers and volume (24 fractions at 500 μL/fraction are usually sufficient). Name the file appropriately. Press OK, and then GO TO GRAPH button. In the next window, press START SCAN. Settings will appear, press OK. The collector will move from the gutter to the first fraction and the piston will move into the tube. When the piston reaches the top of the gradient it will slow to the selected speed and the fractions will be collected. When completed, the piston moves out of the gradient tube.
- Open the brass air valve and press AIR key on the fractionator to retrieve the last fraction.
- Move the tubes from the rack on ice.
- Add 2 volumes of RNA purification reagent to each fraction and flash freeze in liquid nitrogen until RNA purification. Alternatively, if protein needs to be analyzed, add trichloroacetic acid to the final concentration of 10% to concentrate them for Western blotting (see Section 8).
4. Preparation of Synthetic RNA In Vitro for Normalization of mRNAs Levels During RT-qPCR Data Analysis
NOTE: The E. coli OmpA mRNA is used in this protocol for normalization. Any other RNA that does not have extensive identity with the mRNAs of the studied organism (mammalian or Leishmania) can be used.
- Prepare the OmpA DNA fragment containing SP6 promoter sequence by a standard PCR reaction from a plasmid containing OmpA gene30.
- Prepare 100 µL of the mixture: 80 mM HEPES-KOH, pH 7.5, 16 mM MgCl2, 2 mM Spermidine, 10 mM DTT, 3 mM ATP, 3 mM CTP, 3 mM UTP, 3 mM GTP, 0.5 U/μL RNase inhibitor, 1 μg of OmpA PCR DNA, 3 μL SP6 RNA polymerase, 0.005 U/μL pyrophosphatase.
- Incubate at 40 °C for 2 h.
- Purify RNA by a RNA purification kit.
- Measure concentration by spectrophotometer and examine by agarose gel electrophoresis.
5. RNA Isolation from Gradient Fractions and cDNA Preparation
NOTE: Proceed directly with this protocol for RNA purification if an RNase inhibitor was used as a ribonuclease inhibitor. However, when used as a ribonuclease inhibitor, heparin will inhibit reverse transcriptase used in cDNA preparation. Therefore, additional purification of RNA will be needed if heparin was used in the lysis buffer and gradient. See Section 6 to prepare RNA for cDNA synthesis if heparin was used.
- Thaw the samples containing RNA purification reagent, add 20 ng of synthetic RNA as internal control for normalization of RT-qPCR results. Proceed with RNA preparation according to the manufacturer's protocol except one modification. Add 1 µL of RNA grade glycogen (20 µg) prior isopropanol precipitation. Dissolve RNA pellets in 20-25 µL of RNase-free water.
NOTE: Glycogen serves as a carrier and helps to avoid losses and visualize RNA pellet during purification. OmpA mRNA is used for further normalization in RT-qPCR reactions. - Measure RNA concentration using spectrophotometer to ensure adequate yield. Combine equal volumes of RNA fractions containing 40S, 60S and monosomes as prepolysomes. Fractions containing 2-4 ribosomes combine as light polysomes and fractions with 5-8 ribosomes combine as heavy polysomes.
- Use 5-10 µL of RNA from combined fractions to prepare cDNAs using a kit and following manufacturer's recommendations.
- Add 80 µL of nuclease free water to 20 µL of cDNA. Freeze the cDNA samples at -20 °C.
6. RNA Purification from Heparin Contamination
NOTE: Heparin inhibits nucleic acid processing enzymes such as reverse transcriptase. Therefore, use this additional purification protocol when heparin is used in the lysis buffer and/or in the gradient.
- Add LiCl to a 1 M final concentration to the purified RNA samples.
- Mix the samples and incubate on ice for 1 h.
- Spin the samples at 16,000 x g and 4 °C for 15 min.
- Remove the supernatant as complete as possible using a pipette.
- Air-dry the pellets for about 5 min.
- Re-suspend the pellets in the initial volume of RNase-free water.
- Perform spectrophotometric measurement at 260 nm to determine the concentration of the RNA. Usually, the loss of the sample is minimal.
7. RT-qPCR and Data Analysis of mRNA Distribution
- Combine 10.2 μL of water, 20 μL of SYBR Green, 4.8 μL of gene specific primers (2.5 μM each set), 5 μL of cDNA, mix well and load 10 μL per well in triplicates into 384-well plate.
- Cover plate with adhesive film tightly and centrifuge plate at 1,800 x g for 5 min.
- Using a Real-Time PCR instrument set up qPCR reaction under conditions shown in the Table 1.
- Using the cycle threshold (CT) values and the comparative CT (ΔΔCT) method31 calculate the percentage (%) of mRNA distribution in prepolysomes, light, and heavy polysomes as described32 with one modification. Use synthetic RNA (OmpA here) for data normalization in RT-qPCR data analysis. The synthetic RNA provides a normalization control that allows to calculate relative mRNAs levels and compare them in different fractions of a gradient.
8. Analysis of Proteins in Polysomal Fractions by Western Blotting
- From a 100% (w/v) stock, add trichloroacetic acid (TCA) to the selected fractions (500 μL) to a final concentration of 10%, keep on ice for at least 15 min, centrifuge in a microfuge for 5 min, discard supernatant, wash twice with ice-cold acetone and dissolve in 25 μL of SDS-PAGE sample loading buffer for electrophoresis.
- Load on the SDS-PAGE and conduct standard electrophoresis with following transfer to the PVDF membrane. Proceed to Western blotting33.
Results
In this study, we describe the application of the polysomal profiling technique to three different sources: parasitic Leishmania major, cultured human cells, and mouse testis. Leishmania cells freely grow in the liquid media in suspension, cultured human cells grow in the adherent monolayer on plates, and the mouse testis represents a tissue sample. The method can be easily adjusted to other types of freely grown cells in suspension, different types of tissues, or from another organism, and different types of cultured cells. The approach consists of four major steps: lysate preparation, a sucrose gradient preparation and ultracentrifugation step, polysome fractionation and sample collection followed by analysis of the fractions. Cells from different sources are collected, washed and lysed in lysis buffer by passage through a needle or Dounce homogenizer. Centrifugation is used to remove cell debris, clarifying the lysate. The scheme of gradient fractionation is shown in Figure 1A. A continuous sucrose gradient is formed by the mixing of 10% and 50% sucrose solutions in a gradient maker. The lysate is loaded on the top of the gradient. Ultracentrifugation separates mRNAs associated with a different number of ribosomes which is monitored by a UV detector during fractionation, forming a distinct absorbance spectrum. Collected fractions are used for RNA and protein analysis (Figure 1B). RNA can be analyzed by electrophoresis followed by Northern blot or used for cDNA production followed by a RT-qPCR reaction to analyze the association of individual mRNAs with polysomes. Next-generation sequencing can be used to analyze the translational status of mRNAs on a genome-wide scale7. For protein analysis of polysomal fractions, proteins are precipitated with trichloroacetic acid to concentrate them. Proteins are then analyzed by Western blotting or by mass spectroscopy at the proteome level.
A typical polysomal profile generated from Leishmania major actively growing culture is shown in Figure 2A. The absorbance graph of the fractionation has a distinct shape with typical peaks for ribosome subunits (40S and 60S), single ribosomes (80S or monosomes) and polysomes.
Quantitative RT-PCR (RT-qPCR) was employed to detect association of individual Leishmania mRNAs with ribosomes and polysomes. The comparative CT (ΔΔCT)31 method is a simple and appropriate approach to study relative mRNAs levels in the cells. This method requires an internal control (a stable mRNA, that does not change expression during treatments or conditions of the experiment) for calculations. However, there is no internal control in polysomal fractions because levels of any mRNA or ribosomal RNA will vary in fractions, depending on their association with ribosomes, polysomes, etc. To solve the problem of an internal control, we have used synthetic bacterial OmpA mRNA for normalization of relative individual Leishmania mRNA levels in the fractions. OmpA mRNA was synthesized in vitro and added in equal amounts to each fraction before RNA extractions. Addition of the synthetic RNA is important because it makes calculations of RT-qPCR data more precise, serving as internal control for calculations by comparative CT (ΔΔCT) method.
Aliquots of the gradient fractions were mixed into three groups: prepolysomes (subunits and monosomes), light polysomes (consisting of 2-4 ribosomes), and heavy polysomes (consisting of 5-8 ribosomes). RT-qPCR was performed on RNA from combined fractions to analyze mRNA distribution between these combined fractions (Figure 2B). 18S ribosomal RNA was used as a control. Its relative levels determined by RT-qPCR correlated well with the estimated distribution of the small ribosomal subunits (free subunit, and as a part of monosomes and polysomes) on the spectrum. RT-qPCR analysis revealed that individual mRNAs tested have a different degree of engagement in translation during logarithmic phase of Leishmania growth. Tubulin mRNA is associated preferentially with heavy polysomes, suggesting efficient translation. In contrast, Sherp mRNA is found primarily with prepolysomes and light polysomes supporting less active translation in comparison with tubulin mRNA.
Expression of recombinant proteins in cultured cells is an important experimental approach in diverse categories of studies. Here, we present an example of polysomal profiling of recombinant protein mRNAs in another sample source, cultured human cells. HeLa cells were transiently transfected with plasmids expressing recombinant cystic fibrosis transmembrane conductance regulator (CFTR)34 or Norrie disease protein (NDP). Absorbance spectra of polysome fractionation from these two independent cultures were very similar and contained distinct peaks corresponding ribosomal subunits (40S and 60S), monosomes (80S), and polysomes (Figure 3A). Similarity in the spectra from these experiments illustrates reproducibility of the gradient fractionation. Like in the Leishmania studies, the distribution of mRNAs was determined by RT-qPCR in the fractions representing prepolysomes, light polysomes, and heavy polysomes (Figure 3B). Detection of small ribosomal subunit 18S RNA correlated with their estimated distribution in the spectra. NDP mRNAs were mostly associated with light and heavy polysomal fractions, while CFTR mRNAs were mostly found in prepolysome fractions, suggesting that NDP is translated more efficiently. While NDP is a relatively small protein, CFTR is a very large protein (1480 amino acid residues) consisting from several domains, that fold independently during translation35. Lower engagements of CFTR mRNA with polysomes may reflect slower translation that is required for cotranslational folding of its distinct domains.
Polysome fractions can be also used for detection of proteins. Detection of proteins in the gradient fractions was conducted on the example of ribosomal proteins in HeLa cells (Figure 4). Proteins were concentrated by precipitation with 10% TCA from the fractions and Western blot was used to detect the small subunit ribosomal protein RPS6 and large subunit ribosomal protein RPL11 (Figure 4,top panel). Their distribution correlated well with the distinct peaks on the absorbance spectrum. These experiments clearly demonstrate that the polysome fractions can be used to analyze proteins in them.
Many different sucrose concentrations gradients (for instance, 7-47%36, 5-50%7, 7-50%6 , 10-50%37, 15-50%8, and others) for polysomes fractionation were used. Here, we compared two gradients 10-50% and 17-51% (Figure 5). Although, 17-51% produced acceptable results, the separation in the 10-50% gradient was overall better.
It is well documented that chelating agents, such as EDTA, disrupt ribosomes and polysomes8,9. As it is shown in Figure 6, EDTA treatment of the HeLa lysate before loading on the gradient leads to disappearance of the peaks, corresponding to monosomes and polysomes, and significant increase in the ribosome subunits peaks. This experiment served as a control and demonstrated that the observed peaks without EDTA treatment are actually ribosomal monosomes and polysomes.
Figure 7 shows results of polysome fractionation from mouse testes. The absorbance spectrum has similarities with those from Leishmania and HeLa cells: distinct peaks of ribosomal subunits, monosomes and polysomes. Their shape and distribution produce a signature appearance, that make it easy to identify them on different polysomal spectra. Total RNAs were purified from the fractions and RNAs from selected fractions were analyzed by electrophoresis in agarose gel (Figure 7, top panel). The electrophoresis shows typical distribution of 18S and 28S ribosomal RNAs. Their sharp bands indicate intactness of the samples. The gel may be used for individual mRNAs detection by a following Northern blot or it can be used to evaluate quality of the samples before further experiments on RNA or protein analysis - the diffused ribosomal RNAs bands indicate RNA degradation in the samples.
During our studies, we used RNase inhibitor and Heparin as RNase inhibitors in the lysates and sucrose gradients. While both of them provided satisfactory results, the use of RNase inhibitor was preferable for RNA analysis because it does not inhibit the cDNA and RT-qPCR reactions. Thus, it did not require additional RNA purification steps. However, if researchers decide to use heparin during polysome preparation, be aware that heparin inhibits down-stream applications such as RT-qPCR and additional RNA purification step is needed (see Protocol section 6).
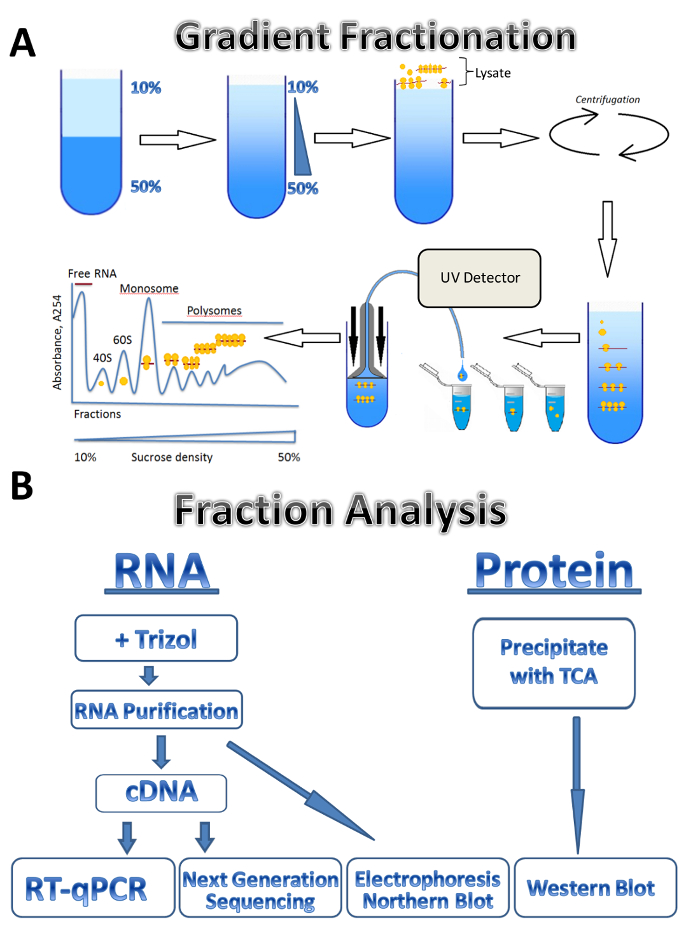
Figure 1. Polysome profiling. (A) Scheme of gradient preparation, polysome fractionation and absorbance profile. (B) Scheme of fraction analysis. Please click here to view a larger version of this figure.

Figure 2. Polysome profile analysis of Leishmania major culture in logarithmic stage of growth. (A) Cytoplasmic lysate was fractionated in 10-50% sucrose gradient. (B) Relative distribution of 18S RNA, tubulin and Sherp mRNAs (%) in prepolysomes, light and heavy polysomes of log cells analyzed by RT-qPCR. Fractions containing 40S, 60S and monosomes were combined as prepolysomes. Fractions with 2-4 ribosomes were combined as light polysomes, while fractions with 5-8 ribosomes formed heavy polysomes. Synthetic E. coli OmpA mRNA added to fractions prior RNA extraction served as a normalization control in RT-qPCR. Comparative CT (ΔΔCT)31 method was used for calculation of mRNA levels. Error bars represent standard errors. Please click here to view a larger version of this figure.
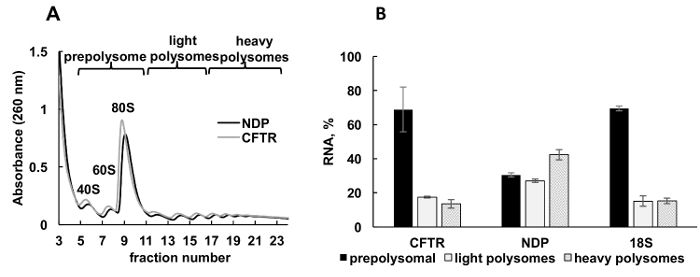
Figure 3. Polysome fractionation and analysis of recombinant CFTR and NDP mRNAs association with ribosomes in HeLa cells transfected with plasmid DNAs. (A) Polysomal profile in HeLa cells transfected with CFTR and NDP plasmids. 10%-50% sucrose gradient was applied to achieve separation of polysomes. The peaks for small (40S) and large (60S) subunits, as well as monosome (80S) are indicated. Fractions were combined as shown on panel A and used for further analysis. (B) Distribution of mRNAs of CFTR and NDP in different fractions. Detection of 18S by RT-qPCR was used as a control for polysome fractionation. RNA levels were evaluated by RT-qPCR analysis. Data were normalized using synthetic mRNA. Comparative CT (ΔΔCT)31 method was used for calculation of mRNA levels.Error bars represent standard errors. Please click here to view a larger version of this figure.

Figure 4. Detection of ribosomal proteins in HeLa polysomal fractions. HeLa cell lysate was subjected by 10%-50% sucrose gradient centrifugation. Proteins in selected fractions were precipitated with TCA and analyzed by electrophoresis in 12% SDS-PAGE with following Western blotting using mouse monoclonal RPS6 and rabbit polyclonal RPL11 antibody as primary antibodies and Peroxidase-Conjugated Goat anti-mouse or anti-rabbit secondary antibodies. Visualization of signals was done by SuperSignal West Pico PLUS chemiluminescent substrate. Please click here to view a larger version of this figure.
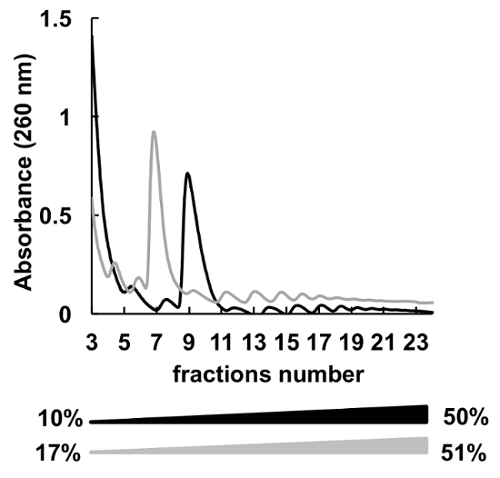
Figure 5. Comparison of HeLa polysomal profiling in 10%-50% (black) or 17%-51% (grey) sucrose gradients. Please click here to view a larger version of this figure.

Figure 6. Effect of EDTA treatment on polysomal profile in HeLa cells. HeLa cell lysate was treated with 10 mM EDTA on ice for 10 min immediately before sucrose gradient centrifugation. MgCl2 was substituted by 5 mM EDTA in sucrose gradient solutions. Please click here to view a larger version of this figure.
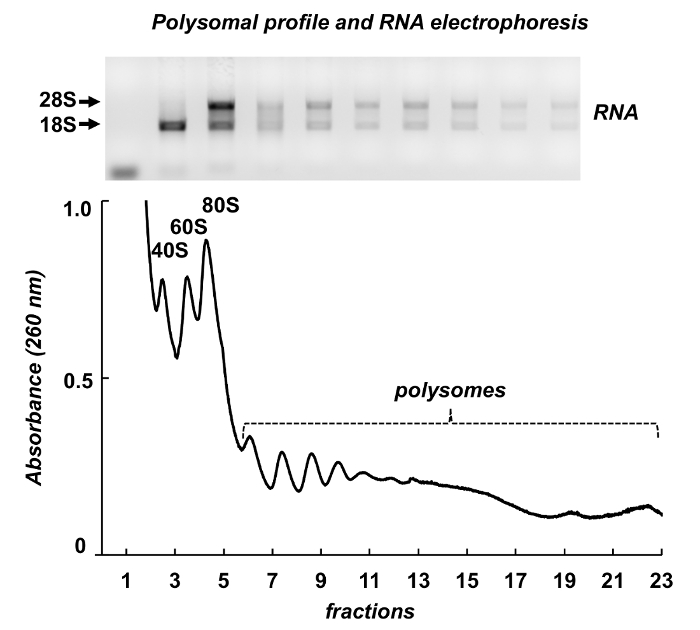
Figure 7. Polysomal profile from mouse testis tissue lysate. Fractions were subjected to RNA extraction with a RNA purification reagent and analyzed by electrophoresis in 1% agarose gel. Please click here to view a larger version of this figure.
| Stage | Step | Condition |
| Hold | Step 1 | Increase the temperature from 25 to 50°C with 1.6°C/s |
| Incubate at 50°C for 2:00 min | ||
| Step 2 | Increase the temperature from 50 to 95°C with 1.6°C/s | |
| Incubate at 95°C for 10:00 min | ||
| PCR | Step 1 | Incubate at 95°C for 00:15 min |
| Step 2 | Decrease the temperature from 95 to 60°C with 1.6°C/ | |
| Incubate at 60°C for 1:00 min | ||
| Number of cycles 40 | ||
| Melt Curve | Step1 | Increase the temperature from 60 to 95°C with 1.6°C/s |
| Step 2 | Decrease the temperature from 95 to 60°C with 1.6°C/s | |
| Incubate at 60°C for 1:00 min | ||
| Step 3 (dissociation) | Increase the temperature from 60 to 95°C with 0.05°C/s | |
| Incubate at 95°C for 00:15 min | ||
Table 1. Conditions for RT-qPCR
Discussion
Polysome fractionation by sucrose gradient combined with RNA and protein analysis of fractions is a powerful method to analyze translational status of individual mRNAs or the whole translatome as well as roles of protein factors regulating translational machinery during normal physiological or disease state. Polysomal profiling is an especially suitable technique to study translational regulation in organisms such as trypanosomatids including Leishmania where transcriptional control is largely absent and gene expression regulation mostly occurs during translation.
Here, we describe a polysome fractionation protocol used on three models: Leishmania parasites, cultured human cells and mouse tissues. The polysome fractionation step is essentially the same for different organisms used in this study; however, the lysate preparation has some differences. Leishmania cells grow in liquid culture and is collected by centrifugation and cells are counted prior to lysis to ensure equal loading on the gradient. Human cells can be washed and lysed directly on the plate. The equal loading is controlled by optical density. Mouse tissues require a Dounce homogenizer for efficient lysis while in the case of Leishmania and human cells, it is sufficient to pass them through the 23-gauge needle.
All reagents used should be RNase and protease free. We compared the heparin and RNase inhibitor as inhibitors of RNase activity in the cytoplasmic lysates. We found that both reagents can effectively block RNase. However, heparin affects downstream applications such as cDNA preparation and RT-qPCR. As a result, preparation of RNA requires an additional purification step when heparin is used. In our opinion, the RNase inhibitor is more convenient choice and can be used effectively in polysome profiling protocol.
Polysomal profiling is labor intensive, which is a major limitation of the method. Up to six gradients can be prepared at the same time. The gradient fractionator generates 144 fractions that need to be processed in a short period of time. Analysis of individual fractions can be time consuming and expensive too. Therefore, combining individual fractions into pre-polysomes, light and heavy polysomes provides a fast and less laborious way to estimate translational activity of individual mRNAs. Our RT-qPCR results on the combined fractions allowed us to identify differences in translatability of different mRNAs both in Leishmania and HeLa cells (Figures 2, 3). However, if finer resolution is needed, then analysis of individual fractions can be performed.
Ribosome profiling is another method to study the translational status of mRNA and is based on measurement of protein production via sequencing of mRNA fragments protected by ribosome38. This technology provides quantitative information associating mRNA sequences with specific polysomal fractions being translated in a sample, and can provide precise information on the translational status of mRNAs at codon resolution in comparison with polysome profiling technology. However, polysome profiling can be used for both RNA and protein analysis, thus providing additional information on proteome of polysomes and identify factors contributing to the regulation of translation.
Therefore, polysomal profiling is a versatile technique that can be used to analyze translational state of individual mRNAs, examine ribosome-associated proteins and study translational regulation in different model organisms under different experimental conditions.
Disclosures
The authors have nothing to disclose.
Acknowledgements
The authors thank Ching Lee for help with audio recording.The research was supported by the Start-up funds from Texas Tech University Health Sciences Center and by the Center of Excellence for Translational Neuroscience and Therapeutics (CTNT) grant PN-CTNT 2017-05 AKHRJDHW to A.L.K.; in part by NIH grant R01AI099380 to K.Z. James C. Huffman and Kristen R. Baca were CISER (Center for the Integration of STEM Education & Research) scholars and were supported by the program.
Materials
| Name | Company | Catalog Number | Comments |
|---|---|---|---|
| Instruments: | |||
| Gradient master | Biocomp Instruments Inc. | 108 | |
| Piston Gradient Fractionator | Biocomp Instruments Inc. | 152 | |
| Fraction collector | Gilson, Inc. | FC203B | |
| NanoDrop One | Thermo Scientific | NanoDrop One | |
| Nikon inverted microscope | Nikon | ECLIPSE Ts2-FL/Ts2 | |
| 2720 Thermal Cycler | Applied Biosystems by Life Technologies | 4359659 | |
| CO2 incubator | Panasonic Healthcare Co. | MCO-170A1CUV | |
| HERATHERM incubator | Thermo Scientific | 51028063 | |
| Biological Safety Cabinet, class II, type A2 | NuAire Inc. | NU-543-400 | |
| Revco freezer | Revco Technologies | ULT1386-5-D35 | |
| Beckman L8-M Ultracentifuge | Beckman Coulter | L8M-70 | |
| Centrifuge | Eppendorf | 5810R | |
| Centrifuge | Eppendorf | 5424 | |
| Ultracentrifuge Rotor SW41 | Beckman Coulter | 331362 | |
| Swing-bucket rotor | Eppendorf | A-4-62 | |
| Fixed angle rotor | Eppendorf | F-45-30-11 | |
| Quant Studio 12K Flex Real-Time PCR machine 285880228 | Applied Biosystems by life technologies | 4470661 | |
| TC20 Automated cell counter | Bio-Rad | 145-0102 | |
| Hemacytometer | Hausser Scientific | 02-671-51B | |
| Software | |||
| Triax software | Biocomp Instruments Inc. | ||
| Materials: | |||
| Counting slides, dual chamber for cell counter | Bio-Rad | 145-0011 | |
| 1.5 mL microcentrifuge tube | USA Scientific | 1615-5500 | |
| Open-top polyclear centrifuge tubes, (14 mm x 89 mm) | Seton Scientific | 7030 | |
| Syringe, 5 mL | BD | 309646 | |
| BD Syringe 3 mL23 Gauge 1 Inch Needle | BD | 10020439 | |
| Nunclon Delta Surface plate, 14 cm | Thermo Scientific | 168381 | |
| Nunclon Delta Surface plate, 9 cm | Thermo Scientific | 172931 | |
| Nalgene rapid-flow 90mm filter unit, 500 mL, 0.2 aPES | Thermo Scientific | 569-0020 | |
| BioLite 75 cm3 flasks | Thermo Scientific | 130193 | |
| Nunc 50 mL conical centrifuge tubes | Thermo Scientific | 339653 | |
| Chemicals: | |||
| Trizol LS | Ambion by Life Technologies | 10296028 | |
| HEPES | Fisher Scientific | BP310-500 | |
| Trizma base | Sigma | T1378-5KG | |
| Dulbecco's Modified Eagle's Medium-high glucose (DMEM) | Sigma | D6429-500ML | |
| Fetal Bovine Serum (FBS) | Sigma | F0926-50ML | |
| Penicillin-Streptomycin (P/S) | Sigma | P0781-100ML | |
| Lipofectamine 2000 | Invitrogen | 11668-019 | |
| Dulbecco's phosphate buffered saline (DPBS) | Sigma | D8537-500ML | |
| Magnesium chloride hexahydrate (MgCl2x6H2O) | Acros Organics | AC413415000 | |
| Potassium Chloride (KCl) | Sigma | P9541-500G | |
| Nonidet P 40 (NP-40) | Fluka (Sigma-Aldrich) | 74385 | |
| Recombinant Rnasin Ribonuclease Inhibitor | Promega | N2511 | |
| Heparin sodium salt | Sigma | H3993-1MU | |
| cOmplete Mini EDTA-free protease inhibitors | Roche Diagnostics | 11836170001 | |
| Glycogen | Thermo Scientific | R0551 | |
| Water | Sigma | W4502-1L | |
| Cycloheximide | Sigma | C7698-1G | |
| Chloroform | Fisher Scientific | 194002 | |
| Dithiotreitol (DTT) | Fisher Scientific | BP172-5 | |
| Ethidium Bromide | Fisher Scientific | BP-1302-10 | |
| Ethylenediaminetetraacetic acid disodium dehydrate (EDTA) | Fisher Scientific | S316-212 | |
| Optimem | Life Technologies | 22600050 | |
| Puromycin dihydrochloride | Sigma | P8833-100MG | |
| Sucrose | Fisher Scientific | S5-3KG | |
| Trypsin-EDTA solution | Sigma | T4049-100ML | |
| Hgh Capacity cDNA Reverse Transcriptase Kit | Applied Biosystems by life technologies | 4368814 | |
| Power SYBR Green PCR Master Mix | Applied Biosystems by life technologies | 4367659 | |
| HCl | Fisher Scientific | A144SI-212 | |
| Isopropanol | Fisher Scientific | BP26324 | |
| Potassium Hydroxide (KOH) | Sigma | 221473-500G | |
| Anti-RPL11 antibody | Abcam | ab79352 | |
| Ribosomal protein S6 (C-8) antibody | Santa Cruz Biotechnology Inc. | sc-74459 | |
| 1xM199 | Sigma | M0393-10X1L | |
| Lithium cloride | Sigma | L-9650 | |
| Dimethyl sulfoxide (DMSO) | Fisher Scientific | D128-500 | |
| Gel Loading Buffer II | Thermo Scientific | AM8546G | |
| UltraPure Agarose | Thermo Scientific | 16500-100 | |
| Trichloracetic acid (TCA) | Fisher Scientific | A322-100 | |
| SuperSignal West Pico PLUS chemiluminescent substrate | Thermo Scientific | 34580 | |
| Formaldehyde | Fisher Scientific | BP531-500 | |
| Sodium Dodecyl Sulfate (SDS) | Sigma | L5750-1KG | |
| Phenylmethylsulfonyl fluoride (PMSF) | Sigma | P7626-5G | |
| RNeasy Mini kit | Qiagen | 74104 | |
| Adenosine 5′-triphosphate disodium salt hydrate (ATP) | Sigma | A1852-1VL | |
| Cytosine 5'-triphosphate disodium salt hydrate (CTP) | Sigma | C1506-250MG | |
| Uridine 5'-triphosphate trisodium salt hydrate (UTP) | Sigma | U6625-100MG | |
| Guanosine 5'-triphosphate sodium salt hydrate (GTP) | Sigma | G8877-250MG | |
| SP6 RNA Polymerase | NEB | M0207S | |
| Pyrophoshatase | Sigma | I1643-500UN | |
| Spermidine | Sigma | S0266-1G |
References
- Schwanhausser, B., et al. Global quantification of mammalian gene expression control. Nature. 473 (7347), 337-342 (2011).
- Capewell, P., et al. Regulation of Trypanosoma brucei Total and Polysomal mRNA during Development within Its Mammalian Host. PLoS One. 8 (6), e67069(2013).
- Warner, J. R., Knopf, P. M., Rich, A. A multiple ribosomal structure in protein synthesis. Proceedings of the National Academy of Science, USA. 49, 122-129 (1963).
- Piccirillo, C. A., Bjur, E., Topisirovic, I., Sonenberg, N., Larsson, O. Translational control of immune responses: from transcripts to translatomes. Nature Immunology. 15 (6), 503-511 (2014).
- Ennis, H. L., Lubin, M. Cycloheximide: Aspects of Inhibition of Protein Synthesis in Mammalian Cells. Science. 146 (3650), 1474-1476 (1964).
- Masek, T., Valasek, L., Pospisek, M. Polysome analysis and RNA purification from sucrose gradients. Methods in Molecular Biology. 703, 293-309 (2011).
- Gandin, V., et al. Polysome fractionation and analysis of mammalian translatomes on a genome-wide scale. Journal of Visualized Experiments. (87), (2014).
- Zuccotti, P., Modelska, A. Studying the Translatome with Polysome Profiling. Methods in Molecular Biology. 1358, 59-69 (2016).
- Chasse, H., Boulben, S., Costache, V., Cormier, P., Morales, J. Analysis of translation using polysome profiling. Nucleic Acids Research. 45 (3), e15(2017).
- Arava, Y., et al. Genome-wide analysis of mRNA translation profiles in Saccharomyces cerevisiae. Proceedings of the National Academy of Science, USA. 100 (7), 3889-3894 (2003).
- Gandin, V., et al. nanoCAGE reveals 5' UTR features that define specific modes of translation of functionally related MTOR-sensitive mRNAs. Genome Research. 26 (5), 636-648 (2016).
- Bazzini, A. A., Lee, M. T., Giraldez, A. J. Ribosome profiling shows that miR-430 reduces translation before causing mRNA decay in zebrafish. Science. 336 (6078), 233-237 (2012).
- Zanchin, N. I., Goldfarb, D. S. Nip7p interacts with Nop8p, an essential nucleolar protein required for 60S ribosome biogenesis, and the exosome subunit Rrp43p. Molecular Cell Biology. 19 (2), 1518-1525 (1999).
- Darnell, J. C., et al. FMRP stalls ribosomal translocation on mRNAs linked to synaptic function and autism. Cell. 146 (2), 247-261 (2011).
- Gkogkas, C. G., et al. Autism-related deficits via dysregulated eIF4E-dependent translational control. Nature. 493 (7432), 371-377 (2013).
- Robichaud, N., Sonenberg, N. Translational control and the cancer cell response to stress. Curr Opin Cell Biol. 45, 102-109 (2017).
- Gordon, B. S., Kelleher, A. R., Kimball, S. R. Regulation of muscle protein synthesis and the effects of catabolic states. International Journal of Biochemistry and Cell Biology. 45 (10), 2147-2157 (2013).
- Ishimura, R., et al. RNA function. Ribosome stalling induced by mutation of a CNS-specific tRNA causes neurodegeneration. Science. 345 (6195), 455-459 (2014).
- Petersen, C. P., Bordeleau, M. E., Pelletier, J., Sharp, P. A. Short RNAs repress translation after initiation in mammalian cells. Molecular Cell. 21 (4), 533-542 (2006).
- Juntawong, P., Girke, T., Bazin, J., Bailey-Serres, J. Translational dynamics revealed by genome-wide profiling of ribosome footprints in Arabidopsis. Proceedings of the National Academy of Science, USA. 111 (1), E203-E212 (2014).
- Bunnik, E. M., et al. Polysome profiling reveals translational control of gene expression in the human malaria parasite Plasmodium falciparum. Genome Biology. 14 (11), R128(2013).
- De Gaudenzi, J. G., Noe, G., Campo, V. A., Frasch, A. C., Cassola, A. Gene expression regulation in trypanosomatids. Essays in Biochemistry. 51, 31-46 (2011).
- Alves, L. R., Goldenberg, S. RNA-binding proteins related to stress response and differentiation in protozoa. World Journal of Biological Chemistry. 7 (1), 78-87 (2016).
- De Pablos, L. M., Ferreira, T. R., Walrad, P. B. Developmental differentiation in Leishmania lifecycle progression: post-transcriptional control conducts the orchestra. Current Opinions in Microbiology. 34, 82-89 (2016).
- Soto, M., et al. Cell-cycle-dependent translation of histone mRNAs is the key control point for regulation of histone biosynthesis in Leishmania infantum. Biochemical Journal. 379, 617-625 (2004).
- McNicoll, F., et al. Distinct 3 '-untranslated region elements regulate stage-specific mRNA accumulation and translation in Leishmania. Journal of Biological Chemistry. 280 (42), 35238-35246 (2005).
- Folgueira, C., et al. The translational efficiencies of the two Leishmania infantum HSP70 mRNAs, differing in their 3 '-untranslated regions, are affected by shifts in the temperature of growth through different mechanisms. Journal of Biological Chemistry. 280 (42), 35172-35183 (2005).
- Dumas, C., Chow, C., Muller, M., Papadopoulou, B. A novel class of developmentally regulated noncoding RNAs in Leishmania. Eukaryotic Cell. 5 (12), 2033-2046 (2006).
- Kapler, G. M., Coburn, C. M., Beverley, S. M. Stable transfection of the human parasite Leishmania major delineates a 30-kilobase region sufficient for extrachromosomal replication and expression. Molecular Cell Biology. 10 (3), 1084-1094 (1990).
- Karamyshev, A. L., Johnson, A. E. Selective SecA association with signal sequences in ribosome-bound nascent chains: a potential role for SecA in ribosome targeting to the bacterial membrane. Journal of Biological Chemistry. 280 (45), 37930-37940 (2005).
- Schmittgen, T. D., Livak, K. J. Analyzing real-time PCR data by the comparative C(T) method. Nature Protocols. 3 (6), 1101-1108 (2008).
- Panda, A. C., Martindale, J. L., Gorospe, M. Polysome Fractionation to Analyze mRNA Distribution Profiles. Bio Protocols. 7 (3), (2017).
- Sambrook, J., Fritsch, E. F., Maniatis, T. Molecular Cloning. A Laboratory Manual. , Cold Spring Harbor Laboratory Press. (1989).
- Patrick, A. E., Karamyshev, A. L., Millen, L., Thomas, P. J. Alteration of CFTR transmembrane span integration by disease-causing mutations. Molecular Biology of the Cell. 22 (23), 4461-4471 (2011).
- Kleizen, B., van Vlijmen, T., de Jonge, H. R., Braakman, I. Folding of CFTR is predominantly cotranslational. Molecular Cell. 20 (2), 277-287 (2005).
- van den Elzen, A. M., Schuller, A., Green, R., Seraphin, B. Dom34-Hbs1 mediated dissociation of inactive 80S ribosomes promotes restart of translation after stress. EMBO Journal. 33 (3), 265-276 (2014).
- Morita, M., et al. mTOR Controls Mitochondrial Dynamics and Cell Survival via MTFP1. Molecular Cell. 67 (6), 922-935 (2017).
- Ingolia, N. T., Ghaemmaghami, S., Newman, J. R., Weissman, J. S. Genome-wide analysis in vivo of translation with nucleotide resolution using ribosome profiling. Science. 324 (5924), 218-223 (2009).
Reprints and Permissions
