Minor workers of the ant species Colobopsis explodens are dissected to isolate the wax-like content stored in their hypertrophied mandibular gland reservoirs for subsequent solvent-extraction and analysis by gas chromatography-mass spectrometry. The annotation and identification of volatile constituents using the open-source software MetaboliteDetector is also described.
Method Article
Isolation of Mandibular Gland Reservoir Contents from Bornean 'Exploding Ants' (Formicidae) for Volatilome Analysis by GC-MS and MetaboliteDetector
In This Article
Summary
Abstract
The aim of this manuscript is to present a protocol describing the metabolomic analysis of Bornean 'exploding ants' belonging to the Colobopsis cylindrica (COCY) group. For this purpose, the model species C. explodens is used. Ants belonging to the minor worker caste possess distinctive hypertrophied mandibular glands (MGs). In territorial combat, they use the viscous contents of their enlarged mandibular gland reservoirs (MGRs) to kill rival arthropods in characteristic suicidal 'explosions' by voluntary rupture of the gastral integument (autothysis). We show the dissection of worker ants of this species for the isolation of the gastral portion of the wax-like MGR contents as well as listing the necessary steps required for solvent-extraction of the therein contained volatile compounds with subsequent gas chromatography-mass spectrometry (GC-MS) analysis and putative identification of metabolites contained in the extract. The dissection procedure is performed under cooled conditions and without the use of any dissection buffer solution to minimize the changes in the chemical composition of the MGR contents. After solvent-based extraction of volatile metabolites contained therein, the necessary steps for analyzing the samples via liquid-injection-GC-MS are presented. Lastly, data processing and putative metabolite identification with the use of the open-source software MetaboliteDetector is shown. With this approach, the profiling and identification of volatile metabolites in MGRs of ants belonging to the COCY group via GC-MS and the MetaboliteDetector software become possible.
Introduction
The overall goal of the workflow presented here is the general investigation of chemical compositions in secretions of insects. This is done with the primary aim of elucidating the ecological roles of the secretion as a whole, or of single compounds thereof. Moreover, we are interested in investigating the metabolic pathways underlying the compounds found in the respective secretions. Especially gland contents from ants (Hymenoptera, Formicidae) have gained rising interest in the past years, because they provide sources of hitherto unexplored potentially bioactive compounds (glues, antimicrobials, etc.)1,2. Minor worker ants of some species belonging to the COCY group3,4 may provide such compounds contained in their hypertrophied MGRs which extend from the mouthparts to the gaster5,6. When threatened by putative enemies, minor workers of C. explodens7 and some related species can make use of their MGR contents in an unusual way: They sacrifice themselves by rupturing their gastral wall to eject the sticky content of the MGRs explosively onto the opponent, whereupon the putative enemy is detained and may even die5,6,8,9. The purpose of the development and the use of the herein presented methods was to help improve the understanding of the chemical composition and the nature of tentatively toxic constituents of this ant secretion.
To this end, we present a protocol for the dissection of C. explodens worker ants to obtain the gastral portion of their wax-like MGR contents with subsequent solvent-extraction and analysis by GC-MS.
GC-MS analysis is one of the well-established methods for the profiling and identification of volatile metabolites (volatilome) from insects. Typical analytes of interest in ants include cuticular hydrocarbons10, semiochemicals11, and in general, compounds with biological activity12. Samples can be obtained from whole animals or from body parts and fluids isolated via dissection of the insect13,14. Sample preparation techniques include extraction of the therein contained metabolites with the use of solvents14 or headspace-solid-phase-microextraction (HS-SPME)15.
For metabolomic studies, it is vital that the samples are frozen rapidly directly after sampling, in order to minimize changes in the chemical composition and quantity of the compounds. The ants used for this study were killed by rapid freezing on-site in a cool bag stuffed with deep-frozen cold packs. The samples were then stored in a -20 °C freezer using generator-driven electricity, before they were transported to the laboratory on dry ice. The dissection procedure presented here offers the possibility to isolate MGR contents without analyzing the whole ant or the gaster as a whole, as it has been done before for different COCY species16,17,18. Moreover, the presented protocol also enables direct access and analysis of the surrounding glands and tissues, like the venom gland (VG)5,8, the Dufour's gland (DG)8, or the intestines in other biological studies, or to check for possible cross-contaminations introduced during handling or dissection of the ants. To minimize the changes in the chemical composition of the MGR contents during dissection, either by thawing samples or by using chemicals, the dissection process was optimized to be carried out on a cold pack (-20 °C), without the use of any additional buffers, washing solutions, or solvents. The samples obtained via this method are suitable for answering qualitative and quantitative questions.
Data analysis for the purpose of putative metabolite annotation and identification is done via the open-source software MetaboliteDetector19, which was developed for the automatic analysis of GC-MS-based metabolomics data. It detects single ion peaks present in chromatograms, performs a deconvolution step, and extracts the deconvoluted mass spectra of chemical compounds contained in the analyzed samples. Putative identification of compounds with MetaboliteDetector is based on the determined retention index (RI; the Kovats RI can be calculated automatically by the software) as well as similarity of the deconvoluted mass spectra. RI and spectral match factor can be cross-checked against either existing reference libraries (that can be imported, if they are in the common NIST format), or against an established in-house library. This is in accordance to the guidelines for (putative) compound identification suggested, e.g., by the Chemical Analysis Working Group (CAWG) of the Metabolomics Standards Initiative (MSI), where a minimum of two independent and orthogonal data relative to an authentic compound (here retention time (RT)/RI and mass spectrum) analyzed under identical experimental conditions are proposed as necessary to confirm non-novel metabolite identifications20.
The complete experiment is conducted on the MGR content of the COCY model species C. explodens, but the dissection steps can also be adapted to isolate the other glands present in the ant gaster. Moreover, while we present a protocol for the comprehensive analysis of the volatilome of the MGR content, the more generic parts of the workflow describing extraction, GC-MS measurement, and data evaluation can also be used for analysis and (putative) identification of volatile metabolites in general.
Since the experiments described in this manuscript are carried out on insects, no ethical approval is required. Field work, sampling of the ants, as well as their use for publication are in accordance with the guidelines regulating this project through the Universiti Brunei Darussalam, Brunei's Research and Innovation Centre and Brunei's Forestry Department, Brunei Darussalam.
Protocol
1. Collection of Ants
- Collect minor worker ants with the use of an aspirator (Figure 1).
- Immediately after sampling, fix the ants by rapid freezing at -20 °C and store them at this or a lower temperature until analysis.
2. Isolation of the MGR Contents and DG from Ants
- Before the dissection of ants, prepare the following:
- Clean the glass Petri dish and the dissection instruments using a methanol-water mixture (MeOH/H2O; 1+1 v/v) and tissues.
CAUTION: MeOH is toxic to humans. Always wear appropriate gloves, a lab coat, and goggles, and perform the cleaning under a fume hood. - Freeze the cold pack and the glass Petri dish to -20 °C.
- Determine the masses of 1.5 mL short thread vials including screw caps with silicone/polytetrafluoroethylene (PTFE) septa and keep them on ice directly next to the microscope.
Note: The choice of the sample vial is optional. Here, the MGR contents are put directly into cooled 1.5 mL vials made of glass. Plastics can contain compounds (e.g., phthalates) that may cause artifacts, which interfere with the signals of the target metabolites. - Place the frozen cold pack into a box made of extruded polystyrene foam. Place the Petri dish on top of the cold pack and put a frozen ant into the dish. Mount the box under a stereo microscope. Adjust the magnification (20–40X) and focus until the whole ant can be seen clearly.
- Clean the glass Petri dish and the dissection instruments using a methanol-water mixture (MeOH/H2O; 1+1 v/v) and tissues.
- Check the frozen ant for the integrity of its gastral compartments. For dissection, take only ants with an intact gaster region (Figure 2A, B). Exclude ants with flat gasters or traces of hardened MGR content on their body surfaces from further analysis (Figure 2C, D).
- Grab the selected ant with one pair of fine-tipped forceps at the propodeum (first abdominal segment) and with the other pair of forceps at the petiole (second abdominal segment). Detach the gaster region by gently pulling it away from the rest of the ant body (Figure 3A).
- Fix the now separated ant gaster by holding it with fine-tipped forceps at tergite 4. With another pair of fine-tipped forceps grab tergite 1 (located next to the petiole) and gently remove it by peeling it off (Figure 3B). Repeat this also for tergites 2 and 3 (Figure 3C, D) until the gastral portion of the MGRs (yellow colored in C. explodens worker ants, but the color of the MG content can range from white over yellow to red in other species) is visible for the most part.
Note: By removing the exoskeleton, the membrane of the MGR will also be partly removed. - By the use of a dissection needle, gently remove the wax-like contents of the paired MGRs by scratching them out of the gastral compartment (Figure 3E). Only remove those parts of the MGR content that can be isolated without rupturing other glands present in the ant gaster. If more force or efforts have to be applied to obtain the MGR content as a whole, accept its incomplete removal (Figure 4).
- Pick up the MGR contents by gently touching them with the tip of the dissection needle until they stick onto it. Then transfer the MGR contents into a cooled 1.5 short thread vial with known tare mass.
- To remove the sticky MGR contents from the tip of the dissection needle, move the needle tip to the wall of the sample vial and smear them onto the wall. Close the vial and place it on ice until the next MGR contents are isolated.
- To later check for possible cross contamination of the MGR content sample by compounds originating from the adjacent DG (Section 6), also collect DGs from ants, in which they are still intact (Figure 4) and put them into a separate HPLC vial.
- Always clean the Petri dish and dissection instruments with MeOH/H2O (1+1 v/v), when changing from gland to gland or from ant to ant.
- For one analytical sample, combine the reservoir contents or glands of multiple ants.
Note: The number of glands or their contents used for one analytical sample may vary depending on the experiment design. Here, either MGR contents or DGs of five ants were pooled to obtain one analytical sample.
3. Solvent-extraction of Isolated Gland Contents
- Determine the masses of the analytical samples (here, MGR contents or adjacent glands pooled from five ants).
- Add ice-cold high-purity ethyl acetate (EtOAc) in a constant ratio of 1:14 w/v and vortex the samples for 5 min under cooled conditions; here, performed at 7 °C in a thermostated laboratory.
- Centrifuge the samples for 10 min at 3,820 x g at 7 °C and transfer the supernatants (about 55–75 µL for MGR content extract obtained from five ants) into pre-cooled 1.5 mL short thread vials containing 0.1 mL micro-inserts. Tightly seal the vials with screw caps containing holes and red rubber/PTFE septa.
Note: If analysis cannot be carried out immediately, keep the extract at -80 °C until analysis, but it is recommended to analyze samples immediately after preparation to minimize the risk of chemical alterations during the freezing/thawing cycle.
4. GC-MS
- For a complete GC-MS measurement sequence, prepare the following solutions, each in a 1.5 mL short thread vial:
- Prepare an RI calibrant mixture by diluting the commercially available alkane standard solutions to a final concentration of 8 mg/L per compound using hexane.
- Prepare a solvent-blank consisting of pure EtOAc.
- Place the vials containing 1) Solvent-blank, 2) RI calibrant mixture, 3) MGR content extract, and 4) DG content extract in the cooled tray (10 °C) of the autosampler coupled to the gas chromatograph (GC).
Note: It is recommended to minimize the time-span each vial is kept in the autosampler prior to measurement. For critical samples, like the MGR content sample, the vial may be placed in the autosampler immediately before analysis. - For each sample, inject a 1 µL aliquot into the GC-MS for chromatographic separation on a column suitable for the target compounds (here: HP-5MS UI column).
- Set the appropriate GC parameters, which may look as follows:
- Use helium as carrier gas and set a constant column flow of 1 mL/min. Set an oven temperature ramp starting from 40 °C with a hold for 2 min, followed by a ramp of 10 °C/min up to 330 °C, with a hold time of 7 min. Set the inlet temperature to 270 °C.
- Choose, and if needed, adjust the split ratios for GC-MS injection that result in adequate peak shapes and intensities for compounds of interest (Figure 5).
Note: In the presented example it was necessary to measure the DG extract at a split ratio of 2:1 and the RI calibrant mixture in splitless mode. The MGR content extract was analyzed at a split ratio of 2:1 and a second time at 50:1. - Set the auxiliary temperature to 350 °C.
- Set the parameters of the mass-spectrometer (MS) as follows: MS source temperature 230 °C, MS Quad temperature 150 °C, scan range from low mass 30 to high mass 500, solvent delay 4.1 min (for solvent-blank and experimental samples) or 6.1 min (for RI calibrant mixture), respectively. Set the scan rate to approximately 3 scans/s.
Note: The MS parameters, especially the MS scan-, sampling rate, and cycle time may affect peak picking and spectrum deconvolution and must be considered when selecting parameter settings for proper data evaluation with the MetaboliteDetector software.
- Set the appropriate GC parameters, which may look as follows:
- When the measurement is completed, export the data as .AIA project file (performed here with the use of the data analysis software delivered with the GC) on a portable data storage device.
- Select File | Export data to AIA format…, then check Create new directory and click OK. Select the wanted storage location (e.g., USB flash drive) and click Open. Select the files to be exported and hit the ---> icon. Confirm with clicking Process.
5. Metabolite Detection and Identification with the Use of MetaboliteDetector Software
- Before starting the analysis of the data files, open MetaboliteDetector, choose Tools | Settings, and set the required parameters as follows (individual sheets of MetaboliteDetector are indicated in bold):
- In the sheet Appearance, set the Time scale to Min and enable the Axes Labels option.
- In the sheet Deconvolution, set the parameters for the Peak Settings to: Peak threshold: 10, and Minimum peak height (noise units): 10. Uncheck enabling of baseline adjustment. Set the parameters for Metabolite detection to: Bins/Scan: 10, Deconvolution width (scans): 5, Required intensity (% of base peak): 0, and Required number of peaks: 10.
- In the sheet Identification, set the Library Search option to: Compound Lib: ‘CalibrationLibrary_Alkanes’ and to NIST (a NIST sqlite library can be included in the .lbr format). Set the parameters as follows: Max. RI difference: 10, Cutoff score: 0.9, Pure/Impure composition: 0.5, Number of fragments: 2, Minimum number of identical frag.: 1. Use scaled lib: ticked; Similarity Score: Spec. similarity; Mass filter: m/z 207, 221, 281, 355, and 1147 (for known contaminants arising from the stationary phase of the GC-column).
- In the sheet Quantification set the parameters to: Number of quantification ions: 3, Minimal distance between subsequent ions: 5, and Minimal required quality index: 1. Exclude the quantification ions 207, 221, 281, 355, and 1147.
Note: In case of high resolution MS data, additionally set the following parameters in the sheet Centroid to: Peak threshold begin: 10, Peak threshold end: -5, and Maximal baseline distance: 30, FWHM: 0.5.
- Import the files in the .CDF format contained in the generated .AIA project file as .NetCDF into the MetaboliteDetector software by selecting File | Import | NetCDF import. Choose the folder-shaped icon, and then select the files for the sample categories to be imported and processed: 1) Solvent-blank, 2) RI calibrants, 3) MGR content extract, and 4) DG content extract. Confirm with OK to start data processing. After processing, select Close in the appearing window.
- For RI calibration and determination of the RI values for compounds contained in the MGR extract, select File | Open and choose the file containing the data of the RI calibrants.
- After the RI calibrant file is opened, select the Magnifying glass icon. Confirm the appearing window with OK.
- For proper RI calibration, check the range of detectable alkanes in the RI calibrant file.
- To this end, select the triangle appearing underneath the maximum of the first peak, originating from the first alkane (with the lowest RT, Figure 6) detectable by clicking once onto it.
- Check the hit with the highest spectrum similarity (‘Spec. sim.’, max score = 1) compared to the alkane library entries (Figure 6).
- To verify the identity of the suggested alkane compound, compare its mass spectrum to the mass spectrum given in the literature, e.g., NIST Chemistry WebBook22.
- Determine the last alkane detectable in the RI calibrant mixture by counting to the last alkane peak appearing in the chromatogram.
- For RI calibration, select Tools | RI-Calibration Wizard. Select Next.
- Click onto the folder-shaped icon and select the file containing the chromatogram of the RI calibrant mixture. Select Next.
- Select the library containing the entries for the alkane calibrants in the appeared window.
- Select the library entries of all alkanes detectable in the RI calibrant file and click the >> icon. After selecting >>, choose Next.
- Check the RTs listed for each detectable alkane in the appearing table. To this end, check the RTs depicted in the main window for each alkane by clicking onto the respective triangle (Figure 7). If necessary (Figure 8), correct the RT in the calibration table manually by double-clicking into the respective field, selecting the drop-down menu, and choosing the correct suggested RT. Alternatively, type in the RT with the help of the keyboard (Figure 9).
- When the RT for each alkane is correct, select Next. Click Next in the appearing window showing the RI calibration table.
- Select the green + symbol in the appearing Chromatogram Selection window, choose the data file of the solvent-blank and the files of the gland extracts, and select Next. Set the parameter settings in the appearing window as follows: Disabling of baseline adjustment, Peak threshold: 5, Minimal peak height: 5, Bins/Scan: 10, and Deconvolution width: 5. Hit Next and then Start to perform the RI calculation of the compounds contained in the selected sample files.
- For annotation and identification of the chosen metabolites in the MGR extract, open the data file of the measured MGR content extract, for which the RIs have been calculated as described above (step 5.3.9), by selecting File | Open and choosing the wanted data file.
- Select Tools | Settings | Deconvolution and change the Peak threshold as well as the Minimum peak height (noise units) both to 5. Select the Magnifying glass icon and confirm the appearing warning window again with OK.
- Click onto a triangle appearing underneath the maximum of a peak of interest and compare its mass spectrum with the ones stored in the NIST-library by selecting the NIST icon.
- Select the first resulting hit of the NIST-search (Figure 10).
- If the resulting spectrum similarity of the compound of interest is above the chosen spectrum similarity score (here ≥ 0.9) compared to a NIST-entry (Figure 10), look up the RI (for similar stationary phase of the GC column, film thickness, and column diameter) given for this compound in the literature (e.g., NIST Chemistry WebBook22).
- Calculate the relative difference between the NIST reference RI (or the averaged RIs when multiple RI values are given) and the experimentally derived RI. If the difference is equal or less than the user-specified maximum tolerated value (here, ≤ ±1%), designate the compound as ‘annotated’.
- Repeat steps 5.4.2–5.4.5 for all compounds of interest contained in the MGR sample file.
- For compound identification, compare the RI and mass spectra of standard solutions (e.g., 2–100 mg/L) measured under the same conditions as described in Section 4 to those of the annotated compounds.
- Analyze the standard as explained in Section 4 and process the resulting data as described for the alkane- and MGR content gland data in steps 4.4 and 5.2.
- Calibrate the data acquired from the standard by selecting Tools | RI-calibration Wizard | Next and choosing the same RI calibrant file as used before. Select Next, then again Next and select the file containing the data acquired from the standard solution by clicking the green + symbol. Hit Next and then Start to calculate the RI for the standard compound.
Note: If the analysis of the standard cannot be performed promptly after sample analysis, it is recommended to analyze RI calibrants again and to perform new RI calibration and calculation for the standard. - Open the respective file for the standard and confirm its identity by comparison of its spectrum with the NIST-library as explained in step 5.4.2.
- After confirmation of the identity of the standard, add the mass spectrum and RI of the standard compound to the in-house library. To this end, click onto the green + symbol and enter the preferred name of the library entry. Confirm with OK to add the mass spectrum and the RI of the standard compound to the library. If the new entry cannot be seen in the library, activate the refresh button.
Note: If the RI calibration was performed successfully, the RI determined by MetaboliteDetector will show up in the respective library-entry. After creating the library entry for the standard, the identification of this metabolite in the MG extract based on a combination of RI and spectra similarity is possible. - Open the MGR content data file again. Select Tools | Settings | Identification. Now, as the RI of the standard compound is calculated and added to the library entry, change the Similarity Score from Spectrum Similarity to Combined Score.
- Click onto the Magnifying glass icon and select the triangle beneath the compound that has been annotated in step 5.4.5.
- Click onto the hit and check the value given for the ‘overall similarity score’ (OSS, abbreviated by Metabolite Detector as ‘Overall simil.’), considering a combination of spectrum similarity and RI similarity score (Figure 11).
Note: If a hit was found in the in-house library, it will be displayed on the right side of the main window. - If the OSS is above the user-defined threshold (here ≥ 0.9, also indicated by the green color of the triangle), designate the compound as ‘identified’ (Figure 11).
6. Check of MGR Content Extract for Contaminations by DG Content
- Open the calibrated file of the DG sample for which the RIs of the compounds have already been calculated with MetaboliteDetector (step 5.3.9).
- For an overlay of the chromatogram obtained after measurement of the MG content sample and the DG sample, select Tools | Chromatogram overlay and choose the two respective files via the green + icon. Confirm with OK.
- To view the overlay, select the appearing Chromatogram Overlay sheet on the bottom of the window.
- Check for overlap of compounds between the MGR content extract (Figure 12) and the DG content extract and exclude overlapping compounds from further MGR content analysis.
Results
A schematic workflow listing the experimental steps to putative metabolite identification in the gland secretions of C. explodens is shown in Figure 13. Moreover, a schematic overview of the most important body parts of COCY worker ants used for the presented experiment is provided as Supplementary Figure S1 A, B. The major steps from dissection of the ants until putative metabolite identification in the MGR content are illustrated in the Supplementary Figure S2.
To isolate MGR contents suitable for volatilome analysis, a cooled state was maintained throughout transport, storage, and also during the dissection process. To this end, the ants were frozen immediately after their collection with the use of an insect aspirator (Section 1 and Figure 1) in situ. After storage for 2 days in a -20 °C freezer, the ant samples were transported on dry ice to Austria, where they were immediately put at -80 °C until further analysis. Ants suitable to be chosen for isolation of their MGR content exhibit a gaster region which is round and intact (Figure 2A) and in the best case well-stocked with MGR content, as indicated by the MGR visible between the tergites (Figure 2B). Gasters of ants which are not suitable for further analysis are shown in Figure 2C, D. The main steps (steps 2.3-2.6) involved in the isolation process of the MGR contents from COCY ants are illustrated in Figure 3. The isolated MGR contents (yellow in the case of C. explodens, but colors can range from white to red in other species belonging to the COCY group) are shown in Figure 14.
When dissecting the ants for their MGR content, care should be taken to not puncture or rupture any other glands or the intestines (step 2.5). Figure 4 shows a dissected ant gaster that still contains the two other, intact glands (DG and VG) after isolation of the MGR content. An example of visible contamination by contents of the ant intestines is shown in Figure 15. Since the cross-contamination with DG contents, located beneath the MGR, cannot be avoided completely, a part of the protocol is depicted to analyze these glands for comparison of the resulting signals with the signals from the MGR content extract (Section 6). When the dissection procedure is properly done, it is possible to obtain about 0.75-1.2 mg of MGR content per ant. For the protocol described here, MGR contents of five ants were pooled to receive repetitive samples of 3.9-5.9 mg each.
The isolated gland reservoir contents were extracted with EtOAc (Section 3) and analyzed by GC-MS (Section 4). The measurement of the MG content extract of C. explodens worker ants results in a chromatogram comprising of peaks and mass spectra for dozens of putative MGR content compounds (Figure 5). The two dominant metabolites 1-(2,4,6-trihydroxyphenyl)-ethanone (ID 4) and 5,7-dihydroxy-2-methylchromen-4-one (ID 5) in the MG content extract caused column overloading, which is why the same sample was analyzed again at a higher split ratio of 50:1 (Figure 5, inset). Possible cross-contamination of the MGR content by constituents of the DG for example, would be visible as additional peaks in the GC-MS chromatogram exhibiting late RTs, starting from about minute 29 (Figure 12). Excluding chromatographic peaks and mass spectra of compounds also found in the solvent-blank, originating from the stationary phase of the GC column, or from contents of the DG present in the ant gaster, and subsequent processing with the MetaboliteDetector software resulted in about 110 MGR content compounds with a signal to noise ratio ≥ 10. For later metabolite annotation and identification with the MetaboliteDetector software, the chromatograms were calibrated and the RI values were determined for the measured sample files (step 5.3 and sub-steps, Figure 6, Figure 7, Figure 8, Figure 9). The detected putative MGR content metabolites were annotated based on a combination of spectrum similarity to the NIST-library, which formed an integral part of the MetaboliteDetector software in the presented example (step 5.4 and sub-steps, Figure 10). Moreover, RI values found in the literature for the same or comparable stationary phase, film thickness, and diameter of the GC column were considered for compound annotation (steps 5.4.4 and 5.4.5). After setting strict matching criteria and confirmation of RIs and mass spectra by the use of standards, as explained in the protocol section for one standard compound (steps 5.4.7-5.4.15 and Figure 11), it was possible to confirm the identity of about 10% of the detected metabolites. Since a detailed report on the volatilome of the MGR content of C. explodens will be published elsewhere, the present study focused on those metabolites which have already been described in a previous publication by Jones et al.17 (species herein designated as KB02-108; see also Cook et al.23). Table 1 provides an overview of these identified compounds.
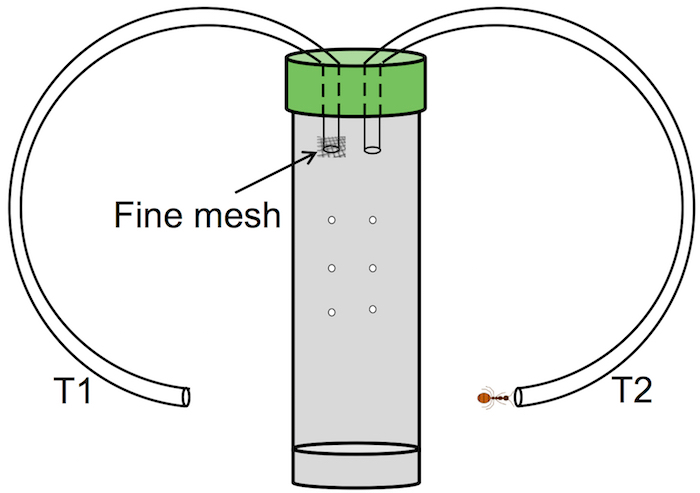
Figure 1: Schematic drawing of an insect aspirator. Into a lid that seals a vial or container, two holes are made, where two flexible tubes are put through. The opening of one tube (T1) that faces the interior of the vial is sealed with a mesh fine enough to block the insects. Additionally, holes are made into the tube to facilitate exchange of air. The end of tube T2 is pointed closely towards the insects which are sucked into the sampling vial by aspirating through T1. Please click here to view a larger version of this figure.
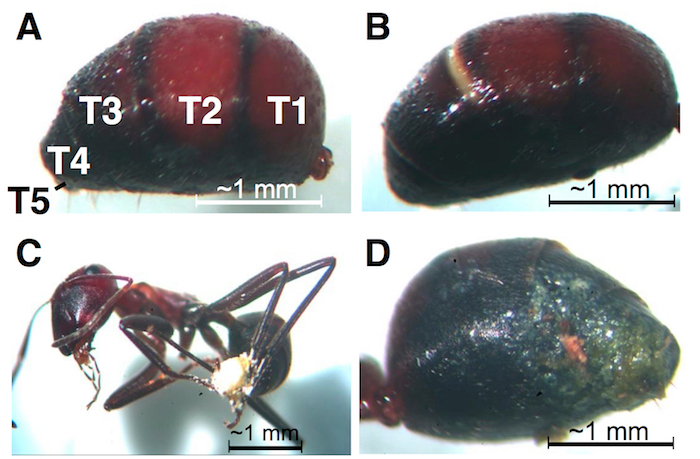
Figure 2: Intact versus broken gaster. (A) Intact gaster suitable for dissection. (B) Intact gaster almost completely filled with MGR content, also suitable for dissection. (C) and (D) broken ant gasters with ejected and hardened MGR content (yellow), possibly broken during rupture of the gaster integument during sampling. These ants are excluded from dissection, extraction, and further analysis. T: tergite. Please click here to view a larger version of this figure.
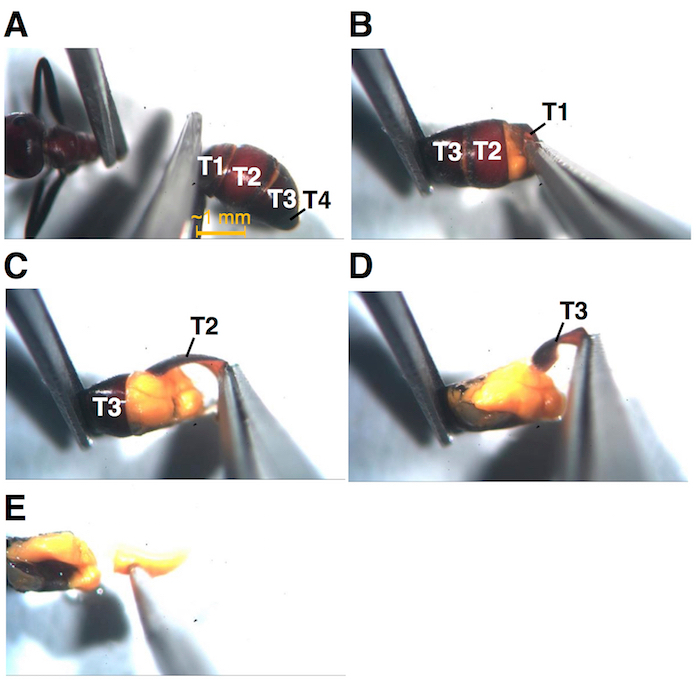
Figure 3: Major steps involved in the dissection process. (A) Separation of gaster region from rest of the ant body. (B) Peeling off the exoskeleton: tergite 1, tergite 2 (C), and tergite 3, after which the contents of the paired yellow colored MGRs are almost completely visible (D). (E) Removing the sticky MGR content by the help of a dissection needle. T: tergite. Please click here to view a larger version of this figure.
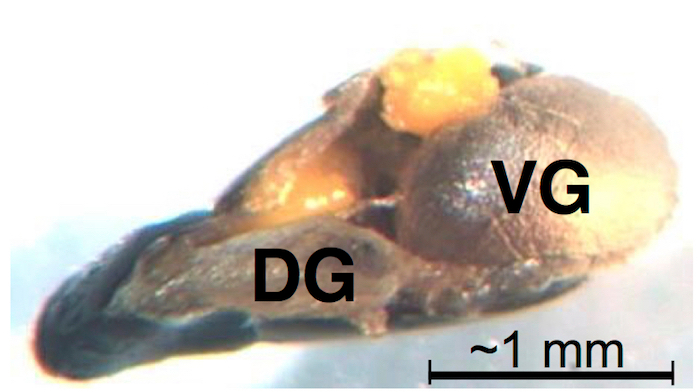
Figure 4: Ant gaster after isolation of MGR contents. The two other glands present in the gaster (VG: venom gland, and DG: Dufour's gland) can be seen. After removal of the MGR content (left-overs after isolation can be seen in yellow), both compartments should still be intact. These glands can be analyzed in the same way as the MGR contents. Please click here to view a larger version of this figure.
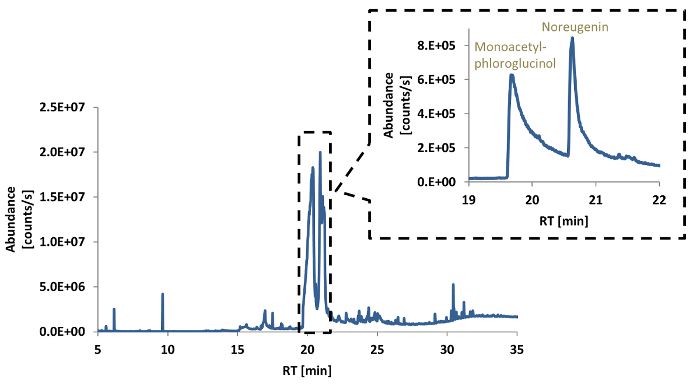
Figure 5: Representative total ion current (TIC) chromatogram of the MGR content extract. The two most abundant GC-MS peaks resulted in more symmetrically shaped chromatographic peaks, when a higher split ratio (50:1) was chosen instead of the regular 2:1 ratio (see inset). Please click here to view a larger version of this figure.
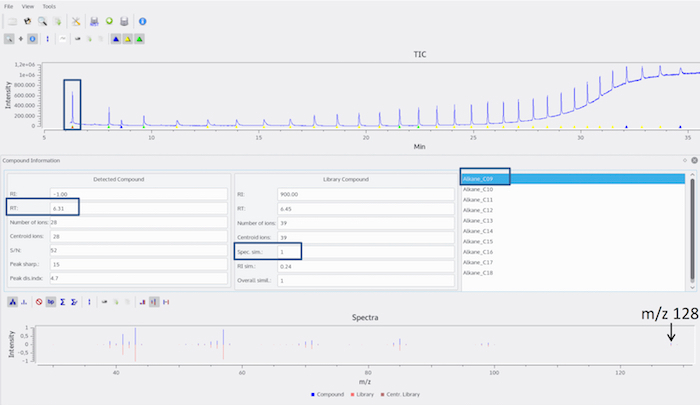
Figure 6: Determination of first detectable alkane in RI calibrant chromatogram. The triangle beneath the peak maximum of the first alkane peak is selected. The alkane elutes at 6.31 min and shows the highest spectrum similarity (here, 'Spec. sim.') to the library entry 'Alkane_C09'. To confirm the alkane identity, the mass spectrum is compared to a library (e.g., NIST Chemistry WebBook22). In the presented example, nonane is identified by its molecular ion with an m/z value of 128. Please click here to view a larger version of this figure.
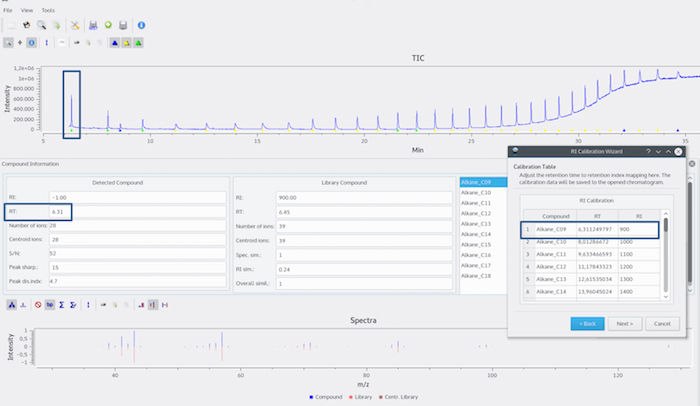
Figure 7: RI calibration with the use of an n-alkane standard mixture. The RI calibrant data file has been opened and the 'RI-Calibration-Wizard' function chosen. The correct matching of the retention time to the RI depicted in the calibration table should be checked. The RT of 6.31 min for alkane_C09 (nonane) is correctly displayed in the table. Please click here to view a larger version of this figure.
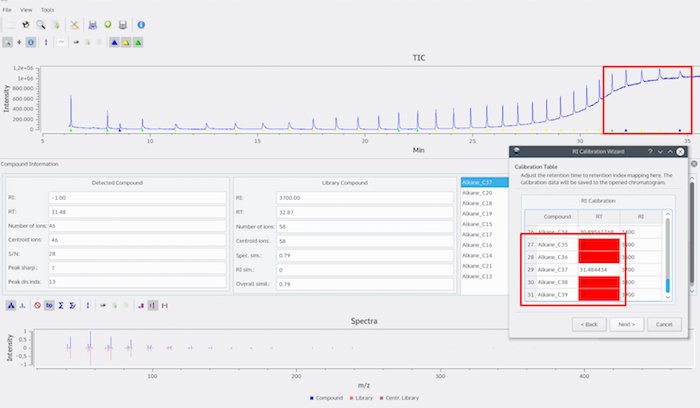
Figure 8: Wrong RTs are displayed in the calibration table. The RTs are not displayed correctly (either shown by a wrong RT value or by a missing RT value displayed as -1). Please click here to view a larger version of this figure.
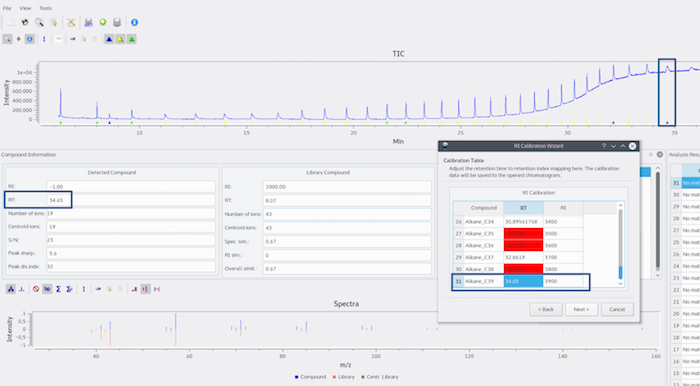
Figure 9: Manual correction of wrong RTs in calibration table. The wrong values can be manually corrected by inserting the correct RT for the respective alkane, as shown here for Alkane_C39. Please click here to view a larger version of this figure.
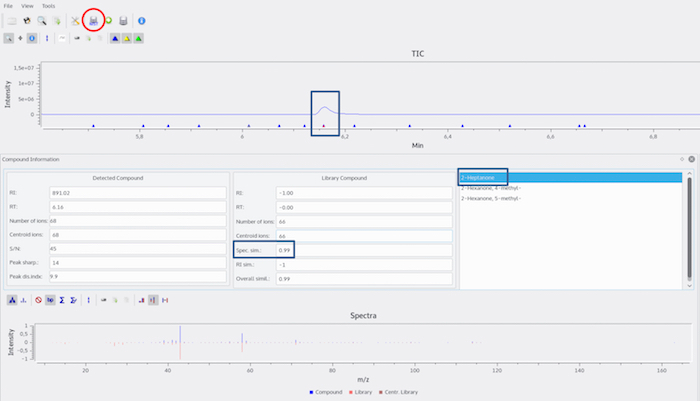
Figure 10: Comparison of mass spectrum of chosen compound to NIST-library entries. After selecting the peak maximum eluting at 6.16 min (RI 891) and activation of the 'NIST-search' function (red circle), a spectrum similarity of 0.99 for 2-heptanone is displayed. Please click here to view a larger version of this figure.
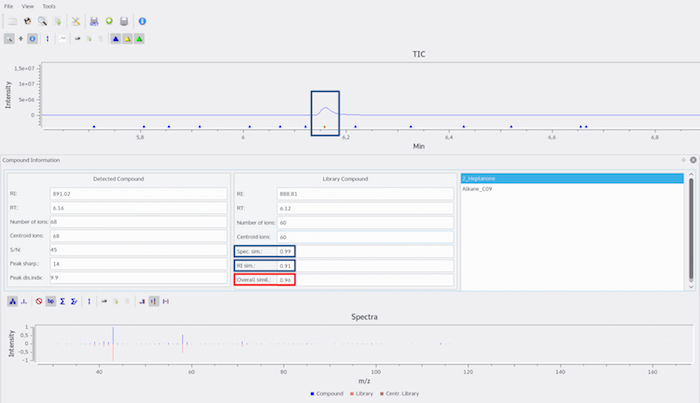
Figure 11: Metabolite identification in the MGR content extract. The mass spectrum and the RI originating from the compound eluting at RI 891 in the chromatogram of the sample are compared to the in-house library entries containing RIs and spectra of measured standard compounds. If the 'Overall Similarity Score' (OSS, abbreviated in Metabolite Detector as 'Overall simil.' implementing mass spectrum and RI) between a compound in the in-house library and a compound in the sample file is ≥ 0.9, the compound is designated as 'identified'. Here, the OSS between the in-house library entry of 2-heptanone and the compound eluting at RI 891 is 0.96, which results in the identification of 2-heptanone in the MGR content extract. Please click here to view a larger version of this figure.
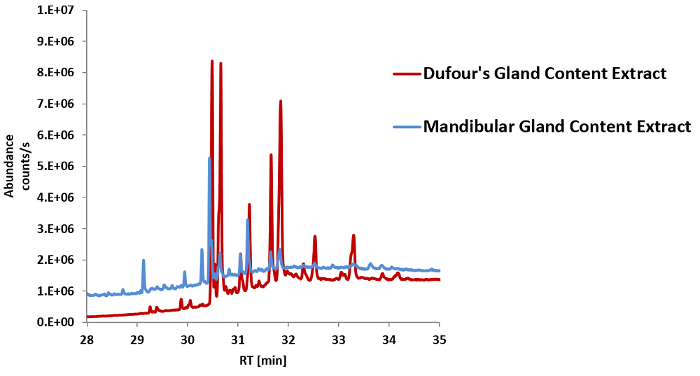
Figure 12: Overlay of TIC chromatogram sections (min 29 to min 35) of the DG content extract (red) and the MGR content extract (blue). Peak areas corresponding to overlapping (putative) compounds are higher in the DG content extract than in the MGR content extract; these compounds potentially originate from the DG and are therefore considered as (minor) contaminants in the MGR content extract. In the case of the C. explodens MGR content extract, the chromatographic peaks originating from a putative DG contamination can be found at approximately min 29, and this part of the chromatogram can be excluded from further analysis of the MGR content. Please click here to view a larger version of this figure.

Figure 13: Schematic workflow from ant samples to metabolite annotation/identification in gland reservoir content extracts after GC-MS analysis. The protocol presented here explains all experimental steps starting from isolation of the MGR contents via dissection of the ant and GC-MS analysis as well as data evaluation (indicated in black). As an alternative, the insect secretion may also be generated and collected in situ (indicated in grey). Please click here to view a larger version of this figure.
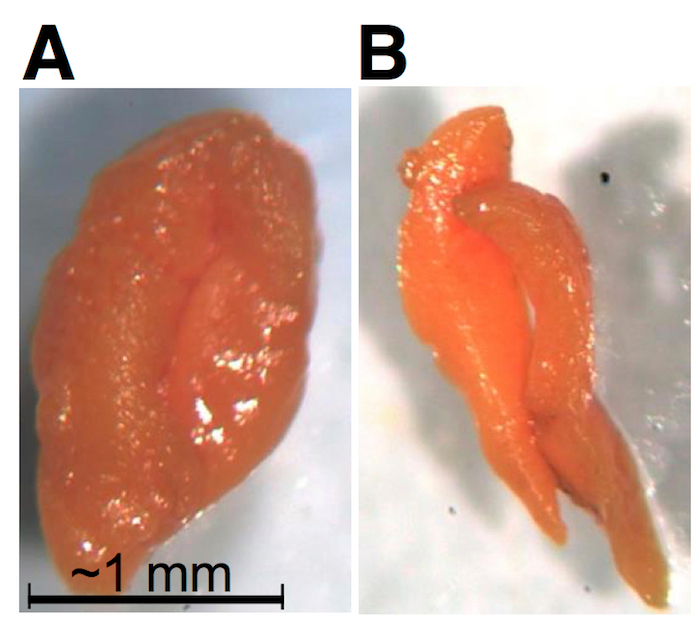
Figure 14: Isolated waxy MGR contents prior to extraction. (A) The contents of the two MGRs stick together, but (B) they can also be separated after isolation. In C. explodens, the color of the MGR content is orange-yellowish, but can range from white to red in other species of the COCY group. Please click here to view a larger version of this figure.
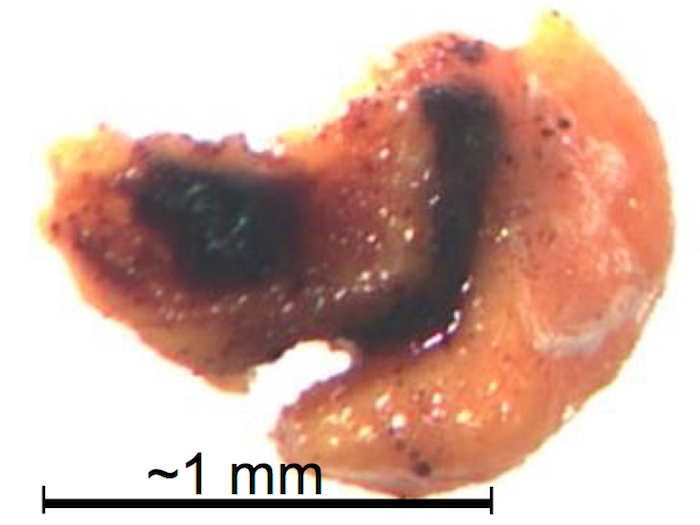
Figure 15: Illustration of an isolated MGR secretion cross-contaminated by constituents of the insect's intestines (brown). These types of MGR isolates are excluded from extraction and further analysis. Please click here to view a larger version of this figure.
| ID | Metabolite | Trivial Name | InCHI string | Sum Formula | ||||||
| 1 | Heptan-2-one | InChI=1S/C7H14O/c1-3-4-5-6-7(2)8/h3-6H2,1-2H3 | C7H14O | |||||||
| 2 | n-Undecane | InChI=1S/C11H24/c1-3-5-7-9-11-10-8-6-4-2/h3-11H2,1-2H3 | C11H24 | |||||||
| 3 | n-Heptadecane | InChI=1S/C17H36/c1-3-5-7-9-11-13-15-17-16-14-12-10-8-6-4-2/h3-17H2,1-2H3 | C17H36 | |||||||
| 4 | 1-(2,4,6-Trihydroxyphenyl)-ethanone | Monoacetylphloroglucinol | InChI=1S/C8H8O4/c1-4(9)8-6(11)2-5(10)3-7(8)12/h2-3,10-12H,1H3 | C8H8O4 | ||||||
| 5 | 5,7-Dihydroxy-2-methylchromen-4-one | Noreugenin | InChI=1S/C10H8O4/c1-5-2-7(12)10-8(13)3-6(11)4-9(10)14-5/h2-4,11,13H,1H3 | C10H8O4 | ||||||
Table 1: Metabolites identified in the EtOAc extract of the MGR contents isolated from C. explodens minor worker ants. Selected metabolites are presented.
Supplementary Figure S1. Overview of the most important body parts belonging to COCY ants (minor workers) presented in this manuscript. (A) The MGRs are shown in yellow. Their gastral portion is used for volatilome analysis. (B) The gastral portion of the MGRs is located beneath tergites 1 to 3. T: tergite. Please click here to download this file.
Supplementary Figure S2. Schematic overview of the presented experiment. The major steps from dissection of the ant until putative identification of metabolites present in the MGR content are illustrated. Please click here to download this file.
Discussion
In this manuscript, we present a complete protocol for analyzing the volatilome of the content found in the hypertrophied MGRs of C. explodens minor worker ants. Since the ants used here may 'explode' and eject their MGR contents in an uncontrolled manner when touched with forceps, it is recommended to use a 'soft' collection technique as provided by an insect aspirator (Figure 1). For some ant species including COCY ants, it may be necessary to limit the maximum number of ants to five individuals per 50 mL vial, since otherwise self-poisoning of the ants (e.g., by accumulation of formic acid in the headspace) may occur. For freezing the ants in the field, a cool bag stuffed with deep-frozen cold packs may be used. The samples should be rapidly frozen and stored under cooled conditions (e.g., -20 °C, best at -80 °C), but it is not recommended to kill and store the ants in liquid nitrogen, since increased damage of their glands has been observed with this method.
The presented buffer- and solvent-free dissection methodology is suitable for obtaining the wax-like mandibular gland reservoir contents as well as other glands present in frozen worker ants. For volatilome analysis of the MGR content of C. explodens, major aspects to be considered during dissection are continuous cooling of the ant (step 2.1.4) and minimizing cross-contaminations of the MG samples with other gland contents/fluids present in the ant gaster (step 2.5, Figure 4, and Figure 15). A considerable fraction of the frozen ants may be damaged, either because the ants 'exploded' during sampling or were damaged during transport on dry ice from the sampling site to the laboratory. If the gaster region is broken, these ants are not suitable for further analysis (Figure 2C, D). If only antennae and legs are missing or broken, these ants may still be used for extraction of the MGR contents and further analysis. Since the MGR contents of cooled C. explodens ants have a wax-like consistency it is straight-forward to isolate them with the use of dissection needles (step 2.5, Figure 3E, and Figure 14). Additional care needs to be taken while handling the sticky MGR content. It may stick to anything coming into physical contact with it and will also often adhere to the dissection forceps, which increases the risk of contamination of other samples. It is necessary to only touch the MGR content with the dissection needle and immediately transfer it into the glass vials used for extraction (steps 2.5 and 2.6). Moreover, it is recommended to clean the dissection equipment with a MeOH/H2O mixture when switching between ants or gland-types (step 2.8).
Gland contents of other ant species may be present in a liquid state even during cooling with cold packs. In this case, the whole gland including the membrane may first be isolated and punctured afterwards to obtain the content. Liquid secretions may also be obtained with the help of fine capillary pipettes. With an average body length of about 4-5 mm (without antennae), workers of C. explodens belong to the smaller species of the COCY group. Their often swollen gaster comprises about 2-2.5 mm in length and 1-1.5 mm in width. Workers of the so-far largest known species of the COCY group can reach a size of about 8 mm in body length with a gaster size of about 3 mm in length and 2.5 mm in width. Since the protocol is well suited to dissect and investigate individual ants and gasters of that size of different COCY species, the here used dissection instruments and microscope may have to be adapted to be applicable for smaller ants or smaller organs. Moreover, the number of ants per analytical sample may have to be increased as well.
While dissecting the ant for the MGR content, it is critical not to damage any other glands or the intestines - the contents of which may cross-contaminate the sample (step 2.5, Figure 4 and Figure 15). In the optimum case, after the extraction of the MGR contents, the DG, as well as the VG are visibly kept intact (Figure 4). Contaminations with the contents of the DG, which is located beneath the MGRs, are difficult to avoid completely. Reasons for this may also include the partial disruption of the gland integrity during transport on dry ice from the sampling-site to the laboratory. It is also possible that the DGs become damaged during sampling or in the process of exploding, as we have noticed for the MGR in a number of investigated ants. Since the DG contents can be analyzed the same way as the MGR contents (Sections 3 and 4), the results can be compared to the resulting data after analysis of the MGR content samples (Section 6). In the case of MGR content extracts obtained from C. explodens ants, the compounds also contained in the DG begin to elute late in the chromatogram (Figure 12). To prevent mistaking DG compounds for MGR constituents, the respective metabolites can be excluded from further analysis. From studies on other ant species it is known that DGs can also contain (highly) volatile compounds1,24, which typically elute early in the GC-chromatogram.
In previous studies dealing with the chemical composition of the MGR contents of COCY ants, whole ants or their whole gasters were analyzed16,17,18,23, whereas here the MGR contents themselves were obtained via dissection of the ants.
Analyzing dissected MGR contents allows investigators to perform a broad range of biochemical studies, including identification of metabolites contained therein. Since the performed study here focused on the identification of the volatile constituents contained in the MGR of C. explodens, GC-MS was chosen for its analysis (Section 4). For this, the extracts should ideally be measured immediately after preparation or stored at -80 °C until analysis. It should be noted that (extended) storage may cause chemical alterations of the extracts (see Notes after steps 3.3 and 4.2). Since the concentration of the MGR contents may cover a range of several orders of magnitude, it may be necessary to analyze the MGR extracts at different GC split ratios. Since the two main compounds in the MGR content extract of the ants taken to exemplify the protocol caused column overloading when a split ratio of 2:1 was used, this sample was analyzed a second time at a higher split ratio of 50:1 (step 4.3.1.2and Figure 5). The GC-MS parameter settings presented in Section 4 are suitable for data generated with the GC-MS devices specified in the Table of Materials. Next to the RI calibrants (step 4.1.1), a solvent-blank (step 4.1.2) should also be analyzed to recognize non-biological artifacts and contaminants during subsequent data analysis. For metabolite identification, it is also important to measure authentic standards of annotated compounds under the same GC-MS conditions as used for analyzing the sample extracts (steps 5.4.7and following). To improve the accuracy and reliability of the final data, it is recommended to analyze all sample categories (solvent-blank, RI calibrants, sample extracts, and standards) within the same measurement sequence. Moreover, the authentic standards should be analyzed at a concentration comparable to that observed for the sample extracts. This helps to enhance the accuracy of RI values and similarity between sample and standard mass spectra, which will finally lead to increased and more meaningful metabolite annotation/identification. To this end, the standards can be repeatedly measured using different split factors.
For metabolite identification, the sophisticated software, MetaboliteDetector is used for spectra deconvolution and RI and spectra comparison to an implemented NIST-library as well as to an established in-house library (Section 5). It is recommended to run MetaboliteDetector on a 64 bit LINUX-based operating system (e.g., KUBUNTU) and to copy the generated *.CDF data files (step 4.4) from the portable data storage device onto the local hard drive. MetaboliteDetector is capable of importing raw GC-MS data in centroid or profile netCDF format. The software of most GC-MS instruments should be able to convert the recorded raw data into this format19. Before starting the data analysis, it is highly recommended to read the literature available for previous MetaboliteDetector software versions to become familiar with the features and the graphical user interface19,25,26.
For RI calibration and subsequent RI value calculation of the compound peaks present in the sample extracts, a library containing RIs and spectra of RI calibrants (here, n-alkanes) is used. Such a library can either be self-established, or a preexisting one ('CalibrationLibrary_Alkanes') can be downloaded27. The provided default calibrant library contains RIs and spectra for n-alkanes ranging from C09 to C39 which have been analyzed as described in Section 4. The provided library enables users working with Metabolite Detector to directly start with the calibration process of their data. If needed, this library can also be extended with additional entries for further alkanes. Based on the similarity of reference and experimentally derived RIs and mass spectra (see step 5.3 and sub-steps, Figure 7, Figure 8, Figure 9), annotation or identification of the compounds can be performed (step 5.4 and sub-steps, Figure 11). It is also crucial that after automated data processing with MetaboliteDetector, the user will manually check for correct peak picking and spectrum deconvolution by inspecting mass spectra underlying the 'triangle' for each putative compound of interest. Moreover, depending on the GC-MS instrumentation and the parameter settings used for data generation, adaptions of the presented MetaboliteDetector settings may be necessary. The MetaboliteDetector software is capable of performing many more useful operations than explained in this manuscript, e.g., display of extracted ion current (EIC) chromatograms, export of chromatograms as .csv, automatic batch-quantification of compounds, and many more.
The protocol presented in this manuscript can serve as suggestion for experiments performed by other researchers focusing on isolation of glands or gland contents from insects, volatilome analysis, as well as metabolite identification.
Disclosures
The authors have nothing to disclose.
Acknowledgements
Funding for this study was obtained through the Vienna Science and Technology Fund (WWTF) LS13-048 to ISD. Special thanks go to Diane W. Davidson (University of Utah; now retired) for sharing her knowledge about the Bornean COCY ants with us. We appreciate administrations of the Kuala Belalong Field Studies Center (KBFSC) and Universiti Brunei Darussalam (UBD) for project approval as well as Brunei's Forestry Department and Brunei's Research and Innovation Centre for permission to collect ants and approval and issuance of export permits. Special thanks go to UBD and KBFSC staff, especially Muhammad Salleh bin Abdullah Bat, Teddy Chua Wee Li, Masnah Mirasan, Rafhiah Kahar, Roshanizah Rosli, Rodzay Wahab, Chan Chin Mei, and Kushan Tennakoon for facilitating our research.
Materials
| Name | Company | Catalog Number | Comments |
|---|---|---|---|
| Tube 50 ml, 115 x 28 mm, flat/conical base PP | Sarstedt | 62,559,001 | see Figure 1 in manuscript |
| PVC Tubings | Rehau | 290 4489 | see Figure 1 in manuscript |
| Mesh, stainless steel, 0.63 mm mesh size | Antstore | 1000378 | see Figure 1 in manuscript |
| Freezer | Severin | KS 9890 | -20 °C or lower |
| polystyrene foam box, inner dimensions 155 mm x 100 mm x 45 mm | Thorsten Koch | 4260308590481 | |
| Petri dish, glass, 100 mm x 15 mm | Aldrich | BR455742 | |
| Cold pack 150 mm x 100 mm | Elite Bags | 1998 | freeze to -20 °C |
| Bucket with crushed ice | |||
| 1.5 mL Short Thread Vials, 32 x 11.6 mm, clear glass, 1st hydrolytic class, wide opening | La-Pha-Pack | 11090500 | |
| Screw caps for 1.5 mL Short Thread Vials, closed, Silicon white/PTFE red septum, 55° shore A, 1.0 mm | La-Pha-Pack | 9151799 | |
| Stereomicroscope | Bresser | 5806100 | |
| Forceps, Superfine Tip curved | Medizinische Instrumente May, Norman May | PI-0005B | |
| Forceps, Superfine Tip straight | blueINOX | BL-3408 | |
| Dissection needle 140 mm, pointed, straight | Heinz Herenz Medizinalbedarf GmbH | 1110301 | |
| Methanol, LC-MS CHROMASOLV, Honeywell Riedel-de Haën | fisher scientific | 15654740 | |
| Distilled water | |||
| Rotizell-Tissue-Tücher | Carl Roth GmbH + Co.KG | 0087.2 | |
| Acetic acid ethyl ester ROTISOLV ≥99,8 % | Carl Roth GmbH + Co.KG | 4442.1 | freeze to -20 °C |
| Vortex Genie 2 | neoLab | 7-0092 | |
| 0.1 mL micro-inserts for 1.5 mL Short Thread Vials, 31 x 6 mm, clear glass, 1st hydrolytic class, 15 mm tip | La-Pha-Pack | 06090357 | |
| Screw caps for 1.5 mL Short Thread Vials, with hole, RedRubber/PTFE septum, 45° shore A, 1.0 mm | La-Pha-Pack | 9151819 | |
| Alkane standard solution C8-C20 | Sigma-Aldrich | 04070 | |
| Alkane standard solution C21-C40 | Sigma-Aldrich | 04071 | |
| n-Hexane SupraSolv | Merck | 104371 | |
| GC-autosampler, e.g. MPS2XL-Twister | Gerstel | ||
| Agilent Gas chromatograph 6890 N | Agilent | ||
| Gooseneck splitless Liner | Restek | 22406 | |
| Helium (5.0 - F50) | Messer | 102532501 | |
| GC capillary column HP-5MS UI 30 m × 0.25 mm ×0.25 µm | Agilent | 19091S-433UI | |
| Agilent Mass Selective Detector 5975B | Agilent | ||
| MSD ChemStation Data Analysis Application software | Agilent | ||
| MetaboliteDetector software (3.1.Lisa20170127Ra-Linux) | Hiller K | download from: http://metabolitedetector.tu-bs.de/node/10 | |
| Calibration Library for MetaboliteDetector | Hiller K | download from: http://metabolitedetector.tu-bs.de/node/10 | |
| MD Conversion Tool for NIST-library | Hiller K | download from: http://metabolitedetector.tu-bs.de/node/10 |
References
- Morgan, E. D. Chemical sorcery for sociality: exocrine secretions of ants (Hymenoptera: Formicidae). Myrmecol News. 11, 79-90 (2008).
- Betz, O. Biological adhesive systems. , Springer. 111-152 (2010).
- Laciny, A., Zettel, H., Druzhinina, I. Workers, soldiers, and gynes-morphometric characterization and description of the female castes of Camponotus singularis (Smith, 1858)(Hymenoptera, Formicidae). Deutsche Entomologische Zeitschrift. 63, 183(2016).
- Ward, P. S., Blaimer, B. B., Fisher, B. L. A revised phylogenetic classification of the ant subfamily Formicinae (Hymenoptera: Formicidae), with resurrection of the genera Colobopsis and Dinomyrmex. Zootaxa. 4072 (3), 343-357 (2016).
- Davidson, D. W., Salim, K. A., Billen, J. Histology of structures used in territorial combat by Borneo's 'exploding ants'. Acta Zoologica. 93 (4), 487-491 (2012).
- Davidson, D., et al. An experimental study of microbial nest associates of Borneo's exploding ants (Camponotus [Colobopsis] species). Journal of Hymenoptera Research. 18 (2), 341-360 (2009).
- Laciny, A., et al. Colobopsis explodens sp.n., model species for studies on "exploding ants" (Hymenoptera, Formicidae), with biological notes and first illustrations of males of the Colobopsis cylindrica group. ZooKeys. , (2018).
- Maschwitz, U., Maschwitz, E. Platzende Arbeiterinnen: eine neue Art der Feindabwehr bei sozialen Hautflüglern. Oecologia. 14 (3), 289-294 (1974).
- Davidson, D. W., Lessard, J. P., Bernau, C. R., Cook, S. C. The tropical ant mosaic in a primary Bornean rain forest. Biotropica. 39 (4), 468-475 (2007).
- Martin, S., Drijfhout, F. A review of ant cuticular hydrocarbons. Journal of chemical ecology. 35 (10), 1151(2009).
- Pickett, J. Chromatography and isolation of insect hormones and pheromones. , Springer. 299-309 (1990).
- Tragust, S., et al. Ants disinfect fungus-exposed brood by oral uptake and spread of their poison. Current Biology. 23 (1), 76-82 (2013).
- Menzel, F., Blüthgen, N., Schmitt, T. Tropical parabiotic ants: highly unusual cuticular substances and low interspecific discrimination. Frontiers in Zoology. 5 (1), 16(2008).
- Hogan, C. T., Jones, T. H., Zhukova, M., Sosa-Calvo, J., Adams, R. M. Novel mandibular gland volatiles from Apterostigma ants. Biochemical Systematics and Ecology. 72, 56-62 (2017).
- Augusto, F., Valente, A. L. P. Applications of solid-phase microextraction to chemical analysis of live biological samples. TrAC Trends in Analytical Chemistry. 21 (6), 428-438 (2002).
- Davidson, D. W., et al. Nutrition of Borneo's 'exploding' ants (Hymenoptera: Formicidae: Colobopsis): a preliminary assessment. Biotropica. 48 (4), 518-527 (2016).
- Jones, T., et al. The chemistry of exploding ants, Camponotus spp.(cylindricus complex). Journal of chemical ecology. 30 (8), 1479-1492 (2004).
- Voegtle, H. L., Jones, T. H., Davidson, D. W., Snelling, R. R. E-2-ethylhexenal, E-2-ethyl-2-hexenol, mellein, and 4-hydroxymellein in Camponotus species from Brunei. Journal of chemical ecology. 34 (2), 215-219 (2008).
- Hiller, K., et al. MetaboliteDetector: comprehensive analysis tool for targeted and nontargeted GC/MS based metabolome analysis. Analytical chemistry. 81 (9), 3429-3439 (2009).
- Sumner, L. W., et al. Proposed minimum reporting standards for chemical analysis. Metabolomics. 3 (3), 211-221 (2007).
- Stein, S. Retention indices by NIST mass Spec data Center. NIST Chemistry Webbook, NIST Standard Reference Base. (69), (2010).
- NIST Chemistry WebBook. NIST Standard Reference Database Number 69. , Available from: http://webbook.nist.gov/chemistry/ (2018).
- Cook, S. C., Davidson, D. W. Nutritional and functional biology of exudate-feeding ants. Entomologia Experimentalis et Applicata. 118 (1), 1-10 (2006).
- Abdalla, F. C., Cruz-Landim, C. d Dufour glands in the hymenopterans (Apidae, Formicidae, Vespidae): a review. Revista Brasileira de Biologia. 61 (1), 95-106 (2001).
- Hiller, K. MetaboliteDetector. Documentation. , Available from: http://metabolitedetector.tu-bs.de/wiki/index.php/Documentation (2010).
- Nieke, C. MetaboliteDetector - Development Version. , Available from: http://md.tu-bs.de/system/files/Downloads/MD-Development-Version-Documentation.pdf (2012).
- Hiller, K., Koschnitzki, N. MetaboliteDetector. Download. , Available from: http://metabolitedetector.tu-bs.de/node/10 (2017).
Reprints and Permissions
