Here we present a new approach to identify plant viruses with double-strand DNA genomes. We use standard methods to extract DNA and RNA from infected leaves and carry out next-generation sequencing. Bioinformatic tools assemble sequences into contigs, identify contigs representing virus genomes and assign genomes to taxonomic groups.
Method Article
Combining Analysis of DNA in a Crude Virion Extraction with the Analysis of RNA from Infected Leaves to Discover New Virus Genomes
In This Article
Summary
Abstract
This metagenome approach is used to identify plant viruses with circular DNA genomes and their transcripts. Often plant DNA viruses that occur in low titers in their host or cannot be mechanically inoculated to another host are difficult to propagate to achieve a greater titer of infectious material. Infected leaves are ground in a mild buffer with optimal pH and ionic composition recommended for purifying most bacilliform Para retroviruses. Urea is used to break up inclusion bodies that trap virions and to dissolve cellular components. Differential centrifugation provides further separation of virions from plant contaminants. Then proteinase K treatment removes the capsids. Then the viral DNA is concentrated and used for next-generation sequencing (NGS). The NGS data are used to assemble contigs which are submitted to NCBI-BLASTn to identify a subset of virus sequences in the generated dataset. In a parallel pipeline, RNA is isolated from infected leaves using a standard column-based RNA extraction method. Then ribosome depletion is carried out to enrich for a subset of mRNA and virus transcripts. Assembled sequences derived from RNA sequencing (RNA-seq) were submitted to NCBI-BLASTn to identify a subset of virus sequences in this dataset. In our study, we identified two related full-length badnavirus genomes in the two datasets. This method is preferred to another common approach which extracts the aggregate population of small RNA sequences to reconstitute plant virus genomic sequences. This latter metagenomic pipeline recovers virus related sequences that are retro-transcribing elements inserted into the plant genome. This is coupled to biochemical or molecular assays to further discern the actively infectious agents. The approach documented in this study, recovers sequences representative of replicating viruses that likely indicate active virus infection.
Introduction
Emerging plant diseases drive researchers to develop new tools to identify the correct causal agent(s). Initial reports of new or recurring virus diseases are based on commonly occurring symptoms such as mosaic and malformations of the leaf, vein clearing, dwarfism, wilting, lesions, necrosis, or other symptoms. The standard for reporting a new virus as the causal agent for a disease is to separate it from other contaminating pathogens, propagate it in suitable host, and reproduce the disease by inoculating into healthy plants of the original host species. The limitation in this approach is that many genera of plant viruses depend upon an insect or other vectors for transmission to a suitable host or back to the original host species. In this case, the search for the appropriate vector can be prolonged, there may be difficulties to establish laboratory colonies of the vector, and further efforts are necessary to devise a protocol for experimental transmission. If the conditions for successful laboratory transmission studies cannot be achieved, then the work falls short of the standard for reporting a new virus disease. For viruses that occur in their natural hosts at very low titers, researchers must identify alternative hosts for propagation to maintain sufficient infectious stocks for carrying out research. For virus species that infect only a few plants this can also be an obstacle for growing stock cultures1.
In recent years, scientists are more often employing high-throughput NGS and metagenomic approaches to uncover virus sequences that are present in the environment, which may exist unrelated to a known disease, but can be assigned to taxonomic species and genera2,3,4. Such approaches to the discovery and categorization of genetic materials in a distinct environment provide a way to describe virus diversity in nature or their presence in a certain ecosystem but does not necessarily confirm to a framework for defining causal agents for an apparent disease.
The Badnavirus genus belongs to the family Caulimoviridae of pararetroviruses. These viruses are bacilliform in shape with circular double strand DNA genomes of approximately 7 to 9 kb. All pararetroviruses replicate through an RNA intermediate. Pararetroviruses exist as episomes and replicate independent of the plant chromosomal DNA5,6. Field studies of virus populations indicate that these virus populations are genetically complex. In addition, information obtained across a range of plant genomes by high throughput sequencing have uncovered numerous examples of badnavirus genome fragments inserted by illegitimate integration events into plant genomes. These endogenous badnavirus sequences are not necessarily associated with infection7,8,9,10,11. Subsequently, the use of NGS to identify new badnaviruses as the causal agent of disease is complicated by the subpopulation diversity of episomal genomes as well as the occurrence of endogenous sequences12,13.
While there is not one optimal pipeline for the discovery of novel pararetrovirus genomes, there are two common approaches to identify these viruses as causal agents for disease. One method is to enrich for small RNA sequences from infected leaves and then assemble these sequences to reconstitute the virus genome(s)14,15,16,17. Another approach is the rolling circle amplification (RCA) to amplify circular DNA virus genomes18. The success of RCA depends upon the age of the leaf and the virus titer in the selected tissue. The RCA products are subjected to restriction digestion and cloned into plasmids for direct sequencing19,20,21.
Canna yellow mottle virus (CaYMV) is a badnavirus and is described as the etiological cause of yellow mottle disease in canna, although only a 565 bp fragment of the genome has been previously isolated from infected cannas22. A contemporary study identified CaYMV in Alpinia purpurata (flowering ginger; CaYMV-Ap)23. The goal of this study was to recover complete badnavirus genome sequences from infected canna lilies. We describe a protocol for purifying virus from plant contaminants, and then isolating viral DNA from this preparation, and prepare a DNA library for use in NGS. This approach eliminates the need for intermediate molecular amplification steps. We also isolate mRNA from infected plants for RNA-seq. NGS, which includes RNA-seq was carried out using each nucleic acid preparation. Assembled contigs were found to relate to the Badnavirus taxon in both datasets using the National Center for Biotechnology and Information (NCBI) basic local alignment search tool for nucleic acids (BLASTn). We identified the genomes of two badnavirus species24.
Protocol
1. General Virus Purification by Differential Centrifugation Using Standard Method by Covey et al. 25
- First, cut 80-100 g of leaves from diseased plants and grind in a waring blender at 4 °C using 200 mL grinding buffer (0.5 M NaH2PO4, 0.5 M Na2HPO4 (pH 7.2). and 0.5% (w/v) Na2SO3). Wear a laboratory coat and gloves for all steps of this procedure.
- Then, transfer the homogenate (300 mL) to a 1.0 L beaker. Add 18 g of urea and 25 mL of 10% nonionic detergent (t-Oct-C6H4-(OCH2CH2)9OH) to the homogenate inside a chemical hood.
NOTE: For this step it is best to wear safety goggles and a simple breathing mask for personal protection. - Stir with a magnetic stirrer briefly in the hood and cover the beaker with the foil. Then transfer the foil covered beaker to a cold room and stir with a magnetic stirrer overnight at 4 °C.
- Transfer the homogenate to centrifuge rotor bottles (250 mL containers) and centrifuge in a fixed angle rotor at 4,000 x g for 10 min at 4 °C. In a chemical fume hood, recover the supernatant and filter through 4 layers of cheesecloth.
- Divide the homogenate among 38.5 mL polypropylene centrifuge tubes and centrifuge for 2.5 h at 40,000 x g at 4 °C. Typically, check for the presence of a green pellet at the bottom of the tube and a white pellet along the length of the tube. Pour off the supernatant and retain both pellets; place samples on ice.
NOTE: The green pellet contains chloroplasts, starch, and other organelles. - Working in a chemical hood, use a rubber policeman to separate the pellets. Resuspend the white pellet in each rotor bottle in 1 mL of ddH2O over the course of 1-2 h while maintaining the suspensions overnight at 4 °C to allow the materials to fully dissolve into solution. Centrifuge the suspension at 6,000 x g and at 4 °C for 10 min to remove the remaining debris.
- Centrifuge the concentrated suspension at 136,000 x g for 2 h at 4 °C to pellet virions. Resuspend the pellets in 1 mL of buffer (50 mM Tris-HCl, pH 7.5, 5 mM MgCl2).
NOTE: An optional step is to treat virions with DNAse I (10 µg/mL) for 10 min at 37 °C to remove non-encapsidated DNA, i.e., contaminating chloroplast and mitochondrial DNA. Then, inactivate the DNAse I by adding EDTA to 1 mM. - Disrupt virions with 40 µL of 2 µg/µL proteinase K at 37 °C for 15 min.
- Work inside a chemical hood to recover virion DNA by organic extraction. Wear a face shield, gloves, and a laboratory coat during the extraction for protection against potential acute health effects. Add 1 volume of phenol-chloroform-isoamyl alcohol (49:50:1) to the sample and shake by hand for 20 s. Centrifuge at room temperature for 5 min at 16,000 x g. Remove the upper aqueous phase and transfer to a new tube. Repeat this extraction two or more times. Dispose of the organic phase by placing it in a glass waste bottle for proper institutional chemical disposal26.
- Concentrate the DNA using ethanol precipitation. Use 0.3 M final concentration of sodium acetate (pH 5.2) and 2.5 volumes of 95% ethanol. Place samples at -20 °C for 30-60 min and centrifuge at 13,000 x g for 10-20 min to pellet the DNA26.
- Working at a laboratory bench, resuspend the DNA pellet in 1 mL of 0.1 mM TE buffer (pH 8.0). Filer the suspension through a commercial gel filtration column (normally used for polymerase chain reaction (PCR) clean up) to eliminate salts and low molecular weight material that might impede NGS.
- Analyze the samples by 1% agarose gel electrophoresis using ethidium bromide staining to view the quality of the preparations. Assess the quality of DNA using a nanodrop spectrophotometer.
NOTE: A ratio of sample absorbance at 260 λ and 280 λ between 1.85 and 2.0 typically indicates that the preparation is "clean" of impurities and is of the desired quality. - Analyze the quality of DNA (use 5 pg to 10 ng) using a chip based capillary electrophoresis instrument.
NOTE: Quality output shows clean peaks, representing DNA fragments distributed by size along an X-axis. Peak height indicates abundance of the fragment. Jagged peaks indicate partially degraded fragments or chemical contaminants. Round curves represent a smear of DNA indicating poor quality
2. Library Preparation Using DNA and Emulsion-based Clonal Amplification (emPCR Amplification)
Note: The library is typically prepared by a NGS facility which carries out customer-oriented work.
- Shear a solution of DNA (> 200 ng) using a nebulizer which converts the DNA to fragments. Ligate the commercial adapters according to the manual's instructions27.
- Carry out emPCR amplification of the DNA sample according to the manufacturer's instructions28,29,30. Repeat the wash step three times, and after each wash, pellet the beads in a minicentrifuge for 10 s. Discard the supernatant after each wash.
NOTE: The procedure begins with preparation of the capture beads by washing in the commercial wash buffer provided with the kit. emPCR is commonly used for template amplification for NGS. - Heat denature the DNA or RNA at 95 °C for 2 min and then 4 °C until ready to use. Use 200-million molecules of DNA/RNA to 5 million capture beads in a final volume of 30 µL. Prepare a mock sample alongside the DNA/RNA sample and carry out the following steps with the nucleic acid sample as well as the mock sample.
- Perform emulsification by vortexing the tube of emulsion oil for 10 s at maximum speed, then pour the entire content (4 mL) into a plastic stirring tube that is compatible with a platform homogenizer. Place the stirring tube on the platform to mix the emulsion at 2,000 rpm for 5 min.
- Dispense 100 µL aliquots of emulsion into 8-strip cap tubes or into a 96-well plate. Cap the tubes or seal the plate and carry out emPCR using the manufacturer's recommended program28.
NOTE: After the PCR is complete, check the wells to see if the emulsion is intact and then proceed. Discard the entire well if the emulsion is broken. - Wear a lab coat and work in a chemical hood to collect the amplified DNA beads (ADB). Vacuum aspirate the emulsion from the wells and collect the beads in a 50 mL tube. Rinse the wells twice with 100 µL of isopropanol and aspirate the rinse to the same 50 mL tube.
- Vortex the collected emulsions and resuspend the ADB with isopropanol to a final volume of 35 mL. Pellet the ADB at 930 x g for 5 min. Remove the supernatant and add 10 mL of enhancing buffer. Vortex the ADB and then wash by adding isopropanol to 40 mL final volume Centrifuge and discard the supernatant after each wash and repeat the wash step twice.
- Carry out a final wash using ethanol in place of isopropanol. Add enhancing buffer to 35 mL final volume, vortex, and pellet the beads at 930 x g for 5 min. Remove the supernatant but leave 2 mL of enhancing buffer.
- Transfer the suspension to a microcentrifuge tube and briefly centrifuge to pellet the ADB. After discarding the supernatant, rinse the ADB pellet twice with 1 mL of enhancing buffer. Centrifuge and discard the supernatant after each wash.
- To prepare for the DNA library bead enrichment, add 1 mL of 1 N NaOH to the beads. Vortex the ADB and then incubate for 2 min at room temperature. Centrifuge and discard the supernatant. Repeat this wash step once.
- Add 1 mL of annealing buffer, then vortex the ADB and incubate for 2 min at room temperature. Briefly centrifuge and discard the supernatant. Repeat this step again using 100 µL of annealing buffer.
- To anneal sequencing primers to the DNA, add 15 µL of Seq Primer A and 15 µL of Seq Primer B provided in the kit. Briefly mix by vortexing and place the microcentrifuge tube in a heat block at 65 °C for 5 min. Transfer to ice for 2 min.
- Wash three times with 1.0 mL of annealing buffer. Vortex for 5 s and discard the supernatant each time.
- Before sequencing, measure the number of beads using a commercial bead counter. There should be at least 500,000 enriched beads.
NOTE: The bead counter is a special device that measures the beads in a supplied microcentrifuge tube.
3. General mRNA Isolation and dsDNA Synthesis Starting with Infected Canna Leaves that Test by RT-PCR for CaYMV Using Reported Diagnostic Primers
- Wear a laboratory coat and latex gloves for personal protection in all subsequent steps. Working at a laboratory bench, collect 12 samples from the leaves and plunge the samples into liquid nitrogen. Use a bead mill for homogenization. Use a commercial kit that provides a standard column-based method for total plant RNA isolation. Add the guanidine-isothiocyanate lysis buffer provided by the kit to the ground sample and shake for 20 s.
- Add ethanol and mix thoroughly, according to kit instructions. Add each homogenate to a spin column that binds RNA to the membrane. Wash three times and elute the RNA into a recovery tube24.
- Quantify the RNA using a spectrophotometer to measure the ratio of absorbance at 260 λ and 280 λ. Verify the RNA integrity using 1% agarose gel electrophoresis stained with ethidium bromide.
NOTE: An absorbance ratio between 1.85 and 2.0 indicates that the preparation is of the desired quality. Treat RNA with DNase I (10 µg/mL) for 10 min at 37 °C. Use a commercial spin column to concentrate RNA in RNase-free water31. Pool RNA samples before proceeding. - Use an rRNA removal kit to remove plant ribosomal RNA. Aliquot magnetic beads to the microcentrifuge tube and wash twice with RNase-free water. Vortex the tube aliquot to resuspend, place the tube on a magnetic stand and wait for liquid to clear. Discard the supernatant and replace with the magnetic bead resuspension solution. Vortex to resuspend and add 1 µL of RNase Inhibitor.
NOTE: Such kits use oligo-dT bound to magnetic beads which hybridize to mRNA. The method uses standard magnet bead separation technology to recover transcripts24. - Combine 500 ng to 1.25 µg of RNA, RNase-free water, and reaction buffers provided by the kit. Place the mixture for 10 min at 50 °C. Remove from heat and add washed magnetic beads in RNAse free water. Vortex briefly and set at room temperature for 5 min.
- Place on a magnetic stand and wait for the liquid to clear. Transfer the supernatant to a fresh microcentrifuge tube. Set on ice.
- Use a solution-based capture method for enrichment of exosomes and 200 ng of RNA to prepare the cDNA library.
NOTE: The double strand cDNA library is typically prepared by a NGS facility which carries out customer-oriented work. - Fragment the RNA using a commercial RNA fragmentation solution (0.136 g ZnCl2 and 100 mM Tris-HCl pH 7.0). Add 2 µL of solution to 18 µL of RNA (200 ng total). Spin tubes briefly in the microcentrifuge, place the samples at 70 °C for 30 s, and transfer to ice. Stop the reaction using 2 µL of 0.5 M EDTA pH 8.0 and 28 µL of 10 mM Tris-HCl pH 7.5.
- Bind RNA to magnetic beads by mixing at room temperature for 10 min. Use a magnetic concentrator to collect the beads and discard the supernatant. Wash the beads three times with 200 µL of 70% ethanol. Discard each wash and then air dry the pelleted beads at room temperature for 3 min. Resuspend in 19 µL of 10 mM Tris-HCl pH 7.5.
- Anneal random primers to fragmented RNA by heating to 70 °C for 10 min and then place the tube on ice for 2 min. Prepare the first strand and second strand cDNA using a standard commercial cDNA synthesis kit.
- Purify the double-strand cDNA using a magnetic bead concentrator. Wash with 800 µL of 70% ethanol three times. Discard each wash and air dry the pellets at room temperature for 3 min. Resuspend in 16 µL of 10 mM Tris-HCl pH 7.5. Use the magnetic bead concentrator to separate the beads from the double-stranded cDNA, which is now in solution. Remove the cDNA by pipetting into a new 200 µL PCR tube.
- Carry out fragment end repair using Taq polymerase and a mixture of deoxyribonucleotides provided by a commercial library preparation kit. The commercial kit provides pre-diluted adapters to add to each end of the double-strand cDNA using commercial ligase at 25 °C for 10 min.
4. NGS of DNA Library Prepared from Crude Virus Preparation and dsDNA Library Prepared from mRNA
- Use a standard high throughput pyrosequencing instrument and follow all recommended manufacturers' protocols to generate direct readouts of DNA sequences. Use commercial sequencing reagents, including fluorescently labeled nucleotides.
NOTE: For details refer manufacturer's instructions provided with the instrument. - Carry out post-sequencing analysis using genome assembly software which automatically assembles reads to produce the first set of contigs with an average length of < 700 bp. Use the FastQC software on the iPlant/CyVerse website which performs quality control checks on the raw sequence data32. Select sequences with Phred scores ≥ 30 to continue to reconstruct longer sequences from smaller sequence reads24 using mapping and amplicon software.
NOTE: For details refer manufacturer's instruction. - Submit these assembled contigs to NCBI-BLASTn analysis using MEGABLAST default module as well as Viridplantae (TaxID: 33090) and Viruses (TaxID: 10239) as the limiting organismal names33. Gather the subpopulation of contigs that show high similarity to reported Badnavirus genomes into a report.
- Verify that the joined scaffolds that represent one or more candidate full-length virus genomes, correctly produce in-frame sequences that have the same organization as the standard badnavirus genome. To do this, input the candidate full length virus genome into a plasmid drawing software. Then confirm the first 15 nucleotides consists of a tRNAmet (TGGTATCAGAGCGAG) which is highly conserved among badnaviruses. Locate the potential polyadenylation signal near the 3' end of the genome. Annotate the complete genome to identify the presence of two small ORFs and one large ORF encoding a polyprotein. Then use the ExPASy portal translate tool to identify the badnavirus ORF1, ORF2, and ORF3 translation products34.
NOTE: This scientific software is free and will generate circular DNA, identify all open reading frames, and provides an immediate output to verify that the sequence represents the full length circular DNA genome. - Use open source multiple sequence comparison tools, MUSCLE and CLUSTALW, to compare the virus genomes obtained from DNA and RNA analyses35,36.
- Search the NCBI nucleotide database to obtain the full genome sequences of 30 badnavirus species and export them as a document in .fasta format. Upload sequences to a software that conducts evolutionary genetic analysis of sequences along with the virus genome sequences obtained by NGS. Generate multiple sequence alignments and Maximum likelihood trees using MUSCLE37.
5. Quality Assessment of De Novo Sequencing by PCR Amplification of Virus Genomes from Infected Plants
- Input the newly identified full-length badnavirus genome sequences (.fasta format) into the free online Primer3 tool to derive PCR primers38. Identify primer sets that will produce staggered products of 1,000-1,500 bp along the entire length of the virus genome(s). Send the sequences to a service facility that will synthesize and deliver PCR primers.
NOTE: The output identifies acceptable primer pairs with common and acceptable melting temperatures and precise primer locations along the introduced sequences. - Working at a laboratory bench and wearing a lab coat and gloves, isolate 5 µg of DNA from the virus-infected and healthy control leaves using an automated method that involves standard paramagnetic cellulose particles to isolate DNA from plant material39 . Freeze leaf material (20-40 mg) in liquid nitrogen in a microcentrifuge tube and grind using a bead mill. Combine the sample with lysis buffer in a microcentrifuge tube and add RNase A to each sample. Vortex the sample for 10-20 s and briefly spin the sample to remove solid particles.
NOTE: Paramagnetic cellulose particles have high DNA-binding capacity and isolate high yields of pure DNA. The standard commercial silica column methods for DNA isolation do not efficiently extract DNA from a wide variety of plant species. Consequently, dozens of methods exist that are modifications of these procedures to improve the efficiency for individual plant species. The automated paramagnetic cellulose particle method was chosen because it yields more and higher quality DNA from more than 25 herbaceous angiosperm species40. - Use commercial reagent cartridges for automated paramagnetic DNA isolation. Add 300 µL of nuclease free water to each commercial reagent cartridge and transfer plant lysate to the same cartridge. Place the cartridge in the cartridge rack, place a plunger in the well closest to the elution tube, and place elution buffer into the elution tube. Load cartridges into the automated nucleic acid isolation machine and run the plant DNA isolation protocol41,42.
- Carry out PCR to derive a set of overlapping PCR products. Use 5 µM of each forward and reverse primer with 35 cycles of PCR amplification. Use the following cycling conditions: denaturation at 95 °C for 60 s, annealing at 50 °C for 45 s, and extension at 72 °C for 1-2 min with a final extension at 72 °C for 7-10 min. Use a prepackaged gel filtration column to eliminate salts and low molecular weight material as in step 1.231.
- Calculate a 3:1 molar ratio of PCR product to vector to determine the amount of PCR product to ligate to 50 ng of linearized pGEM plasmid43. Use a control insert DNA to determine whether the ligations work efficiently. Perform the ligation overnight using T4 DNA ligase (3 U/µL) at 4 °C. Then transform commercially prepared JM109 competent Escherichia coli cells. Use control 100 pg of uncut plasmid DNA as a positive control for efficient transformation. Plate 100 µL of transformed cells onto LB-agar plates with antibiotic and blue/white selection to recover ligated plasmids26. Incubate plates for 16-24 h at 37 °C.
NOTE: The pGEM vector has a lacZ gene which encodes β-galactosidase. Transformed bacteria grown on a plate containing 100 µg/mL ampicillin, 0.5 mM IPTG, 80 µg/mL 5-bromo-4-chloro-3-indoyl-β-D-galactopyranosidase (X-gal) will turn blue because of β-galactosidase activity. The pGEM plasmid is linearized in a manner that disrupts the lacZ gene. Colonies that contain the PCR product inserts disrupt the lacZ gene and do not metabolize X-gal. These colonies are white. Thus colonies with an insert can be differentiated from those without an insert by the color of the colony (white versus blue)26. - Isolate DNA from three colonies using a standard column-based plasmid isolation kit39. Sequence three plasmids of transformation product. Compare each DNA sequence with the de novo assembled virus genomes produced by NGS. Use CLUSTALW to align the sequences and to ensure that they are appropriately ordered.
Results
This modified virus purification method provided an enrichment of virus DNAs useful for identifying two virus species by NGS and bioinformatics. After the homogenate was centrifuged at 40,000 x g for 2.5 h, there was a green pellet at the bottom of the tube and a white pellet along the length. The green pellet was resuspended into one microcentrifuge tube and the white pellet was resuspended into two microcentrifuge tubes. PCR was carried out using standard CaYMV PCR diagnostic primers, and products were detected in the solubilized white pellet and not the green pellet (Figure 1A). A sample of the crude preparation was examined by transmission electron microscopy and we observed bacilliform particles measuring 124-133 nm in length (Figure 1B). This is within the predicted modal length of most badnaviruses. DNA was extracted from the white and green pellets and resuspended separately. In Figure 1C, we loaded 5 µL of DNA extracted from the green and white pellet sample (1.6 µg of DNA for the green fraction and 3.1 µg of DNA for the white fraction) to 0.8% agarose gel electrophoresis and analyzed the DNA following ethidium bromide staining. The green fraction contained low molecular weight DNA whereas the white fraction produced two bands of higher molecular weight DNA, as well as the lower molecular weight DNA (Figure 1C). The gel presented in Figure 1C was run for 40 min at 100 V and the smear in lane 3 suggests that the gel voltage should be lowered to produce clearer bands. These data suggest that the white pellet was enriched for virions. The DNA (0.6 µg/mL) concentration extracted from the white sample was low, but adequate for NGS, which requires a minimum of 10 ng of DNA to proceed. Fragmented DNAs were used to prepare a library for NGS.
In parallel, RNA was extracted from infected canna plants (Figure 1D) for high-throughput RNA-seq. A standard workflow was carried out for library preparation, NGS, creating contigs, and identifying viral genome sequences (Figure 1E).The output results from using DNA and RNA as starting materials were compared.
We obtained 188,626 raw DNA reads by NGS using DNA isolated from crude virus preparation. Reads were assembled into 13,269 contigs and BLASTn was used to search the NCBI dataset of nucleotide sequences (using Viridplantae TaxID: 33090 and Virus TaxID: 10239 as the limiting organisms) (Figure 1E). The NCBI-BLASTn results revealed that 93% of de novo assembled contigs were cellular sequences, 22% were unknown, and 0.3% were virus contigs (Figure 2A). The majority of contigs categorized as cellular sequences were identified as mitochondrial or chloroplast DNA. Within the dataset of virus contigs, 32% of the virus contigs were related to members of Caulimoviridae (that were not Badnavirus sequences) and 58% of these were related to Badnavirus. Of the virus contigs, 29% were highly similar (e < 1 x 10-30) to CaYMV isolate V17 ORF3 gene (EF189148.1), Sugarcane bacilliform virus isolate Batavia D, complete genome (FJ439817.1), and Banana streak CA virus complete genome (KJ013511). Within this population, there were long contigs that resembled two full length genomes.
High-throughput RNA-seq produced 153,488 cleaned individual sequence reads with an average read length of < 500 bp. Contig assembly reduced this to 8,243 contigs. These were submitted to NCBI-BLASTn (using Viridplantae TaxID: 33090 and Virus TaxID: 10239 as the limiting organisms) and the outputs placed 76% of the contigs in a category of plant cellular sequences, 23% were unknown, and 0.1% were categorized as virus contigs (Figure 2B). Closer examination of the population of the 0.1% population of virus contigs determined that 68% of these were assigned to Caulimoviridae (Figure 2B). Three large contigs within this population were identified with high similarity (e < 1 X 10-30) to CaYMV isolate V17 ORF3 gene (EF189148.1), Sugarcane bacilliform virus isolate Batavia D, complete genome (FJ439817.1) and Banana streak CA virus complete genome (KJ013511). Examining the three contigs, we manually joined two of these to produce a full-length virus genome.
We compared the virus genome length contigs produced by DNA and RNA sequencing as a mutual scaffold to confirm the presence of two full-length virus genomes. One full-length virus genome of 6,966 bp was tentatively named Canna yellow mottle associated virus 1 (CaYMAV-1) (Figure 3A). The second genome was 7,385 bp and a variant of CaYMV infecting Alpinia purpurata (CaYMV-Ap01) (Figure 3A).
Finally, PCR primers which were designed to clone ~1,000 bp fragment of each virus, were used to differentially detect both genomes in a population of 227 canna plants representing nine commercial varieties. In many instances individual plants were infected with both viruses. We provide an example of RT-PCR detection of CaYMAV-1 and CaYMV-Ap01 in the 12 plants. Three of these were positive only for CaYMV-Ap01 and nine were positive for both viruses (Figure 3B).
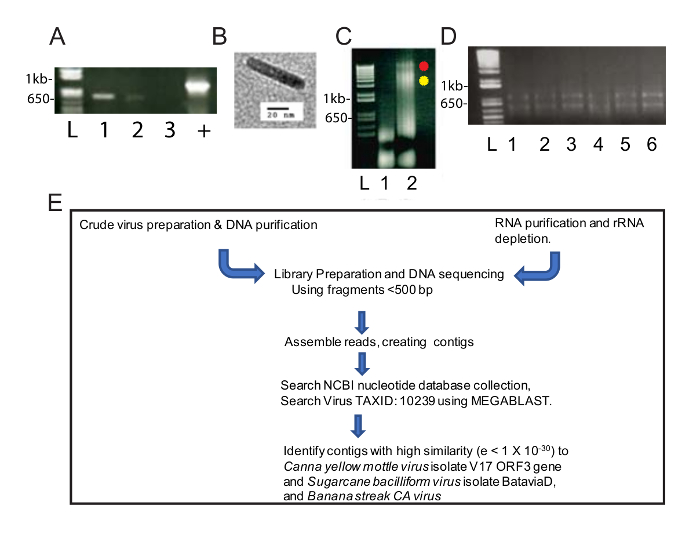
Figure 1: Virus nucleic acid preparations and NGS workflow. (A) Agarose (1.0%) gel electrophoresis of 565 bp PCR fragments of CaYMV genomes. Two PCR products were detected in samples prepared from the white pellet (lanes 1, 2) but not in the green pellet sample (lane 3). Positive control (+) represents a PCR product amplified from infected plant DNA that was isolated using an automated method involving standard paramagnetic cellulose particles. Lane L contains the DNA ladder used as a standard for measuring the size of linear DNA bands in sample lanes. (B) Example of virus particle viewed by transmission electron microscopy in the white pellet recovered by crude fractionation of infected canna leaves. (C) Agarose (0.8%) gel electrophoresis of DNA recovered from the green (lane 1) and white (lane 2) pellets that tested positive by PCR in panel A. The red and yellow dots next to lane 2 identify two high molecular weight DNA bands that occur in the white fraction. (D) Agarose (1%) gel electrophoresis of total RNA recovered by column-based RNA purification. Lane L contains the DNA ladder used as a standard for measuring the size of linear bands in sample lanes. Lane 1-6 contains RNA isolated from infected canna leaves which were pooled to a single sample for ribo-depletion and RNA-seq. (E) Schematic pipeline of nucleic acid isolations, library preparation, sequencing, contig assembly, and virus genome discovery. Please click here to view a larger version of this figure.
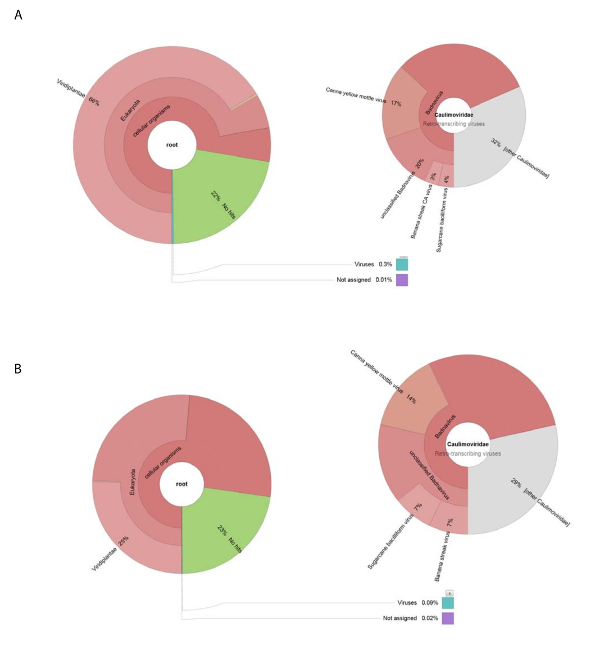
Figure 2: Krona charts visualizing the taxonomic categories of contigs. (A) The chart on the left shows the abundance and taxonomic distribution of contigs assembled from the crude virus preparation. The right chart depicts the proportions of virus contigs associated with the Caulimoviridae family, Badnavirus genus, and three closely related species. (B) The panel on the left shows the abundance of contigs derived from RNA-seq based on their taxonomic distribution. On the right is the graph depicting the abundance of contigs within the population of virus contigs associated with the Caulimoviridae family, Badnavirus genus, and three closely related species. Please click here to view a larger version of this figure.
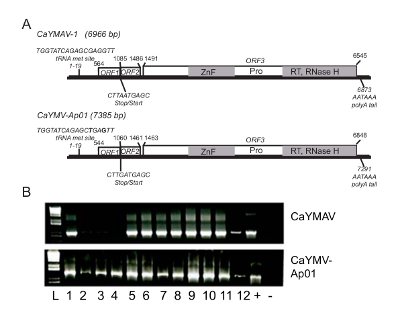
Figure 3. Characterization of CaYMAV-1 and CaYMV-Ap01 genomes. (A) Diagrammatic representation of Canna yellow mottle associate virus 1 (CaYMAV) and Canna yellow mottle virus similar to the genome isolated from Alpinia purpurata (CaYMV-Ap01). Nucleotide positions 1-10 is identified as the start of the genome and contains a tRNAmet anticodon site typical of most badnavirus genomes. The stop and start positions for translation of open reading frame (ORF) 1 and 2 are adjacent. These proteins have unknown functions. ORF3 is a polyprotein containing zinc finger (ZnF), protease (Pro), reverse transcriptase (RT), and RNAse H domains. A 3' poly(A) signal sequence is conserved for both virus genomes. (B) RT-PCR analysis was carried out using RNA isolated from virus infected leaves and primers that detect CaYMAV and CaYMV-Ap01. In the same population of 12 plants, three were infected with CaYMV-Ap01 only, whereas the remaining were infected with both CaYMAV and CaYMV-Ap01. (+) indicates positive control and (-) indicates negative control. This figure is reproduced/modified from Wijayasekara et al.24 with permission. Please click here to view a larger version of this figure.
Discussion
In recent years a variety of methods have been employed to study plant virus biodiversity in natural environments which include enriching for virus-like particles (VLP) or virus specific RNA or DNA2,3,44,45,46 . These methods are followed by NGS and bioinformatic analysis. The goal of this study was to find the causal agent of a common disease in a cultivated plant. The disease was reported to be the result of an unknown virus that has non-enveloped bacilliform particles, and for which only a 565 bp fragment has been cloned47. This information was sufficient for prior researchers to hypothetically assign the virus to the genus Badnavirus within the family Caulimoviridae. While prior reports hypothesized that canna mottle disease in canna lilies was the result of a single badnavirus, using the metagenomics approach outlined in this study, we determined that the disease was caused by two tentative badnavirus species24. Thus, the strength of using a metagenome approach to discover the causal agent of a disease is that we can now identify situations where there may be more than one cause.
Our approach combining DNA and RNA sequencing data is thorough and also demonstrates that the outcomes using two approaches yielded consistent results and confirmed the presence of two related viruses. We employed a modified procedure for isolation of caulimoviruses and produced a sample that was enriched for virus associated nucleic acids and that were protected within the virus capsid. A service laboratory was contracted to carry out DNA sequencing. The essential concept for de novo sequencing is that DNA polymerase incorporates the fluorescent labeled nucleotides into a DNA template strand during sequential cycles of DNA synthesis. The contigs assembled followed by NGS were submitted into a bioinformatic workflow producing a few contigs that were identified as virus contigs. Further confirmation of two virus genomes10,24,48,49,50 was obtained through bioinformatic analysis of RNA-seq data obtained from ribo-depleted RNA preparations. One interesting outcome was to learn that the populations of sequences recovered by DNA and RNA sequencing provided similar distributions of non-viral and viral nucleic acids. For DNA and RNA sequencing, < 0.5% of sequences were of virus origin. Within the population of virus sequences 78-82% belonged to the family Caulimoviridae. By comparing the assembled virus contigs from DNA and RNA sequencing, we confirmed that the two assembled genomes occurred in both datasets.
A concern of using only DNA sequencing to identify the new virus genomes is that the badnavirus genome is an open circular DNA. We surmised that sequences overlapping discontinuities in the genome might present obstacles for genome assembly from contigs. Initial examination of the DNA sequencing results revealed two similar virus genomes. We hypothesized that these genomes either represented genetic diversity of a species that has not been studied, or represented two species co-infecting the same plant24. Therefore, the collective bioinformatic analysis of datasets obtained by NGS DNA and RNA sequencing, enabled the confirmation of the presence of two full length genomes.
There is another report which developed an alternative method for extracting VLP and nucleic acids from plant homogenates for metagenomic studies, based on procedures to recover DNA from Cauliflower mosaic virus (CaMV; a caulimovirus)3. This approach identified novel RNA and DNA virus sequences in non-cultivated plants. The steps derived from the caulimovirus isolation procedure used in this study to discover the causal agent of a disease of cultivated plants are unlike the steps derived for extracting VLP from naturally infected plants24. The success of both modified methods suggests that the framework procedure for caulimovirus isolation may be a valuable starting point for metagenomic studies of plant viruses in general.
Disclosures
The authors have nothing to disclose.
Acknowledgements
Research was funded by Oklahoma Center for Advancement of Science and Technology Applied Research Program Phase II AR 132-053-2; and by the Oklahoma Department of Agriculture Specialty Crops Research Grant Program. We thank Dr. HongJin Hwang and the OSU Bioinformatics Core Facility which was supported by grants from NSF (EOS-0132534) and NIH (2P20RR016478-04, 1P20RR16478-02 and 5P20RR15564-03).
Materials
| Name | Company | Catalog Number | Comments |
|---|---|---|---|
| NaH2PO4 | Sigma-Aldrich St. Louis MO | S5976 | Grinding buffer for virus purification |
| Na2HPO4 | Sigma-Aldrich | S0751 | Grinding buffer for virus purification |
| Na2SO3 | Thermo-Fisher Waltham, MA | 28790 | Grinding buffer for virus purification |
| urea | Thermo-Fisher | PB169-212 | Homogenate extraction |
| Triton X-100 | Sigma-Aldrich | X-100 | Homogenate extraction |
| Cheesecloth | VWR Radnor, PA | 21910-107 | Filter homogenate |
| Tris | Thermo-Fisher | BP152-5 | Pellet resuspension& DNA resuspension buffers |
| MgCl2 | Spectrum, Gardena, CA | M1035 | Pellet resuspension buffer |
| EDTA | Spectrum | E1045 | Stops enzyme reactions |
| Proteinase K | Thermo-Fisher | 25530 | DNA resuspension buffer |
| phenol:chloroform:isoamylalcohol | Sigma-Aldrich | P2069 | Dissolve virion proteins |
| DNAse I | Promega | M6101 | Degrade cellular DNA from extracts |
| 95% ethanol | Sigma-Aldrich | 6B-100 | Virus DNA precipitation |
| Laboratory blender | VWR | 58984-030 | Grind leaf samples |
| Floor model ultracentrifuge &Ti70 rotor | Beckman Coulter, Irving TX | A94471 | Separation of cellular extracts |
| Floor model centrifuge and JA-14 rotor | Beckman Coulter | 369001 | Separation of cellular extracts |
| Magnetic stir plate | VWR | 75876-022 | Mixing urea into samples overnight |
| Rubber policeman | VWR | 470104-462 | Dissolve virus pellet |
| 2100 bioanalyzer Instrument | Agilent Genomics, Santa Clare, CA | G2939BA | Sensitive detection of DNA and RNA quality and quantity |
| 2100 Bioanalyzer RNA-Picochip | 5067-1513 | Microfluidics chip used to move, stain and measure RNA quality in a 2100 Bioanalyzer | |
| 2100 Bioanalyzer DNA-High Sensitive chip | 5067-4626 | Microfluidics chip used to move, stain and measure DNA quality in a 2100 Bioanalyzer | |
| Nanodrop spectrophotometer | Thermo-Fisher | ND-2000 | Analysis of DNA/RNA quality at intermediate steps of procedures |
| Plant total RNA isolation kit | Sigma-Aldrich | STRN50-1KT | Isolate RNA for RNA-seq |
| RNase-free water | VWR | 10128-514 | Resuspension of DNA and RNA for NGS |
| RNA concentrator spin column | Zymo Research, Irvine, CA | R1013 | Prepare RNA for RNA-seq |
| rRNA removal kit | Illumina, San Diego, CA | MRZPL116 | Prepare RNA for RNA-seq |
| DynaMag-2 Magnet | ThermoFisher | 12321D | Prepare RNA for RNA-seq |
| RNA enrichment system | Roche | 7277300001 | Prepare RNA for RNA-seq |
| Agarose | Thermo-Fisher | 16500100 | Gel analysis of DNA/RNA quality at intermediate steps of procedures |
| Ethidium bromide | Thermo-Fisher | 15585011 | Agarose gel staining |
| pGEM-T +JM109 competent cells | Promega, Madison, WI | A3610 | Clone genome fragments |
| pFU Taq polymerase | Promega | M7741 | PCR amplify virus genome |
| dNTPs | Promega | U1511 | PCR amplify virus genome |
| PCR oligonucleotides | IDT, Coralvill, IA | Custom order | PCR amplify virus genome |
| Miniprep DNA purification kit | Promega | A1330 | Plasmid DNA purification prior to sequencing |
| PCR clean-up kit | Promega | A9281 | Prepare PCR products for cloning |
| pDRAW32 software | ACAClone | Computer analysis of circular DNA and motifs | |
| MEGA6.0 software | MEGA | Molecular evolutionary genetics analysis | |
| Primer 3.0 | Simgene.com | ||
| Quant-iT™ RiboGreen™ RNA Assay Kit | Thermo-Fisher | R11490 | Fluorometric determination of RNA quantity |
| GS Junior™ pyrosequencing System | Roche | 5526337001 | Sequencing platform |
| GS Junior Titanium EmPCR Kit (Lib-A) | Roche | 5996520001 | Reagents for emulsion PCR |
| GS Jr EmPCR Bead Recovery Reagents | Roche | 5996490001 | Reagents for emulsion PCR |
| GS Junior EmPCR Reagents (Lib-A) | Roche | 5996538001 | Reagents for emulsion PCR |
| GS Jr EmPCR Oil & Breaking Kit | Roche | 5996511001 | Reagents for emulsion PCR |
| GS Jr Titanium Sequenicing kit* | Roche | 5996554001 | Includes sequencing reagents, enzymes, buffers, and packing beads |
| GS Jr. Titanium Picotiter Plate Kit | Roche | 5996619001 | Sequencing plate with associated reagents and gaskets |
| IKA Turrax mixer | 3646000 | Special mixer used with Turrax Tubes | |
| IKA Turrax Tube (specialized mixer) | 20003213 | Specialized mixing tubes with internal rotor for creating emulsions | |
| GS Nebulizers Kit | Roche | 5160570001 | Nucleic acid size fractionator for use during library preparations |
| GS Junior emPCR Bead Counter | Roche | 05 996 635 001 | Library bead counter |
| GS Junior Bead Deposition Device | Roche | 05 996 473 001 | Holder for Picotiter plate during centrifugation |
| Counterweight & Adaptor for the Bead Deposition Devices | Roche | 05 889 103 001 | Used to balance deposition device with picotiter plate centrifugation |
| GS Junior Software | Roche | 05 996 643 001 | Software suite for controlling the instrument, collecting and analyzing data |
| GS Junior Sequencer Control v. 3.0 | Roche | (Included in item 05 996 643 001 above) | |
| GS Run Processor v. 3.0 | Roche | (Included in item 05 996 643 001 above) | |
| GS De Novo Assembler v. 3.0 | Roche | (Included in item 05 996 643 001 above) | |
| GS Reference Mapper v. 3.0 | Roche | (Included in item 05 996 643 001 above) | |
| GS Amplicon Variant Analyzer v. 3.0 | Roche | (Included in item 05 996 643 001 above) |
References
- Dijkstra, J., Jager, C. P. Practical Plant Virology : Protocols and Exercises. , Springer-Verlag. Berlin Heidelberg. 1 edn (1998).
- Roossinck, M. J. Plant virus metagenomics: biodiversity and ecology. Annu Rev Genet. 46, 359-369 (2012).
- Melcher, U., et al. Evidence for novel viruses by analysis of nucleic acids in virus-like particle fractions from Ambrosia psilostachya. J Virol Methods. 152 (1-2), 49-55 (2008).
- Stobbe, A. H., Schneider, W. L., Hoyt, P. R., Melcher, U. Screening metagenomic data for viruses using the e-probe diagnostic nucleic Acid assay. Phytopathology. 104 (10), 1125-1129 (2014).
- Borah, B. K., et al. Bacilliform DNA-containing plant viruses in the tropics: commonalities within a genetically diverse group. Mol Plant Pathol. 14 (8), 759-771 (2013).
- Bousalem, M., Douzery, E. J., Seal, S. E. Taxonomy, molecular phylogeny and evolution of plant reverse transcribing viruses (family Caulimoviridae) inferred from full-length genome and reverse transcriptase sequences. Arch Virol. 153 (6), 1085-1102 (2008).
- Geering, A. D., et al. Banana contains a diverse array of endogenous badnaviruses. J Gen Virol. 86, Pt 2 511-520 (2005).
- Kunii, M., et al. Reconstruction of putative DNA virus from endogenous rice tungro bacilliform virus-like sequences in the rice genome: implications for integration and evolution. BMC Genomics. 5, 80(2004).
- Laney, A. G., Hassan, M., Tzanetakis, I. E. An integrated badnavirus is prevalent in Figure germplasm. Phytopathology. 102 (12), 1182-1189 (2012).
- Gambley, C. F., Geering, A. D., Steele, V., Thomas, J. E. Identification of viral and non-viral reverse transcribing elements in pineapple (Ananas comosus), including members of two new badnavirus species. Arch Virol. 153 (8), 1599-1604 (2008).
- Gayral, P., et al. A single Banana streak virus integration event in the banana genome as the origin of infectious endogenous pararetrovirus. J Virol. 82 (13), 6697-6710 (2008).
- Lyttle, D. J., Orlovich, D. A., Guy, P. L. Detection and analysis of endogenous badnaviruses in the New Zealand flora. AoB Plants. 2011, 008(2011).
- Le Provost, G., Iskra-Caruana, M. L., Acina, I., Teycheney, P. Y. Improved detection of episomal Banana streak viruses by multiplex immunocapture PCR. J Virol Methods. 137 (1), 7-13 (2006).
- Singh, K., Talla, A., Qiu, W. Small RNA profiling of virus-infected grapevines: evidences for virus infection-associated and variety-specific miRNAs. Funct Integr Genomics. 12 (4), 659-669 (2012).
- Alfson, K. J., Beadles, M. W., Griffiths, A. A new approach to determining whole viral genomic sequences including termini using a single deep sequencing run. J Virol Methods. 208, 1-5 (2014).
- Kreuze, J. F., et al. Complete viral genome sequence and discovery of novel viruses by deep sequencing of small RNAs: a generic method for diagnosis, discovery and sequencing of viruses. Virology. 388 (1), 1-7 (2009).
- Zheng, Y., et al. VirusDetect: An automated pipeline for efficient virus discovery using deep sequencing of small RNAs. Virology. 500, 130-138 (2017).
- James, A. P., Geijskes, R. J., Dale, J. L., Harding, R. M. Molecular characterisation of six badnavirus species associated with leaf streak disease of banana in East Africa. Annals of Applied Biology. 158 (3), 346-353 (2011).
- Baranwal, V. K., Sharma, S. K., Khurana, D., Verma, R. Sequence analysis of shorter than genome length episomal Banana streak OL virus like sequences isolated from banana in India. Virus Genes. 48 (1), 120-127 (2014).
- Sukal, A., Kidanemariam, D., Dale, J., James, A., Harding, R. Characterization of badnaviruses infecting Dioscorea spp. in the Pacific reveals two putative novel species and the first report of dioscorea bacilliform RT virus 2. Virus Res. 238, 29-34 (2017).
- BÖmer, M., Turaki, A. A., Silva, G., Kumar, P. L., Seal, S. E. A sequence-independent strategy for amplification and characterisation of episomal badnavirus sequences reveals three previously uncharacterised yam badnaviruses. Viruses. 8 (7), (2016).
- Momol, M. T., Lockhart, B. E. L., Dankers, H., Adkins, S. Canna yellow mottle virus detected in Canna in Florida. Plant Health Progress. , August 2-4 (2004).
- Zhang, J., et al. Characterization of Canna yellow mottle virus in a new host, Alpinia purpurata, in Hawaii. Phytopathology. 107 (6), 791-799 (2017).
- Wijayasekara, D., et al. Molecular characterization of two badnavirus genomes associated with Canna yellow mottle disease. Virus Res. 243, 19-24 (2018).
- Covey, S. N., Noad, R. J., al-Kaff, N. S., Turner, D. S. Caulimovirus isolation and DNA extraction. Methods Mol Biol. 81, 53-63 (1998).
- Sambrook, J., Fritsch, E. F., Maniatis, T. Molecular cloning: A laboratory manual. 2nd edn. , Cold Spring Harbor Press. (1989).
- Radford, A. D., et al. Application of next-generation sequencing technologies in virology. J Gen Virol. 93, Pt 9 1853-1868 (2012).
- Kanagal-Shamanna, R. Emulsion PCR: Techniques and Applications. Methods Mol Biol. 1392, 33-42 (2016).
- Getts, D. R., et al. Targeted blockade in lethal West Nile virus encephalitis indicates a crucial role for very late antigen (VLA)-4-dependent recruitment of nitric oxide-producing macrophages. J Neuroinflammation. 9, 246(2012).
- van Dijk, E. L., Jaszczyszyn, Y., Thermes, C. Library preparation methods for next-generation sequencing: tone down the bias. Exp Cell Res. 322 (1), 12-20 (2014).
- Gel filtration principles and methods. GE Healthcare. , (2010).
- Goff, S., et al. The iPlant Collaborative: Cyberinfrastructure for Plant Biology. Frontiers in Plant Science. 2, (2011).
- Lin, Z., et al. Next-generation sequencing and bioinformatic approaches to detect and analyze influenza virus in ferrets. J Infect Dev Ctries. 8 (4), 498-509 (2014).
- Artimo, P., et al. ExPASy: SIB bioinformatics resource portal. Nucleic Acids Res. 40, Web Server issue 597-603 (2012).
- Edgar, R. C. MUSCLE: a multiple sequence alignment method with reduced time and space complexity. BMC Bioinformatics. 5, 113(2004).
- Hung, J. H., Weng, Z. Sequence Alignment and Homology Search with BLAST and ClustalW. Cold Spring Harb Protoc. 2016 (11), (2016).
- Sohpal, V. K., Dey, A., Singh, A. MEGA biocentric software for sequence and phylogenetic analysis: a review. Int J Bioinform Res Appl. 6 (3), 230-240 (2010).
- Untergasser, A., et al. Primer3--new capabilities and interfaces. Nucleic Acids Res. 40 (15), 115(2012).
- Dhaliwa, A. DNA extraction and purification. Mater Methods. 3, 191(2013).
- Moeller, J. R., Moehn, N. R., Waller, D. M., Givnish, T. J. Paramagnetic cellulose DNA isolation improves DNA yield and quality among diverse plant taxa. Appl. Plant Sci. 2 (10), (2014).
- Moeller, J. R., et al. Paramagnetic cellulose DNA isolation improves DNA yield and quality among diverse plant taxa. Appl. Plant Sci. 2 (10), (2014).
- Grooms, K. Review: Improved DNA Yield and Quality from Diverse Plant Taxa. , (2015).
- Nishimori, A., et al. In vitro and in vivo antivirus activity of an anti-programmed death-ligand 1 (PD-L1) rat-bovine chimeric antibody against bovine leukemia virus infection. PLoS One. 12 (4), 0174916(2017).
- Rojas, M. R., Gilbertson, R. L. Plant Virus Evolution. Roossinck, M. J. 1, Springer-Verlag. 27-51 (2008).
- Roossinck, M. J. The big unknown: plant virus biodiversity. Curr Opin Virol. 1 (1), 63-67 (2011).
- Roossinck, M. J., Martin, D. P., Roumagnac, P. Plant Virus Metagenomics: Advances in Virus Discovery. Phytopathology. 105 (6), 716-727 (2015).
- Momol, M. T., Lockhart, B. E. L., Dankers, H., Adkins, S. Plant Health Progress. , Online (2004).
- Eni, A., Hughes, J. D., Asiedu, R., Rey, M. Sequence diversity among badnavirus isolates infecting yam (Dioscorea spp.). Archives of Virology. 153 (12), Ghana, Togo, Benin and Nigeria. 2263-2272 (2008).
- Harper, G., et al. The diversity of Banana streak virus isolates in Uganda. Arch Virol. 150 (12), 2407-2420 (2005).
- Muller, E., Sackey, S. Molecular variability analysis of five new complete cacao swollen shoot virus genomic sequences. Arch Virol. 150 (1), 53-66 (2005).
Reprints and Permissions
