

Summary
Here we present a tandem mass spectrometry-based protocol for the quantification of frequently used antibiotics in intensive care units, namely cefepime, meropenem, ciprofloxacin, moxifloxacin, linezolid, and piperacillin.
Abstract
There is an ever-increasing demand for the therapeutic drug monitoring of antibiotics in many clinical facilities, particularly with regard to the implementation of hospital antibiotic stewardship programs.
In the current work, we present a multiplex high-performance liquid chromatography-tandem mass spectrometry (HPCL-MS/MS) protocol for the quantification of cefepime, meropenem, ciprofloxacin, moxifloxacin, linezolid, and piperacillin, commonly used antibiotics in intensive care units. The method was previously comprehensively validated according to the guideline of the European Medicines Agency.
After a rapid sample cleanup, the analytes are separated on a C8 reverse-phase HPLC column within 4 minutes and quantified with the corresponding stable isotope-labeled internal standards in electrospray ionization (ESI+) mass spectrometry in multiple reaction time monitoring (MRM). The presented method uses a simple instrumentation setting with uniform chromatographic conditions, allowing for the daily and robust antibiotic therapeutic drug monitoring in clinical laboratories. The calibration curve spans the pharmacokinetic concentration range, thereby including antibiotic amounts close to the minimal inhibitory concentration (MIC) of susceptible bacteria and peak concentrations (Cmax) that are obtained with bolus administration regimens. Without the necessity of the serum dilution before the sample cleanup, the area under the curve for an administered antibiotic can be obtained through multiple measurements.
Introduction
Although antibiotics have revolutionized the practice of medicine, severe bacterial infections remain a leading cause of morbidity and mortality in critical illnesses1. In this regard, the prompt administration of a suitable anti-infective in an adequate dosage is of the uppermost importance for disease control2.
A growing body of evidence demonstrates that the empirical treatment with broad-spectrum antibiotics is becoming increasingly problematic with the complexity of patient populations. This is especially true for intensive care units (ICU), where a tremendous inter-individual variability of key pharmacokinetic (PK) parameters is frequently observed3,4. Accordingly, ICU patients are at imminent risk of sub-therapeutic levels with the danger of an insufficient therapeutic success5,6. Then again, patients are unnecessarily exposed to excessively high antibiotic concentrations that may result in serious adverse events with no clinical benefits7. Both the antibiotic misuse and the insufficient dosing have also fueled the dissemination of antibiotic resistance, which is becoming an ever-growing threat to public health8.
To improve the use of antibiotics and to preserve their effectivenessas long as possible, the World Health Organization has launched a global action plan on antimicrobial resistance in 20159. Antibiotic stewardship programs constitute an essential cornerstone of prudent antimicrobial use in national public health strategies10, helping clinicians to improve the quality of patient care11 and, at the same time, significantly reducing the antibiotic resistance12. Antimicrobial dosing in individual patients through the application of therapeutic drug monitoring (TDM) is a key instrument in this context13.
To date, commercially available TDM assays are only available for the glycopeptide antibiotics and aminoglycosides. The quantification of substances from other classes commonly requires an in-house method development or validation that can be cumbersome. We, therefore, present in detail the protocol for a robust mass spectrometry-based assay that can be used for the quantification of the most relevant antibiotics in ICU within their clinical relevant concentration ranges14. The method was recently established in our mass spectrometry facility and has been applied for the routine TDM in ICU since then. The procedure uses a straightforward and simple analytical setting with a uniform sample cleanup, allowing for the rapid implementation of antibiotic TDM in many facilities with mass spectrometry capabilities.
The protocol described here was optimized for the quantification of cefepime, meropenem, ciprofloxacin, moxifloxacin, linezolid, and piperacillin in human serum, using isotope dilution liquid chromatography (LC) in combination with a tandem mass spectrometry (MS/MS). For the isotope dilution LC-MS/MS methodology, stable isotope-labeled compounds are added to a sample of interest with a specific matrix (e.g., serum). Isotope-labeled standards can be distinguished from their unlabeled counterpart, namely the analyte of interest, due to different molecular weights of the natural molecule and their fragmentation products, termed a parent-ion-to-daughter-ion transition. As isotope-labeled compounds have an almost identical overall physicochemical behavior compared to their unlabeled counterpart, they are ideal internal standards for the MS/MS, allowing a nearly matrix-independent analyte quantification with a high degree of accuracy15. Nowadays, many stable isotope-labeled internal standards that can be used for small-molecule quantification, including the TDM of antimicrobials, are commercially available.
The chromatographic separation of the antibiotic analytes in the described protocol is performed with an analytical C8 alkyl-chain-length reverse-phase column (100 mm x 2.1 mm, 3 µm particle-size). During the method development, the internal standard normalized matrix factors for all analytes was between 94.6% and 105.4%, with a coefficient of variation of ≤8.3%14.
Subscription Required. Please recommend JoVE to your librarian.
Protocol
NOTE: It is recommended to work in a fume hood when handling organic solvent, such as methanol. Prepare all buffers and mobile phases in volumetric flasks. If not otherwise specified, the solutions can be stored at room temperature for up to 1 month after preparation.
1. Preparation of the Calibrators and Quality Control Samples
NOTE: A corresponding data analysis sheet for the preparation of stock and spike solutions is given in the Supplemental File. For reasons of traceability, insert the manufacturer, catalog number, and a lot number of each antibiotic in the corresponding columns. Dissolve all antibiotics in a cold storage at 4 °C and keep the working time as short as possible.
- Prepare 100 mL of 25% methanol in water: prefill a 100 mL volumetric flask with 25 mL of absolute methanol and fill it up to 100 mL with distilled water.
- Prepare 10 mL of 200 mM acetic acid in water: prefill a 10 mL volumetric flask with 9 mL of HPLC grade water, add 115 µL of glacial acetic acid (99.5% purity, 17.4 M), and add distilled water up to 10 mL.
- Prepare 25 mL of 25% methanol in water with 20 mM acetic acid: prefill a 25 mL volumetric flask with 2.5 mL of the aqueous 200 mM acetic acid solution, add 6.25 mL of absolute methanol, and fill up the flask to 25 mL with distilled water.
- Use a precision scale to weigh the proper amounts of antibiotics in 15-mL conical tubes as described in the Supplemental File in the column initial weight.
- Prepare stock solutions of the fluoroquinolones, ciprofloxacin, and moxifloxacin in the 25% methanol-water including 20 mM acetic acid. To do this, add the corresponding volume to the weighted quantities as described in the Supplemental File in the column "final volume". Rapidly dissolve the fluoroquinolone antibiotics in an ultrasound bath for 2 min and by intense vortexing.
- Prepare stock solutions of cefepime, meropenem, linezolid, and piperacillin in the 25% methanol-water. To do this, add the corresponding volume to the weighted quantities as described in the Supplemental File in the column final volume and rapidly dissolve the antibiotics by intense vortexing. Dissolve meropenem as the last substance.
- Combine the stock solutions of all the antibiotics as described in the corresponding volume of stock solution chart in the Supplemental File to yield tenfold concentrated spike-solutions.
- Spike nine volumes of drug-free serum with one volume of the tenfold concentrated spike solutions to obtain the serum calibrators 0–7 and quality controls (QC) A–D. For example, add 0.5 mL of spike solution to 4.5 mL of serum in a 10-mL polypropylene tube and incubate it for 15 min in the cold storage at 4 °C on a roller mixer at 50 rpm.
- Use a repetitive pipette to generate 100 µL aliquots of the calibrators and QCs in 1.5 mL polypropylene tubes.
- Store the calibrators, quality controls, and antibiotic stock solutions at -80 °C for up to six months.
- For each antibiotic, also prepare a neat solution containing 1,000 mg/L of a single antibiotic. Dilute the corresponding stock solution with an appropriate diluent (e.g., for ciprofloxacin, use 25% methanol-water including 20 mM acetic acid).
NOTE: The neat antibiotic solutions are required for the instrument-tuning only.
2. Preparation of the Internal Standards Mix
NOTE: Internal standards are isotope-labeled counterparts of the analytes of interest that are added to a sample during sample cleanup. As the internal standards have almost identical overall physicochemical properties to their unlabeled counterparts, they compensate for the matrix effects of a given sample.
- Prepare 10 mL of 50% methanol in water by adding 5 mL of absolute methanol to a 10 mL shake flask and fill it up to 10 mL with distilled water.
- Prepare 10 mL of 50% methanol in water including 20 mM acetic acid. To do this, add 1 mL of 200 mM acetic acid to a 10 mL flask, add 5 mL of absolute methanol, and fill it up to 10 mL with distilled water.
- Generate stock solutions of internal standards (IS) with 1,000 mg/L directly in the vials provided by the manufacturer. Dissolve cefepime-13C12D3 sulfate in distilled water, meropenem-D6, linezolid-D3, and piperacillin-D5 in a 50% methanol-water solution. Dissolve ciprofloxacin-D8 in 50% methanol-water with 20 mM acetate and moxifloxacin hydrochloride-13C1D3 in distilled water with 20 mM acetate.
- Combine the IS stock solutions in a 1.5 mL polypropylene tube to yield a fivefold concentrated internal standard mix. Add 10 µL of cefepime-13C12D3, 10 µL of meropenem-D6, 1 µL of ciprofloxacin-D8, 2 µL of moxifloxacin hydrochloride-13C1D3, 2 µL of linezolid-D3, and 10 µL of piperacillin-D5 to 965 µL of 25% methanol-water.
- Store the internal standard stock solutions and the fivefold concentrated IS mix at -80 °C.
3. Patient Sample Storage
NOTE: Ensure that the serum is obtained as fast as possible and that the cold chain of frozen samples is maintained.
- Collect the whole blood in the serum collection tubes.
- Let the blood clot for 20–30 min at room temperature.
- Separate the serum from the blood by centrifugation at 2,000 x g for 10 min.
- Transfer the supernatant to a clean polypropylene tube.
- Store the serum up to six months at -80 °C until it is assayed. Alternatively, store the samples up to 3 days at -20 °C.
4. Buffer Preparation for Chromatography
- To prepare 1 M ammonium formate in water, dissolve 6.306 g of ammonium formate in 100 mL of HPLC grade water using a 100 mL shake flask. Store the solution up to 1 month at 4 °C.
- Prepare the mobile phase A [10 mM ammonium formate in water-formic acid (99.9:0.1 v/v)]. Prefill a 1,000 mL volumetric flask with approximately 500 mL of HPLC grade water, add 1 mL of formic acid and 10 mL of the 1 M ammonium formate solution, and fill it to 1,000 mL with HPLC grade water. Transfer mobile phase A to a clean glass bottle and connect it to the HPLC system. Store mobile phase A up to 2 weeks at room temperature.
- Prepare the mobile phase B. Transfer HPLC-grade absolute methanol into a clean glass bottle and connect it to the HPLC system.
- Use absolute methanol as the needle wash solvent and connect the corresponding tube to the glass bottle containing mobile phase B.
- Generate the seal and a purge solvent of methanol-water-formic acid (7:92.9:0.1, v/v/v). Prefill a 1,000 mL volumetric flask with approximately 500 mL of distilled water, add 70 mL of absolute methanol, 1 mL of formic acid, and add distilled water to 1,000 mL. Transfer the solvent to a clean glass bottle and connect it with the HPLC system.
Note: Various autosampler systems use both a strong and a weak needle wash solvent. In such a case, prepare the wash solutions according to the manufacturer’s recommendations. For example, do the strong wash with methanol-water-isopropylic alcohol (70:20:10, v/v/v) and the weak wash with water-methanol (95:5, v/v).
5. Instrument Tuning
NOTE: This step is performed for the set-up of the method on a specific mass spectrometer.
- Dilute the neat 1,000 mg/L analyte and the internal standard solutions 1:10 or 1:100 in a mixture of mobile phase A and B (50:50, v/v), depending on the detector signal intensities. Tune the mass spectrometer with the autotune function or do a manual tuning for the following parent-to-daughter ions transitions14: cefepime (481.0 > 167.0/395.7), cefepime-13C12D3 (485.1 > 167.1/400.0), meropenem (384.1 > 114.0/141.0), meropenem-D6 (390.1 > 114.0/147.2), ciprofloxacin (332.0 > 231.0/245.0), ciprofloxacin-D8 (340.1 > 235.1/249.3), moxifloxacin (402.0 > 261.0/383.9), moxifloxacin-13C1D3 (406.1 > 265.1/388.0), linezolid (338.0 > 235.0/296.0), linezolid-D3 (341.1 > 235.1/297.1), piperacillin (518.0 > 143.0/358.9), and piperacillin-D5 (523.1 > 142.8/364.1).
- For instruments with autotuning, use the autotune function to automatically adjust the voltage and settings of the MS inlet through the detectors.
- For instruments with manual tuning, adjust the settings (e.g., collision voltage and collision energy) until the optimum (usually the maximum) signal intensity is obtained at the detector for each parent and daughter ion. For example, plug a mixing tee, deliver mobile phase A and B (50:50, v/v) at 0.5 mL/min, and continuously infuse the neat antibiotic or internal standard with a flow rate of 0.1 mL/min.
6. HPLC-MS/MS Set-up
NOTE: Features of the mass spectrometer, HPLC system (including the autosampler), and the corresponding software depend on the manufacturer. Adapt the mass spectrometer parameters and the wash procedure according to the manufacturer’s recommendations.
- Store the mass spectrometer parameters in a corresponding 'MS tune file'. Use electrospray ionization in the positive mode (ESI+) for all analytes. Adapt the ion source settings for the instrument used (e.g., a capillary voltage of 1.5 kV, a source temperature of 120 °C, a desolvation temperature of 400 °C, a desolvation gas flow rate of 600 L/h, an RF lens voltage of 0.1 V, and a dwell time of 80 ms).
- Specify the analyte and internal standards tune parameters (e.g., capillary voltage, collision energy) in an 'MS file'.
- Set the autosampler conditions as follows in the 'inlet file': the sample temperature at 10 °C with a limit of ± 5 °C; the wash sequence at 1x purge-wash-purge with a 600 µL purge volume replacement.
- In the above-mentioned 'inlet file', set the flow rate to 0.4 or 0.5 mL/min, the run time to 4 min, the pressure high limit to 345 bar, and the column temperature to 30 °C with a limit of ± 5 °C. Add the solvent name of mobile phases A and B and set them to 7% B/93% A, respectively.
- Program the chromatographic gradient in the 'inlet file' as follows: 0.00–0.10 min with 7% mobile phase B/93% A, 0.11–0.60 min with 65% mobile phase B/35% A, 0.61–2.10 min with 95% mobile phase B/5% A, 2.11–4.00 min with 7% mobile phase B/93% A.
NOTE: Calculate the extra-column volume, the hold-up volume for the instrumental platform, and the analyte retention factors as described in the USP <621> Chromatography guideline16.
7. Sample Measurement Master File
NOTE: With the 'sample measurement master file', the patient samples are specified, the HPLC-MS/MS analysis is started, and the data evaluation is performed. Two separate template files including a low- and high-quality control pair are generated; one template includes QC pair A and C, the other one QC pair B and D.
- Create a new 'sample measurement master file'. Select the above-mentioned 'MS tune file', 'MS file', and 'inlet file' (section 6), insert them in each sample line, and specify the injection volume with 15 µL.
- In ascending order, add the “sample text” for calibrators 0–7 and quality control (QC) pair A/C or QC pair B/D.
- Specify the sample type. Select the sample type “standard” for the calibrators and “QC” for the quality control pairs.
- Specify the concentration of each antibiotic substance for the corresponding calibrators and quality controls (see the spreadsheet, concentration [µg/mL] Cal 7–Cal 0, QC A/C or B/D,).
- Program the 'data evaluation method'. Use the transitions that were optimized during the instrument tuning (section 5). Match each antibiotic with the corresponding isotope-labeled standard (e.g., meropenem - meropenem-D6).
8. Sample Cleanup and HPLC-MS/MS Analysis
NOTE: For each sample batch, a paired quality control set with a low and high antibiotic concentration (QC A/C or QC B/D) is processed and analyzed. Between different batches, the paired QC samples are used in an alternate sequence (e.g., on day 1, select the 'sample measurement master file' including QC pair A/C; on day 2, select the one including QC pair B/D. The processing of the serum samples is illustrated in Figure 1.
- Prepare the precipitation agent 10% methyl-tert-butyl ether in methanol (10:90, v/v) (e.g., prefill a 25-mL volumetric flask with 2.5 mL of methyl-tert-butyl ether and fill it to 25 mL with absolute methanol).
- Place the C8 reverse phase into the column chamber. Connect it to the HPLC and mass spectrometer in the direction of the flow.
- Generate the sample list. Open the corresponding 'sample measurement master file' template and add the patient samples meant to be processed to the list. Generate groups of up to 20 patient samples and flank them with the corresponding quality control pair.
- Wet-prime the HPCL system using the 'inlet file' control software: set the “wet prime” function to 50% mobile phase A/50% B, and wet-prime for 2 min with a flow rate of 1 mL/min.
- Refresh the syringe. To do this, execute 6 strokes of 600 µL in the control software.
- Equilibrate the C8 reverse phase column. Using the software, turn on the flow in the 'inlet file' and flush it with 7% mobile phase B/93% A for a minimum of 5 min, using a flow rate of 0.5 mL/min. Verify the column temperature of 30 °C.
- Thaw the patient samples, one aliquot of calibrators 0–7, and a quality control pair (either A/B or C/D).
- With a repetitive pipette, add 25 µL of the internal standard mix to the 100 µL calibrator, QC sample, or patient serum in a 1.5 mL polypropylene tube, and vortex the tube for a few seconds.
- Incubate the mixture for 5 min at room temperature on a benchtop shaker (e.g., at 1,200 rpm).
- With a repetitive pipette, add 150 µL of a precipitation reagent to the sample-internal standard mix.
- Again, vortex the tube for a few seconds and incubate it for 5 min at room temperature on a benchtop shaker (e.g., at 1,200 rpm).
- Centrifuge the suspension at 20,000 x g in a tabletop centrifuge for 10 min at 4 °C.
- Dilute the supernatant 1:3 with HPLC grade water using a glass vial with a micro-insert and load it as processed samples to the autosampler.
- Manually start the HPLC-MS/MS analysis in the 'sample measurement control file'.
NOTE: For prolonged storage, thoroughly flush the analytical column according to the manufacturer’s recommendation [e.g., 0.5 mL/min methanol-water (50:50, v/v)] to prevent phase collapse.

Figure 1: Schematic representation of the sample cleanup. Protein precipitation at the high centrifugal force gives a dense pellet and clear supernatant, indicating that protein precipitation was complete. The entire processing time is approximately 30 min, including the sample cleanup, the chromatographic separation, and the MS/MS analysis. Please click here to view a larger version of this figure.
9. Quality Assessment and Quantification
- To process the samples, open the corresponding 'sample measurement control file', select the calibrators, quality controls, and patient samples, and evaluate them with the 'antibiotics quantification method'.
- Check whether the peaks for a specific analyte are properly integrated. Inspect the peaks for each calibrator, QC, and patient sample, and manually reintegrate them at the baseline if necessary.
- Study the calibration curve and examine whether it fulfills the following quality criteria: a) linearity over the entire calibration range, b) a calibration coefficient r2 > 0.995, c) the deviation of each calibration standard within ± 15% of the nominal value, except for the lower limit of quantification (LLOQ), where ± 20% is required.
- Reject a calibration standard not complying with the above-mentioned criteria and re-evaluate the calibration curve, including the regression analysis.
- Study the quality controls and examine whether the deviations are within ± 15% of the nominal value.
- If the concentration of a patient sample exceeds the concentration of the highest calibrator, dilute the sample with distilled water, up to 1:5 (e.g., 100 µL of serum plus 400 µL of distilled water) before the sample cleanup. Reperform steps 8.8–8.14 for that specific sample and reprocess it.
Subscription Required. Please recommend JoVE to your librarian.
Representative Results
Using the described protocol, a typical chromatogram is depicted in Figure 2. According to the United States Pharmacopeia (USP) chromatography guidelines16, the column dead volume in the present system was determined with ~0.22 mL and the extra-column volume (including the injector, tubing, and connectors) with ~0.08 mL, giving a hold-up volume of ~0.30 mL. The calculated retention factors for all analytes were 2.8 (for cefepime) - 4.2 (for piperacillin).
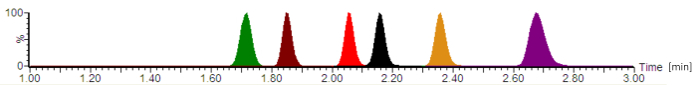
Figure 2: Typical analytical chromatogram with normalized signal intensities. The antibiotics are eluting in the following order: cefepime (green), meropenem (brown), ciprofloxacin (red), moxifloxacin (black), linezolid (orange), and piperacillin (purple). The retention times, which are given in minutes, and the analyte peak symmetries vary, depending on the exact composition of the mobile phases, the flow-rate, the chromatography tubing, and the analytical column age. Please click here to view a larger version of this figure.
Figure 3A contains a sample chart list for the processed samples, including the calibrators 0 - 7 ("Kalibrator 0" - "Kalibrator 7"), quality controls, and patient sera, that are indicated with the injection number (#); the sample identification text (Sample Text); the measured concentration in mg/L (Conc.); the sample type that is either a blank, standard, quality control, or patient sample (Type); the nominal concentration of the calibrators in mg/L (Std. Conc); the analytical retention time (RT); the response that is the ratio of the peak area of the analyte/peak area IS (Response); the deviation from the nominal concentration value (%Dev); the vial position (Vial); and the acquisition time (Acq.Time). The key parameter used for the quantification is the Response, gradually increasing with the analyte concentration, due to the constant amount of added isotope-labeled internal standard.
Figure 3B shows the calibration curve. In regression, the coefficient of determination r2 should be > 0.995. The following calibration model is used for all analytes described in this method: curve type = linear; origin = included; weighting = 1/x; axis transformation = none. In the given example, the calibration curve and quality controls fulfill all quality criteria: r2 > 0.995 for the calibration curve and the deviation of the calibrators (including the LLOQ) and the QC samples is within ± 15% of the nominal value.
The measured parent-to-daughter ion transitions (MRM) are given in Figure 3C, showing four peaks at the same retention time: the two upper peaks depict two transitions that are measured for the analyte of interest, the lower two peaks represent the transitions for the corresponding isotope-labeled internal standard. For the quality assessment, the analyte peaks in the respective retention time windows are visually checked and manually reintegrated at the baseline, when necessary.
The minimally inhibitory concentration (MIC) is the central component of the antimicrobial TDM, defining the pharmacokinetic exposure that is required to achieve a target pharmacokinetic/pharmacodynamic (PK/KD) ratio13,17. Accordingly, the target antibiotic TDM concentration levels are expressed in relation to the MIC of the causative pathogen. Given that the action of beta-lactam antibiotics is time-dependent, their efficacy is maximized through the achievement of the therapeutic concentrations that exceed the MIC 4x -5x (fT > 4-5x MIC).When facing unknown infectious pathogens, the target trough concentration range of free (protein-unbound) piperacillin is, therefore, 64 mg/L, corresponding to approximately 90 mg/L total piperacillin18.
The first patient (sample #11) has a satisfactory high serum trough level of 83.4 mg/L piperacillin that is also sufficient for problem pathogens, such as Pseudomonas aeruginosa. The second patient (sample #12) has a concentration of approximately 0.2 mg/L, which is below the lowest calibrator (LLOQ). Perhaps the patient has recovered, and the administration of piperacillin was discontinued. The result "< 0.5 mg/L" is, therefore, reported in the hospital information system. The third patient (sample #13) has a low piperacillin trough concentration of only 5.3 mg/L that is not sufficient for the clear majority of pathogens. For effective antimicrobial chemotherapy, the dosage should be increased by the physician.
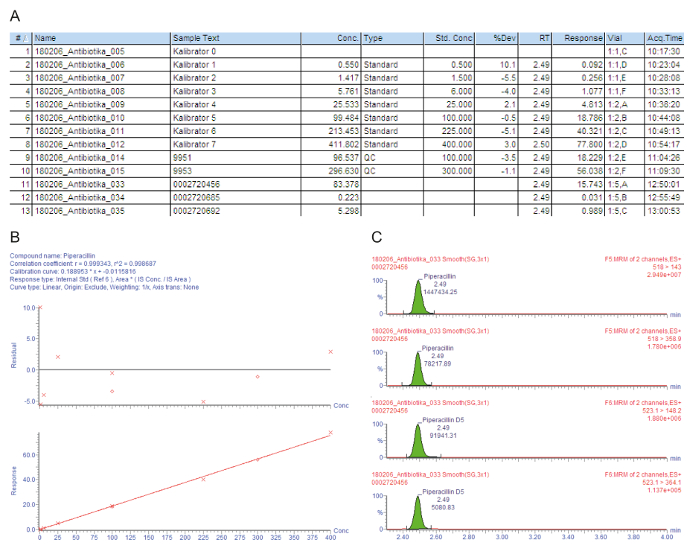
Figure 3: Exemplary quality assessment and quantification for the analyte piperacillin. These panels represent the mass spectrometry data analysis. (A) This panel shows the sample list, including the calibrators (Standard, samples #1 - #8), quality controls (QC, samples #9 and #10), and patient sera (samples #11 - #13). Calibrator 0 refers to the blank without analyte, but with the addition of an internal standard. 9951 represents QC B, 9953 represents QC D. (B) This panel shows the calibration curve for piperacillin. The percentage deviations from the nominal calibrator concentrations are given in the upper graph (y-axis: residual), the lower graph depicts the linear calibration range. (C) This panel shows the multiple reaction time monitoring (MRM) for piperacillin and the corresponding internal standard piperacillin-D5 for patient serum sample #12. Two parent-to-daughter ion transitions are presented with their retention time and respective signal intensities. Please click here to view a larger version of this figure.
Supplemental File. Please click here to download this file.
Subscription Required. Please recommend JoVE to your librarian.
Discussion
In this manuscript, we report the protocol for a simple and robust tandem mass spectrometry-based method for the quantification of frequently used antibiotics in ICU19, namely cefepime, meropenem, ciprofloxacin, moxifloxacin, linezolid, and piperacillin14. A spreadsheet accompanies the manuscript for the preparation of antibiotic stock solutions, calibrators, and quality controls, taking into account the purity of the antibiotics and the molecular weight of their counterions. Given that the concentrations of the antibiotics are rather high, their quantification should be no particular challenge from an analytical perspective. Accordingly, we are confident that this protocol is applicable to various MS instrumental platforms. For a method transfer, users are encouraged to quantify the extra-column volume and hold-up volume of their chromatographic system and to adapt the gradient start time accordingly16. During the method set-up, the system should also be evaluated for carry-over and, if necessary, a blank sample must be injected after the highest calibrator and patient samples with high antibiotic concentrations. Users must also consider the possibility of detector saturation that occurs when too many ions enter a tandem mass spectrometer. Relevant detector saturation can be eliminated with smaller injection volumes, a higher analyte dilution during the sample cleanup, and/or a detuning of a target analyte (e.g., downgrading the optimal voltage settings).
Contrary to other methods, the calibration range allows both a quantification of concentrations close to the MIC of susceptible pathogens, as well as peak concentrations (cmax) that are obtained with a bolus administration. The highest Cmax-values for adults are reported in the corresponding professional information sheets on the FDA drug safety database as follows: 163.9 mg/L for cefepime20, 112 mg/L for meropenem21, 4.6 mg/L for ciprofloxacin22, 4.1 mg/L for moxifloxacin23, 21.2 mg/L for linezolid24, and 298 mg/L for piperacillin25. Antibiotic concentration monitoring in the patient's blood circulation allows a dose adjustment to the susceptibility of the involved pathogens, but the pharmacokinetic area under the curve can also be obtained through multiple blood sampling with the given protocol.
Many antibiotics (especially beta-lactam meropenem) are chemically unstable once dissolved. The most critical step in this protocol is, therefore, the preparation of the stock solutions, calibrators, and quality controls under cold conditions26,27. In that respect, it is also essential to freeze patient samples as quickly as possible. Although serum storage at -80 °C is recommended26, our stability experiments show that samples can also be stored up to 3 days at -20 °C without any significant decrease of antibiotics concentrations (even at the trough levels).
We recommend performing a system suitability test before each HPLC-MS/MS analysis of patient samples (e.g., with calibrator 3). Generally, a system suitability test is used to verify the repeatability of the LC-MS/MS system and to see if it is also adequate for the analysis to be done. Thus, for instance, decreasing signal intensities are caused by a contamination of the MS sweep cone, which, then, requires its cleaning with an organic solvent. To keep the MS source clean, a divert valve can be introduced after the chromatography column, directing "analyte-free" portions of the mobile phase to the waste before they reach the mass spectrometer. On the other hand, an overall increase of the pressure can indicate column clogging over time. To increase the column longevity usage of a cost-effective precolumn filter is recommendable. If the pressure still continues to be a problem, a flow rate of 0.4 mL/min can also be used with the chromatographic gradient in this protocol.
A minor limitation of this technique is that it requires three separate manual steps for sample clean-up, resulting in a total turnaround time of approximately 30 min. Adding the isotope-labeled internal standards to the precipitation agent may save some processing time. However, this should only be done for high sample throughput rates and with the precipitation agent being stored in the cold (e.g., at -20 °C), as the internal standards also degrade in vitro at elevated temperatures.
The described protocol has been developed for sample processing in standard 1.5 mL polypropylene tubes. Should a higher throughput rate be required for antibiotic TDM, the procedure can be upgraded to the multi-well plate format using adequate centrifuge inserts or filter plates with a vacuum manifold.
Subscription Required. Please recommend JoVE to your librarian.
Disclosures
The authors have nothing to disclose.
Acknowledgments
The authors thank Dr. Schütze for his help with establishing the presented method and Dr. Zoller for the valuable input regarding the proper calibration range. The authors also acknowledge the technical staff of the mass spectrometry facility.
Materials
| Name | Company | Catalog Number | Comments |
| cefepime hydrochloride | Sigma-Aldrich | 1097636 | USP Reference Standard |
| meropenem trihydrate | Sigma-Aldrich | Y0001252 | EP Reference Standard |
| ciprofloxacin | Sigma-Aldrich | 17850 | |
| moxifloxacin hydrochloride | Sigma-Aldrich | SML1581 | |
| linezolid | Toronto Research Chemicals | L466500 | |
| piperacillin sodium salt | Sigma-Aldrich | 93129 | |
| cefepime-13C12D3 sulfate | Alsachim | C1297 | Isotope labelled internal standard for cefepime |
| meropenem-D6 | Toronto Research Chemicals | M225617 | Isotope labelled internal standard for meropenem |
| ciprofloxacin-D8 | Toronto Research Chemicals | C482501 | Isotope labelled internal standard for ciprofloxacin |
| moxifloxacin-13C1D3 hydrochloride | Toronto Research Chemicals | M745003 | Isotope labelled internal standard for moxifloxacin |
| linezolid-D3 | Toronto Research Chemicals | L466502 | Isotope labelled internal standard for linezolid |
| piperacillin-D5 | Toronto Research Chemicals | P479952 | Isotope labelled internal standard for piperacillin |
| methanol | JT Baker | 8402 | |
| HPLC grade water | JT Baker | 4218 | |
| formic acid | Biosolve | 6914132 | |
| acetic acid | Biosolve | 1070501 | |
| ammonium formate | Sigma-Aldrich | 70221-25G-F | |
| tert-Butyl methyl ether | Merck | 101845 | |
| Fortis 3 μm C8 100 * 2.1 mm | Fortis | F08-020503 | |
| Ti-PEEK-encased Prifilter (2 μm) | Chromsystems | 15011 | |
| 2795 Alliance HPLC system | Waters | 176000491 | |
| Quattro micro API Tandem Quadrupole System | Waters | 720000338 | |
| QuanLynx 4.1 software | Waters | / | Data evaluation software provided by the mass spectrometer manufacturer |
| Supplemental File | Stock Solutions |
References
- Fleischmann, C., et al. Assessment of Global Incidence and Mortality of Hospital-treated Sepsis. Current Estimates and Limitations. American Journal of Respiratory and Critical Care Medicine. 193 (3), 259-272 (2016).
- Dellinger, R. P., et al. Surviving Sepsis Campaign: international guidelines for management of severe sepsis and septic shock, 2012. Intensive Care Medicine. 39 (2), 165-228 (2013).
- Lodise, T. P., Drusano, G. L. Pharmacokinetics and pharmacodynamics: optimal antimicrobial therapy in the intensive care unit. Critical Care Clinics. 27 (1), 1-18 (2011).
- Macedo, R. S., Onita, J. H., Wille, M. P., Furtado, G. H. Pharmacokinetics and pharmacodynamics of antimicrobial drugs in intensive care unit patients. Shock. 39, Suppl 1. 24-28 (2013).
- Petersson, J., Giske, C. G., Eliasson, E. Standard dosing of piperacillin and meropenem fail to achieve adequate plasma concentrations in ICU patients. Acta Anaesthesiologica Scandinavica. 60 (10), 1425-1436 (2016).
- Abdul-Aziz, M. H., Lipman, J., Mouton, J. W., Hope, W. W., Roberts, J. A. Applying pharmacokinetic/pharmacodynamic principles in critically ill patients: optimizing efficacy and reducing resistance development. Seminars in Respiratory and Critical Care Medicine. 36 (1), 136-153 (2015).
- Imani, S., Buscher, H., Marriott, D., Gentili, S., Sandaradura, I. Too much of a good thing: a retrospective study of beta-lactam concentration-toxicity relationships. Journal of Antimicrobial Chemotherapy. 72 (10), 2891-2897 (2017).
- Ventola, C. L. The antibiotic resistance crisis: part 1: causes and threats. Pharmacy & Therapeutics. 40 (4), 277-283 (2015).
- World Health Organization. Global Action Plan on Antimicrobial Resistance. , Available from: http://www.who.int/antimicrobial-resistance/global-action-plan/en (2015).
- Pulcini, C. Antibiotic stewardship: update and perspectives. Clinical Microbiology and Infection. 23 (11), 791-792 (2017).
- Cairns, K. A., et al. The impact of a multidisciplinary antimicrobial stewardship team on the timeliness of antimicrobial therapy in patients with positive blood cultures: a randomized controlled trial. Journal of Antimicrobial Chemotherapy. 71 (11), 3276-3283 (2016).
- Baur, D., et al. Effect of antibiotic stewardship on the incidence of infection and colonisation with antibiotic-resistant bacteria and Clostridium difficile infection: a systematic review and meta-analysis. Lancet Infectious Diseases. 17 (9), 990-1001 (2017).
- Roberts, J. A., Norris, R., Paterson, D. L., Martin, J. H. Therapeutic drug monitoring of antimicrobials. British Journal of Clinical Pharmacology. 73 (1), 27-36 (2012).
- Paal, M., Zoller, M., Schuster, C., Vogeser, M., Schutze, G. Simultaneous quantification of cefepime, meropenem, ciprofloxacin, moxifloxacin, linezolid and piperacillin in human serum using an isotope-dilution HPLC-MS/MS method. Journal of Pharmaceutical and Biomedical Analysis. 152, 102-110 (2018).
- Vogeser, M., Seger, C. Pitfalls associated with the use of liquid chromatography-tandem mass spectrometry in the clinical laboratory. Clinical Chemistry. 56 (8), 1234-1244 (2010).
- United States Pharmacopeia and National Formulary. Chapter <621>. CHROMATOGRAPHY (USP 37-NF 32 S1). , United Book Press, Inc. Baltimore, MD. 6376-6385 (2014).
- Wong, G., Sime, F. B., Lipman, J., Roberts, J. A. How do we use therapeutic drug monitoring to improve outcomes from severe infections in critically ill patients? BMC Infectious Diseases. 14, 288 (2014).
- EUCAST: European Committee on Antimicrobial Susceptibility Testing. Information on clinical breakpoint tables. , Available from: http://www.eucast.org/clinical_breakpoints/ (2017).
- Surveillance der Antibiotika-anwendung und der bakteriellen Resistenzen auf Intensivstationen. SARI information for antibiotic consumption 2016 of all intensive care units participating at SARI. , Available from: http://sari.eu-burden.info/auswertung/down/AD-ZEIT.pdf (2016).
- Cefepime hydrochloride: Highlights of prescribing information. , Available from: https://www.accessdata.fda.gov/drugsatfda_docs/Label/2016/050679s040lbl.pdf (2016).
- Meropenem: Highlights of prescribing information. , Available from: https://www.accessdata.fda.gov/drugsatfda_docs/Label/2008/050706s022lbl.pdf (2006).
- Ciprofloxacin hydrochloride: Highlights of prescribing information. , Available from: https://www.accessdata.fda.gov/drugsatfda_docs/Label/2016/019537s086lbl.pdf (2016).
- Moxifloxacin hydrochloride: Highlights of prescribing information. , Available from: https://www.accessdata.fda.gov/drugsatfda_docs/Label/2010/021277s038lbl.pdf (2010).
- Linezolid: Highlights of prescribing information. , Available from: https://www.accessdata.fda.gov/drugsatfda_docs/Label/2012/021130s028lbl.pdf (2011).
- Piperacillin and Tazobactam: Highlighs of prescribing information. , Available from: https://www.accessdata.fda.gov/drugsatfda_docs/Label/2017/050684s88s89s90_050750s37s38s39lbl.pdf (2017).
- Zander, J., et al. Effects of biobanking conditions on six antibiotic substances in human serum assessed by a novel evaluation protocol. Clinical Chemistry and Laboratory. 54 (2), 265-274 (2016).
- Zander, J., et al. Quantification of piperacillin, tazobactam, cefepime, meropenem, ciprofloxacin and linezolid in serum using an isotope dilution UHPLC-MS/MS method with semi-automated sample preparation. Clinical Chemistry and Laboratory. 53 (5), 781-791 (2015).
