This protocol provides an efficient approach to measuring LDL cholesterol uptake with real time influx rates using a live cell imaging system in various cell types. This technique provides a platform to screen the pharmacological activity of compounds affecting LDL influx while monitoring for cell morphology and hence potential cytotoxicity.
Method Article
LDL Cholesterol Uptake Assay Using Live Cell Imaging Analysis with Cell Health Monitoring
* These authors contributed equally
In This Article
Summary
Abstract
The regulation of LDL cholesterol uptake through LDLR-mediated endocytosis is an important area of study in various major pathologies including metabolic disorder, cardiovascular disease, and kidney disease. Currently, there is no available method to assess LDL uptake while simultaneously monitoring for health of the cells. The current study presents a protocol, using a live cell imaging analysis system, to acquire serial measurements of LDL influx with concurrent monitoring for cell health. This novel technique is tested in three human cell lines (hepatic, renal tubular epithelial, and coronary artery endothelial cells) over a four-hour time course. Moreover, the sensitivity of this technique is validated with well-known LDL uptake inhibitors, Dynasore and recombinant PCSK9 protein, as well as by an LDL uptake promoter, Simvastatin. Taken together, this method provides a medium-to-high throughput platform for simultaneously screening pharmacological activity as well as monitoring of cell morphology, hence cytotoxicity of compounds regulating LDL influx. The analysis can be used with different imaging systems and analytical software.
Introduction
The Low Density Lipoprotein Receptor (LDLR)-mediated LDL endocytosis is an important area of study since circulating LDL cholesterol levels are at the core of cardiovascular disease1, kidney disease2 as well as a variety of inflammatory diseases3 and genetic disorders with mutations in cholesterol transport genes4,5,6,7. Studies in LDLR-mediated cholesterol influx have led to identification of multiple research tools, such as Dynamin inhibitors including the chemical Dynasore8,9,10, as well as LDL-regulating proteins such as Proprotein Convertase Subtilisin/Kexin type 9 (PCSK9)11,12.
The LDL-LDLR endocytosis pathway begins with sequestering the LDL-LDLR complex on the cell surface into clathrin-coated pits13. Vesicles are then formed by invagination of the cell surface membrane internalizing the LDL-LDLR complex in vacuoles for transport inside the cell. As the formed vesicle matures into early and then late endosomes, the pH drops inside the late endosome, causing disassociation of the LDL from its receptor14. In the past, the methods of quantification of LDL influx depended on radio-labeled 125I-LDL co-incubation with cells and subsequent extraction of the radio-labelled protein from cells for quantification15. This was then replaced by the use of fluorescently labelled LDL proteins such as DiI-LDL, and subsequent immunostaining or extraction of protein for fluorescent readings using a spectrophotometer or plate reader15,16. Fluorescently labelled LDL has also been used in Fluorescence-activated cell sorting (FACS) for analysis of internalization of LDL and cell surface LDL binding17. While these methods allow for collection of data after treatment, monitoring the viability of the cells during treatment is not possible.
The acidic pH in the late endosome allows the use of a pH-activated fluorescent LDL probe such as pHrodo Red LDL that fluoresces after internalization18,19. This property allows for a continuous time course of LDL uptake assessment in live cells. Therefore, this protocol utilizes pHrodo Red-LDL fluorescence imaging in a live cell analysis to serially measure LDL uptake with concurrent monitoring for the cell health. The results indicate the reliability of this novel technique as tested over a four-hour time course in three different human cell lines, human hepatic carcinoma (HepG2) cells, human renal epithelial (HK2) cells and human coronary arterial endothelial cells (HCAEC). These cell lines are clinically significant to LDL clearance20,21,22,23,24,25,26,27, kidney disease28,29,30,31, and heart disease32,33, respectively. In addition to monitoring the LDL influx, this protocol incorporates treatment with two well-known LDL uptake inhibitors, Dynasore Hydrate and recombinant PCSK9 protein as well as a statin inducer of LDLR expression and LDL uptake, simvastatin. Dynasore and recombinant PCSK9 each work through different pathways to reduce LDL uptake.
Dynasore is a small molecule inhibitor of Dynamins10 and reduces LDL uptake by blocking clathrin-dependent endocytosis of LDL-LDLR complex10,34. Recombinant PCSK9, on the other hand, is a member of peptidase S8 family that binds to LDLR and inhibits its recycling to the cell surface after releasing LDL from the internalized complex by blocking required conformational changes35,36. Decreased cell surface LDLR density eventually leads to reduced LDL uptake by the cell. Statins, while directly blocking the 3-hydroxy-3-methylglutaryl-coenzyme (HMG-CoA) reductase enzyme and thus cholesterol biosynthesis, are also known to upregulate the expression of LDLR25,38 leading to increased LDL uptake. The sensitivity of this protocol is validated by detecting significant reductions in LDL influx in three clinically relevant human cell lines, HK2, HepG2 and HCAECs, by Dynasore and/or recombinant PCSK9, and a marked increase in LDL uptake in HepG2 cells by Simvastatin in a four-hour time course with monitoring for cell morphology/health. Taken together, this method provides a medium-to-high throughput platform for concurrently screening the pharmacological activity and cytotoxicity of compounds regulating LDL uptake in live cells.
Protocol
1. Seeding Cells in a 24-well Plate
- Aspirate media off the cells, wash the cells with 5 mL of Dubelco's Phosphate Buffered Saline (dPBS), and aspirate the dPBS. For HepG2 cells in a 100 mm dish, use 1.5 mL of 0.25% Trypsin/EDTA, and for HK2 cells or HCAECs use 1.5 mL of 0.05% Trypsin/EDTA solution to detach the cells.
- Incubate the plate in a 37 °C incubator for 4 minutes or until the cells are detached. Neutralize trypsin after a 4 minute incubation by adding 3 mL of complete media for HepG2 and HK2 or 3 mL of trypsin neutralizing solution, dPBS plus 5% fetal bovine serum (FBS), for HCAEC cells.
- Transfer the cells into 15 mL conical tubes and centrifuge at 250 x g for 5 min, aspirate the media, and re-suspend the cell pellet in complete media.
- Filter the cell suspension gently through a 40 μm mesh strainer to break up cell clumps. Do not wash the cells through the strainer.
- Count the cells and plate them at an optimized density. For example, 5,000 cells per well of HepG2 cells or 10,000 cells per well of HK2 cells or HCAECs in a 24-well plate lead to optimal results.
- Incubate the plate overnight at 37 °C to allow cells to attach.
- The next day, change the cell media to base media for the cell line (without FBS) plus 5% Lipo-Protein Deficient Serum (LPDS) or low (2%) FBS media depending on the treatment (see 1.7). Then, continue incubation for 24 h to starve the cells. Use 500 μL of total media per well in a 24-well plate.
- Treat the cells in one of three ways: Add 10 µg/mL of rPCSK9 (or vehicle) and return the cells to the 37 °C incubator for 1 hour, add 40 µM of Dynasore Hydrate (or vehicle, Dimethyl Sulfoxide) and return the cells to the 37 °C incubator for 10 minutes, or add 1 µM Simvastatin (or vehicle, Dimethyl Sulfoxide) and return the cells to the 37 °C incubator for 12, 18 or 24 hours. Use media with 5% LPDS for rPCSK9 or Dynasore treatments. Use low (2%) FBS media or media with 5% LPDS Simvastatin treatments.
NOTE: Treating the cells with desired compounds may be done at the time of media change for lipoprotein starvation (step 1.6) for long-term experiments, or prior to the analysis for short-term experiments. Alternatively, customized treatment times may be chosen based on the type and the purpose of the experiments. - Next, add 5 µL of pHrodo red-labelled LDL (1 mg/mL stock) to each well to obtain a final concentration of 10 µg/mL. Then, carefully remove any bubbles from the wells.
2. Live Cell Analysis
- Immediately after adding the labelled LDL, place the plate in the live cell analysis system incubator (see Table of Materials) and allow the plate to equilibrate for 15 minutes to reduce condensation in the plate.
- In the meantime, open the software and schedule the scan by adding the vessel holding the plate. Image 16 images per well at 1 hour intervals at 10X for 4 hours using the red and phase channels.
- Create a Plate Map to use for data processing.
- Click on the Properties tab. Choose the Plate Map. Input the cell type and treatments in Compounds tab.
- Click on the Regions tab, select each set of replicates, and save as regions.
3. Set up Analysis Parameters
- Once an experimental run is complete, create an Image Set in the software to train the computer to quantify each parameter included in the counting set.
- In the software, open the plate view, then in the Analysis Job Utilities box choose Create or Add to Image Collection.
- Select New Image Collection, type a name for the image collection, and choose the Red and Phase channels by checking the boxes next to the channels.
- Select 5 more images and add to image collection by adding to the current image collection.
- Create a Processing Definition for the cells. Table 1 includes the parameters for the HepG2, HK2, and HCAE cell processing definitions for this LDL influx protocol.
- In the Analysis Job Utilities box, choose New Processing Definition. Choose the Image Collection named in step 2.1.2 from the drop down menu. Input the parameters for the type of cells from Table 1.
- In the Preview box, use the drop down menu to select Preview All.
- In the Analysis Mask box, check the Confluence Mask and the Red Object Mask boxes to view the area included in the analysis for the processing definition. See Figure 1.
- Scroll through the image collection to ensure the cells and LDL are included in the mask. Select File and Save the Processing Definition.
- Analyze the set of images from the experimental run.
- Open the experiment in plate view. In the Analysis Job Utilities box, choose Launch New Analysis Job. Select the saved Processing Definition.
- Name the analysis job, choose the time range for analysis, and highlight the experimental wells to analyze. Click the Launch button.
4. Analysis and Data Processing
- Once the Analysis Job is complete, export the data:
- Select the completed analysis and press View. In the Utilities menu, choose Metric/Graph Export.
- In the Regions menu, choose All Wells, and in the Group menu, to obtain the mean values for each set of wells as a group choose Replicates and for exporting the individual values for each well choose None.
- In the Red Object metric menu, choose the Total Red Object Integrated Intensity (RCU x µm2/image). This parameter indicates the sum of the red signal intensity (in RCU) times the area of the red signal (in µm2) in all the images across each well, which corresponds to the total LDL uptake by the cells.
- Click the Data Export button. Check Break data down into individual images. The data is automatically copied on a clipboard and can be pasted to a new spreadsheet file.
- In the Phase Object metric menu, choose the Confluence (Percent). Check Break data down into individual images. Click the Data Export button. The data is automatically copied on a clipboard and can be copied to the spreadsheet file containing Total Red Object Integrated Intensity data.
- Apply the conversion of the percent confluence to total area with the following equation.
Total Phase Area (µm2/image) = Confluence (%) × (Image Height (Pixels) × Resolution) × (Image Width (Pixels) × Resolution)
NOTE:The confluence (%) parameter indicates the percent confluence of the phase area per image that corresponds to the area of the cells in each well. This metric should be converted into total phase area for each individual image once exported. The image specifications for phase channel (image height, width and resolution) to be used with the above formula for each experimental vessel can be found by referring to Vessel Properties under Image Channels. - Normalize Total Red Object Integrated Intensity to the Total Phase Area as calculated in 4.1.6 using the following formula for each individual image to eliminate the variability in the cell density across the wells.
- Divide the Total Red Object Integrated Intensity (RCU x µm2/image) values of each image by its corresponding Total Phase Area (µm2/image) to obtain LDL Uptake (RCU) values per image.
- Then, average the LDL Uptake (RCU) data of all images of each well to obtain the average LDL uptake in each well and then average the LDL uptake values of all the replicate wells to obtain group means. These data are the final LDL uptake values and may be used for illustration and statistical analysis using the software of choice.
Results
Live Cell Imaging Allows for Reliable Monitoring of Cell Health During Cholesterol Influx Studies in Three Human Cell Lines
We validated our assay in three human cell lines in which cholesterol homeostasis regulation plays a major pathophysiological role, including human hepatic carcinoma (HepG2) cells, human renal epithelial (HK2) cells, and human coronary artery endothelial cells (HCAECs). We used a live cell imaging system to perform the LDL uptake assay in a 4 h time course with serial measurements at 1 h intervals. Our results indicate that all the cell types tested were compatible with this new technique and result in curves indicating continuous LDL uptake for the duration of the influx study with 4.33 h as the final endpoint (Figure 2). The influx data shown in Figure 2 were obtained by normalizing the total pHrodo Red-labeled LDL fluorescence (total red object integrated intensity per image in RCU x µm2/image) to the total cell area in each image of each well (phase object area per image in µm2/image) to eliminate the variability in the cell density across the wells. Furthermore, to validate the sensitivity of the LDL influx assay for the purpose of screening compounds affecting LDL cholesterol uptake, we used two positive controls known to inhibit LDL influx, Dynasore and rPCSK9, and one positive control known to induce LDL uptake, Simvastatin. As validated by our results, following treatment with Dynasore and rPCSK9, all three tested human cell lines (HepG2, HK2 and HCAEC) showed significant reductions in LDL influx over a 4 h time course (Figure 2A-C). For example, Figure 2A shows that the LDL influx is reduced in HepG2 cells with treatment of Dynasore over the time course, compared to the cells treated with DMSO; while the DMSO as the vehicle control for Dynasore control had no significant effect on LDL influx compared to the untreated control group. Furthermore, our findings showed a marked increase in LDL uptake by HepG2 cells following treatment with Simvastatin (Figure 3), supporting the sensitivity of this method to detect significant alterations in the LDL influx. At about the 4.5 h time point, which is a typical time point in LDL uptake studies, the LDL influx is significantly reduced with either Dynasore or rPCSK9 treatment, and increased by Simvastatin treatment (Figure 4).
A major advantage to using live cell imaging for LDL uptake studies is that this system provides real time images of the cells in each well that could be used to monitor potential cytotoxicity of the examined compounds. Figures 5-7 illustrate representative images of the three cell lines investigated at the initial time point (0.33 h) and final endpoint (4.33 h) as a visual reference for the net LDL influx. The images confirm the normal morphology of the cells following Dynasore or rPCSK9 treatments, indicating both effectiveness and safety of these compounds.
Live Cell Analysis Gives Reliable Serial Quantitative Cholesterol Influx Measurements with Various Treatments
A major advantage of using this protocol with a live cell imaging system is the ability to collect data throughout the time course and compare LDL influx at multiple time points rather than just one final time point as traditionally done.Using this protocol, we are able to calculate the percent reductionin LDL influx at the terminal time point as well as at 1 h intervals throughout the time course. Table 2 summarizes the reduction in LDL influx in three tested human cell lines following 10 min pre-treatment with 40 µM Dynasore or 1 h pre-treatment with 10 µg/mL rPCSK9. At 4.33 h as the final study end point, treatment with Dynasore at 40 µM significantly reduced LDL influx in HepG2 cells, HK2 cells and HCAECs by 53%, 68% and 54%, respectively (Table 2A-C) and treatment with rPCSK9 at 10 µg/mL resulted in 55% reduction in LDL influx in HK2 cells (Table 2B). In addition to quantifying the terminal time point as in traditional assays, we are able to perform a quantitative analysis in the reduction of LDL influx due to treatment at each time point of the experiment. For example, Table 2B shows that treatment with rPCSK9 in HK2 cells resulted in a reduction of LDL uptake by 79% at 1.33 h, 67% at 2.33 h, 59% at 3.33 h post treatment compared to untreated cells. This protocol provides a reliable method for quantitative analysis of LDL influx after treatment.
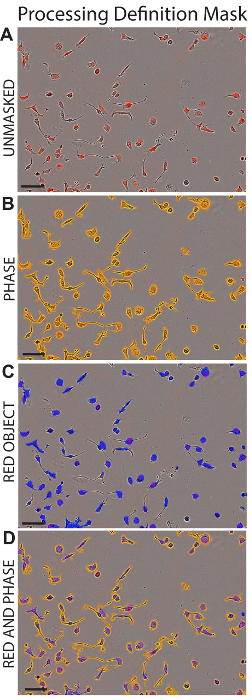
Figure 1: Processing Definition Mask. Representative images of HK2 cells are depicted following the application of the appropriate processing definition (detailed in Table 1). Shown areHK2 cells without masking (A), with Phase Maskapplied (B), with Red Object Mask applied (C), or with both Phase and Red Object masks applied (D). Scale bar = 100 µm. Please click here to view a larger version of this figure.
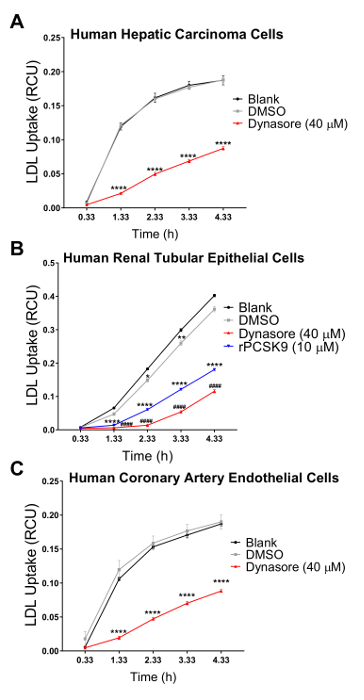
Figure 2: Reduction in LDL uptake using live cell imaging system over a 4.33 h time course. Live cell analysis system is used to measure LDL influx in human hepatic carcinoma (HEPG2) cells (A), human renal tubular epithelial (HK2) cells (B), and human coronary artery endothelial (HCAE) cells (C). The cells were treated with Dynasore (10 min before the run) or rPCSK9 (1 h before the run) as positive controls. DMSO was used as a vehicle for Dynasore treatments. Positive controls significantly decreased the LDL influx in all 3 cell lines. LDL influx values were obtained by normalizing the total red object integrated intensity (RCUxµm2/image) to the total phase object area (µm2/image). Data are mean±SEM. N = 6 wells/group. Data are representative of 2 or 3 independent experiments. ****p < 0.0001 vs blank, and ####p < 0.0001 vs DMSO, using two-way ANOVA. Please click here to view a larger version of this figure.
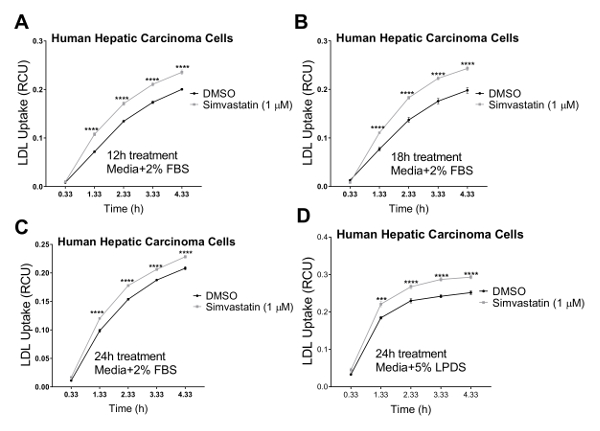
Figure 3. Increase in LDL uptake using live cell imaging system over a 4.33h time course. Live cell analysis system is used to measure LDL influx in human hepatic carcinoma (HEPG2) cells. LDL uptake is significantly increased following treatment with Simvastatin for 12 h (A), 18 h (B), or 24 h (C) using media containing 2% FBS. The 24 h time point was also performed with media containing 5% LPDS (without FBS). DMSO was used as negative control. LDL influx values were obtained by normalizing the total red object integrated intensity (RCU x µm2/image) to the total phase object area (µm2/image). Data are mean±SEM. N = 6 wells/group. Data are representative of one independent experiment. ****p < 0.0001 vs DMSO, using Student's t-test. Please click here to view a larger version of this figure.
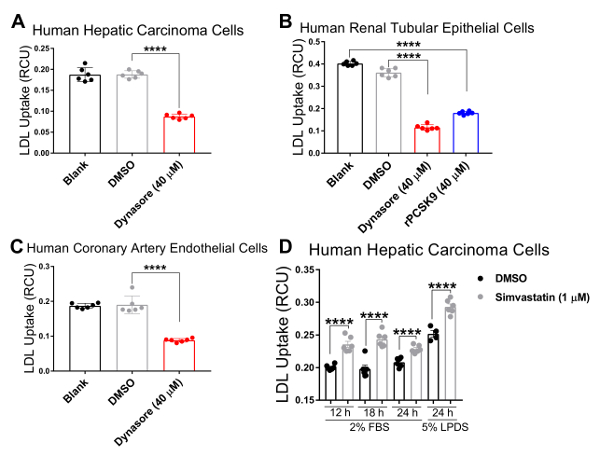
Figure 4. Significant LDL influx reduction by LDL uptake-lowering agents at 4.3 h time point. LDL influx is significantly reduced in human hepatic carcinoma (HepG2) cells (A), human renal tubular epithelial (HK2) cells (B), and human coronary artery endothelial (HCAE) cells (C) following treatment with LDL uptake inhibitors Dynasore for 10 min or rPCSK9 for 1 hour. LDL influx is markedly increased by Simvastatin in HepG2 cells after 12, 18 or 24 h treatments (D). Data are mean±SEM. N = 6 wells/group. Data are representative of 2 or 3 independent experiments. ****p < 0.0001 using two-way ANOVA. Please click here to view a larger version of this figure.

Figure 5. Reduced LDL influx in hepatocellular carcinoma (HepG2) cells by LDL uptake-lowering agent, Dynasore. Representative images of the phase object and red object for HepG2 cells are depicted at 0.33 h (left panels) and the 4.33 h endpoint (right panels) show healthy status of cells. 40 µM Dynasore, known to reduce LDL-cholesterol uptake, was used as positive control (C). Images were taken at 10X magnification. Scale bar = 100 µm. Please click here to view a larger version of this figure.

Figure 6. Reduced LDL influx in human renal tubular epithelial (HK2) cells by LDL uptake-lowering agents, Dynasore and rPCSK9. Representative images of the phase object and red object for HK2 cells depicted at 0.33 h (left panels) and the 4.33 h endpoint (right panels) show healthy status of the cells. 40 µM Dynasore (C), or 10 µg/mL rPCSK9 (D), known to reduce LDL cholesterol uptake, were used as positive control. Images are taken at 10X magnification. Scale bar = 100 µm. Please click here to view a larger version of this figure.

Figure 7. Reduced LDL influx in human coronary artery endothelial cells (HCAECs) by LDL uptake-lowering agent, Dynasore. Representative images of the phase object and red object for HCAECs depicted at 0.33 h (left panels) and the 4.33 h endpoint (right panels) show healthy status of the cells. 40 µM Dynasore, known to reduce LDL-cholesterol uptake, was used as positive control (C). Images were taken at 10X magnification. Scale bar = 100 µm. Data are mean±SEM. N = 6 wells/group. Data are representative of 2 or 3 independent experiments. Please click here to view a larger version of this figure.
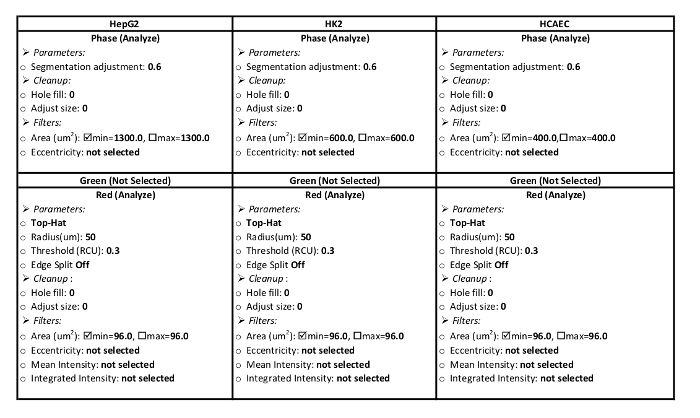
Table 1: Processing Definition Parameters. These parameters are specific for the analysis system used in this protocol. Parameters should be set up to analyze red area in the red channel and the area of the cell in the phase channel. Parameter settings for HepG2, HK2, HCAE cell lines are presented.

Table 2: Percent Change in LDL influx in HepG2, HK2 and HCAE cells treated with Dynasore, rPCSK9, or Simvastatin at 4.3 h. (A) HepG2 cells, (B) HK2 cells, (C) HCAE cells, and (D) HepG2 cells.
Discussion
In the current protocol, we demonstrate the utilization of live cell imaging as a new and more effective method for measuring real time LDL uptake over a time course in various human cell lines. Human hepatic carcinoma (HepG2) cells are commonly used in studies screening for cholesterol-lowering therapeutics21,22,23,24,25,26,39,40. Therefore, we chose this cell type for testing the capability of a live cell imaging system for LDL influx studies. Our results indicate that HepG2 cells are compatible with this new technique and result in a sigmoid-like curve indicating continuous LDL uptake for the duration of the influx assay until 4.33 h as the final endpoint (Figure 2A and Figure 3).
Cholesterol homeostasis plays a major role in the pathophysiology of various nephropathies. Indeed, cholesterol accumulation in renal tissue is a major contributor to renal fibrosis leading to chronic kidney disease and is a major pathology in various nephropathies28,29,30,31. Hence, we examined our method in human renal epithelial (HK2) cells as a popular and reliable cell line utilized in the field of nephrology. Our data also supported the feasibility of the live cell imaging system to measure LDL influx in HK2 cells. As shown in Figure 2B, HK2 cells took up LDL cholesterol linearly throughout the duration of the influx study (4 hours).
Due to the importance of the cholesterol metabolism in the development and progression of atherosclerosis32,33,41, the leading cause of cardiovascular disease, which in turn is the number-one killer worldwide42, we aimed to validate our method in an atherosclerosis-relevant cell type. We used Human Coronary Arterial Endothelial Cells (HCAECs), as these are one of the first cell types to be exposed to a cholesterol insult in the coronary artery lumen of an atherosclerosis patient. Our data shown in Figure 2C indicates that this LDL influx method also works effectively with HCAECs. The resultant graph is a sigmoid-like curve similar to that of HepG2 cells.
To test the validity and sensitivity of this improved LDL influx assay for screening compounds affecting LDL-cholesterol uptake, we used three controls, LDL uptake-lowering agents Dynasore and rPCSK9, and LDL influx activator Simvastatin. Here, we treated the above mentioned cell lines (HepG2, HK2 and HCAECs) with optimized concentrations of Dynasore or rPCSK9 prior to the influx assay. Our results showed that all three tested cell lines responded to the treatments with significant reductions in LDL influx over a 4-hour time course (Figure 2). For instance, at 4.33 h as the final time point, treatment with Dynasore at 40 µM significantly reduced LDL influx in HepG2 cells, HK2 cells and HCAECs by 53%, 68% and 54%, respectively (p<0.0001; Figure 2A-C and Table 2A-C). In addition, rPCSK9 at 10 µg/mL caused a marked 55% reduction in LDL influx in HK2 cells (p<0.0001; Figure 2B and Table 2B). Moreover, our findings showed that treating HepG2 cells with Simvastatin resulted in a marked increase in LDL uptake (Figure 3), supporting the sensitivity of this method to detect significant alterations in the LDL influx. Studies of treatment with rPCSK9 in HepG2 and HCAEC cells are not included in this protocol as rPCSK9 is used as an additional control treatment with well-documented results, but is costly to buy in small quantities. Therefore rPCSK9 was only used to validate this protocol in HK2 cells.
Live cell imaging analysis, along with the functional and timely measurement of LDL influx, allowed for continuous monitoring of the health and morphology of the cells. This advantage can efficiently detect potential cytotoxicity of the applied compounds, making this method an ideal technique for simultaneously monitoring pharmacological activity and cytotoxicity. Figures 5-7 illustrate representative images of the three tested cell lines at the final endpoint (4.33 h) as a visual reference for the effect of the treatments on net LDL influx and also shows the healthy morphology of the cells following the tested treatments. We recommend visual inspection of all the images from each well to assure the heathy morphology of the cells for the duration of the study. For example, in data not shown, when images of HepG2 cells treated with 80 μM Dynasore were inspected, we observed indications of cell detachment as the edges of the cells appeared to be lifting off the plate, suggesting cell detachment at higher concentrations of Dynasore. Furthermore, high concentrations of simvastatin (3-10 μM) also led to altered morphology indicating induced apoptosis as reported for high dosages of statins45. This protocol was used to perform a titration of the Dynasore treatment at 20-80 μM, and Simvastatin at 0.5-10 μM concentration, following which the cell images were used to analyze the health of the cells and determine potential ctotoxicity of the treatments at various concentrations. Results suggested the use of 40 μM for Dyansore and 1 μM for simvastatin as optimal concentrations.
Lastly, we suggest performing a cell density titration study if another cell line is to be tested with this method in order to identify the optimal cell number per well to obtain consistent results. Our cell density optimization study showed that 10,000 cells/well in a 24-well plate lead to consistent LDL influx outcomes for HK2 and HCAE cells. It is important to note that for this LDL influx assay using live cell imaging system, a monolayer of non-confluent cells distributed evenly on the wells is desirable as clumps of cells may give rise to errors in the final normalized LDL influx values. The reason for this is that for the normalization of the influx data, the phase object area is used as a measure of cell density and this parameter can be adversely affected when cell clumps are formed. We observed that HepG2 cells have a tendency to form clumps when seeded at densities higher than 5,000 cells/well causing inconsistent influx results; therefore, we used 5,000 cells per well in a 24-well plate as optimal density for HepG2 cells.
Collectively, our method provides a medium-to-high throughput platform for screening the pharmacological activity and cytotoxicity of compounds regulating LDL influx concurrently. This method can be readily adapted for use with other fluorescently-labeled ligands that enter the lysosomal compartment to evaluate ligand uptake in real time. While this protocol offers specifications for InCucyte live imaging and analysis system, the protocol can be adapted for alternative imaging systems such as Cellomics.
Disclosures
The authors declare that they have no competing financial interests.
Acknowledgements
This work was supported by the following grants to LAS: National Institute of Health (R56HL132209 and 1R01HL140468) and the Miami Heart Research Institute. KY is a recipient of American Heart Association Predoctoral Fellowship (18PRE33960070). HepG2 cells were kindly provided by Dr. Emmanuel Thomas, university of Miami-Miller School of Medicine46,47,48.
Materials
| Name | Company | Catalog Number | Comments |
|---|---|---|---|
| pHrodo Red-LDL | ThermoFisher Scientific | L34356 | |
| HepG2 cells | E. Thomas Lab, U. Miami | HB-8065 | |
| MEM | Sigma | M0325 | |
| Sodium Pyruvate | Sigma | P5280 | |
| L-Glutamine 200 mM solution | Sigma | G7513 | |
| FBS | Atlas Biologicals | FP-0500-A | |
| HK2 cells | ATCC | CRL-2190 | |
| Keratinocyte SFM media kit | Gibco | 17005-042 | |
| Primary Coronary Artery Endothelial Cells | ATCC | PCS-100-020 | |
| Vascular Cell Basal Medium | ATCC | PCS-100-030 | |
| Endothelial Cell Growth Kit-VEGF | ATCC | PCS-100-041 | |
| Human Lipoprotein Deficient Serum | Millipore | LP4 | |
| PBS | Sigma | D8537 | |
| Trypsin-EDTA (0.25%) | Gibco | 25200056 | |
| Trypsin-EDTA (0.05%) | Gemini Bio-Products | 400-150 | |
| Trypsin Neutralizing Solution | ATCC | PCS-999-004 | |
| 24 well plate | Falcon | 353226 | |
| 40 μM mesh cell strainer | VWR | 10199-654 | |
| 15 mL conical tubes | VWR | 89039-666 | |
| 50 mL conical tubes | VWR | 89039-658 | |
| Trypan Blue Staining (0.4%) | Life Technologies | T10282 | |
| Counting Slides | Bio-Rad | 145-0011 | |
| Incucyte Zoom | Sartorius | Zoom | Imaging and analysis platform |
| Dynasore Hydrate | Sigma | D7693 | |
| PCSK9 Recombinant Protein | Cayman Chemicals | 20631 |
References
- Baigent, C., et al. Efficacy and safety of cholesterol-lowering treatment: prospective meta-analysis of data from 90,056 participants in 14 randomised trials of statins. Lancet. 366 (9493), 1267-1278 (2005).
- Trevisan, R., Dodesini, A. R., Lepore, G. Lipids and renal disease. Journal of the American Society of Nephrology. 17 (4), Suppl 2 145-147 (2006).
- Tall, A. R., Yvan-Charvet, L. Cholesterol, inflammation and innate immunity. Nature Reviews Immunology. 15 (2), 104(2015).
- Dedoussis, G. V., Schmidt, H., Genschel, J. LDL-receptor mutations in Europe. Human Mutation. 24 (6), 443-459 (2004).
- Sasaki, K., et al. ATP-binding cassette transporter A subfamily 8 is a sinusoidal efflux transporter for cholesterol and taurocholate in mouse and human liver. Molecular Pharmaceutics. , (2018).
- Storch, J., Xu, Z. Niemann-Pick C2 (NPC2) and intracellular cholesterol trafficking. Biochimica et Biophysica Acta (BBA)-Molecular and Cell Biology of Lipids. 1791 (7), 671-678 (2009).
- Jansen, P. J., et al. Absence of ApoE upregulates murine brain ApoD and ABCA1 levels, but does not affect brain sterol levels, while human ApoE3 and human ApoE4 upregulate brain cholesterol precursor levels. Journal of Alzheimer's Disease. 18 (2), 319-329 (2009).
- Girard, E., et al. The dynamin chemical inhibitor dynasore impairs cholesterol trafficking and sterol-sensitive genes transcription in human HeLa cells and macrophages. PLoS One. 6 (12), 29042(2011).
- Robinet, P., et al. Dynamin is involved in endolysosomal cholesterol delivery to the endoplasmic reticulum: role in cholesterol homeostasis. Traffic. 7 (7), 811-823 (2006).
- Macia, E., et al. Dynasore, a cell-permeable inhibitor of dynamin. Developmental Cell. 10 (6), 839-850 (2006).
- Benjannet, S., et al. NARC-1/PCSK9 and its natural mutants: zymogen cleavage and effects on the LDLR and LDL-cholesterol. Journal of Biological Chemistry. , (2004).
- Qian, Y. -W., et al. Secreted PCSK9 downregulates low density lipoprotein receptor through receptor-mediated endocytosis. Journal of Lipid Research. 48 (7), 1488-1498 (2007).
- Brown, M. S., Goldstein, J. L. A receptor-mediated pathway for cholesterol homeostasis. Science. 232 (4746), 34-47 (1986).
- Goldstein, J. L., Brown, M. S. History of discovery: the LDL receptor. Arteriosclerosis, Thrombosis, and Vascular Biology. 29 (4), 431(2009).
- Stephan, Z. F., Yurachek, E. C. Rapid fluorometric assay of LDL receptor activity by DiI-labeled LDL. Journal of Lipid Research. 34 (2), 325-330 (1993).
- Fisher, T. S., et al. Effects of pH and low density lipoprotein (LDL) on PCSK9-dependent LDL receptor regulation. Journal of Biological Chemistry. 282 (28), 20502-20512 (2007).
- Atrahimovich, D., Khatib, S., Sela, S., Vaya, J., Samson, A. O. Punicalagin induces serum low-density lipoprotein influx to macrophages. Oxidative Medicine and Cellular Longevity. 2016, (2016).
- Xu, M., et al. δ-Tocopherol reduces lipid accumulation in Niemann-Pick type C1 and Wolman cholesterol storage disorders. Journal of Biological Chemistry. 112, (2012).
- Bonilla, D. L., et al. Autophagy regulates phagocytosis by modulating the expression of scavenger receptors. Immunity. 39 (3), 537-547 (2013).
- Guo, M., et al. Apelin-13 Decreases Lipid Storage in Hypertrophic Adipocytes In vitro Through the Upregulation of AQP7 Expression by the PI3K Signaling Pathway. Medical Science Monitor : International Medical Journal of Experimental and Clinical Research. 20, 1345-1352 (2014).
- Guillemot, J., Asselin, M. C., Susan-Resiga, D., Essalmani, R., Seidah, N. G. Deferoxamine stimulates LDLR expression and LDL uptake in HepG2 cells. Molecular Nutrition & Food Research. 60 (3), 600-608 (2016).
- Javitt, N. B. Hep G2 cells as a resource for metabolic studies: lipoprotein, cholesterol, and bile acids. The FASEB Journal. 4 (2), 161-168 (1990).
- Mullen, P. J., Lüscher, B., Scharnagl, H., Krähenbühl, S., Brecht, K. Effect of simvastatin on cholesterol metabolism in C2C12 myotubes and HepG2 cells, and consequences for statin-induced myopathy. Biochemical Pharmacology. 79 (8), 1200-1209 (2010).
- McNutt, M. C., et al. Antagonism of secreted PCSK9 increases low density lipoprotein receptor expression in HepG2 cells. Journal of Biological Chemistry. 284 (16), 10561-10570 (2009).
- Scharnagl, H., et al. Effect of atorvastatin, simvastatin, and lovastatin on the metabolism of cholesterol and triacylglycerides in HepG2 cells. Biochemical Pharmacology. 62 (11), 1545-1555 (2001).
- Scharnagl, H., et al. The effects of lifibrol (K12. 148) on the cholesterol metabolism of cultured cells: evidence for sterol independent stimulation of the LDL receptor pathway. Atherosclerosis. 153 (1), 69-80 (2000).
- Chan, J. C., et al. A proprotein convertase subtilisin/kexin type 9 neutralizing antibody reduces serum cholesterol in mice and nonhuman primates. Proceedings of the National Academy of Sciences. 106 (24), 9820-9825 (2009).
- Ding, W., et al. Osteopontin deficiency ameliorates Alport pathology by preventing tubular metabolic deficits. JCI Insight. 3 (6), (2018).
- Herman-Edelstein, M., Scherzer, P., Tobar, A., Levi, M., Gafter, U. Altered renal lipid metabolism and renal lipid accumulation in human diabetic nephropathy. Journal of Lipid Research. 55 (3), 561-572 (2014).
- Su, H., et al. Lipid Deposition in Kidney Diseases: Interplay Among Redox, Lipid Mediators, and Renal Impairment. Antioxidants & Redox Signaling. 28 (10), 1027-1043 (2018).
- Agrawal, S., Zaritsky, J. J., Fornoni, A., Smoyer, W. E. Dyslipidaemia in nephrotic syndrome: mechanisms and treatment. Nature Reviews Nephrology. 14 (1), 57(2018).
- Babiak, J., Rudel, L. L. Lipoproteins and atherosclerosis. Baillieres Clinical Endocrinology and Metabolism. 1 (3), 515-550 (1987).
- Wang, H. H., Garruti, G., Liu, M., Portincasa, P., Wang, D. Cholesterol and Lipoprotein Metabolism and Atherosclerosis: Recent Advances in Reverse Cholesterol Transport. Annals of Hepatology. 16 (1), 28-42 (2018).
- Preta, G., Cronin, J. G., Sheldon, I. M. Dynasore-not just a dynamin inhibitor. Cell Communication and Signaling. 13 (1), 24(2015).
- Horton, J. D., Cohen, J. C., Hobbs, H. H. Molecular biology of PCSK9: its role in LDL metabolism. Trends in Biochemical Sciences. 32 (2), 71-77 (2007).
- Abifadel, M., et al. Mutations in PCSK9 cause autosomal dominant hypercholesterolemia. Nature Genetics. 34 (2), 154(2003).
- Goldstein, J. L., Brown, M. S. Regulation of the mevalonate pathway. Nature. 343 (6257), 425(1990).
- Dong, B., Wu, M., Cao, A., Li, H., Liu, J. Suppression of Idol expression is an additional mechanism underlying statin-induced up-regulation of hepatic LDL receptor expression. International Journal of Molecular Medicine. 27 (1), 103-110 (2011).
- Song, K. H., Kim, Y. H., Im, A. -R., Kim, Y. H. Black Raspberry Extract Enhances LDL Uptake in HepG2 Cells by Suppressing PCSK9 Expression to Upregulate LDLR Expression. Journal of Medicinal Food. , (2018).
- Chan, J. C., et al. A proprotein convertase subtilisin/kexin type 9 neutralizing antibody reduces serum cholesterol in mice and nonhuman primates. Proceedings of the National Academy of Sciences of the United States of America. 106 (24), 9820-9825 (2009).
- Tabas, I., Williams, K. J., Borén, J. Subendothelial lipoprotein retention as the initiating process in atherosclerosis: update and therapeutic implications. Circulation. 116 (16), 1832-1844 (2007).
- Benjamin, E. J., et al. Heart disease and stroke statistics-2017 update: a report from the American Heart Association. Circulation. 135 (10), 146-603 (2017).
- Brown, M. S., Goldstein, J. L. The SREBP pathway: regulation of cholesterol metabolism by proteolysis of a membrane-bound transcription factor. Cell. 89 (3), 331-340 (1997).
- Horton, J. D., Goldstein, J. L., Brown, M. S. SREBPs: activators of the complete program of cholesterol and fatty acid synthesis in the liver. The Journal of Clinical Investigation. 109 (9), 1125-1131 (2002).
- Tavintharan, S., et al. Reduced mitochondrial coenzyme Q10 levels in HepG2 cells treated with high-dose simvastatin: A possible role in statin-induced hepatotoxicity. Toxicology and Applied Pharmacology. 223 (2), 173-179 (2007).
- Thomas, E., et al. HCV infection induces a unique hepatic innate immune response associated with robust production of type III interferons. Gastroenterology. 142 (4), 978-988 (2012).
- Thomas, E., Liang, T. J. Experimental models of hepatitis B and C-new insights and progress. Nature Reviews Gastroenterology & Hepatology. 13 (6), 362(2016).
- Yoneda, M., et al. Hepatitis B Virus and DNA Stimulation Trigger a Rapid Innate Immune Response through NF-κB. The Journal of Immunology. , 1502677(2016).
Reprints and Permissions
