This protocol describes a fluorescence fluctuation spectroscopy-based approach to investigate interactions among proteins mediating cell-cell interactions, i.e. proteins localized in cell junctions, directly in living cells. We provide detailed guidelines on instrument calibration, data acquisition and analysis, including corrections to possible artefact sources.
A subscription to JoVE is required to view this content. Sign in or start your free trial.
Method Article
A Fluorescence Fluctuation Spectroscopy Assay of Protein-Protein Interactions at Cell-Cell Contacts
In This Article
Summary
Abstract
A variety of biological processes involves cell-cell interactions, typically mediated by proteins that interact at the interface between neighboring cells. Of interest, only few assays are capable of specifically probing such interactions directly in living cells. Here, we present an assay to measure the binding of proteins expressed at the surfaces of neighboring cells, at cell-cell contacts. This assay consists of two steps: mixing of cells expressing the proteins of interest fused to different fluorescent proteins, followed by fluorescence fluctuation spectroscopy measurements at cell-cell contacts using a confocal laser scanning microscope. We demonstrate the feasibility of this assay in a biologically relevant context by measuring the interactions of the amyloid precursor-like protein 1 (APLP1) across cell-cell junctions. We provide detailed protocols on the data acquisition using fluorescence-based techniques (scanning fluorescence cross-correlation spectroscopy, cross-correlation number and brightness analysis) and the required instrument calibrations. Further, we discuss critical steps in the data analysis and how to identify and correct external, spurious signal variations, such as those due to photobleaching or cell movement.
In general, the presented assay is applicable to any homo- or heterotypic protein-protein interaction at cell-cell contacts, between cells of the same or different types and can be implemented on a commercial confocal laser scanning microscope. An important requirement is the stability of the system, which needs to be sufficient to probe diffusive dynamics of the proteins of interest over several minutes.
Introduction
Many biological processes occur at the sites of cell-cell interactions, e.g., cell-cell adhesion1,2,3, cell-cell fusion4 and cellular recognition5. Such events are particularly important during the development of multicellular organisms and for cell-cell communication, e.g., during immune responses. These processes are typically mediated by proteins that are localized at the surface, i.e., at the plasma membrane (PM) of neighboring cells and undergo specific interactions at the cell-cell contact that are precisely regulated in space and time. In many cases, these interactions are direct homo- or heterotypic protein-protein trans interactions, but may also involve ions or ligands acting as extracellular linkers1. Although of fundamental importance, there is a lack of assays probing these specific protein-protein interactions directly in the native environment of living cells. Many methods either require cell disruption (e.g., biochemical assays such as co-immunoprecipitation6), fixation (e.g., some of the super-resolution optical microscopy techniques and electron microscopy of cell-cell contacts7), or are non-specific, e.g., aggregation/ adhesion assays8,9. To overcome this issue, fluorescence techniques have been implemented based on fluorescence resonance energy transfer (FRET)10 or fluorescence complementation11. However, to achieve sufficiently small distances between fluorophores, these methods require fluorescent labels on the extracellular side of the proteins10, potentially interfering with trans interactions.
Here, we present an alternative fluorescence-based assay for protein-protein interactions at cell-cell contacts. This approach combines fluorescence cross-correlation approaches (scanning fluorescence cross-correlation spectroscopy (sFCCS), cross-correlation number and brightness (ccN&B)) and mixing of cells expressing a fusion construct of the protein of interest, e.g., an adhesion receptor. The investigated receptors in the two interacting cells are labeled with two spectrally separated fluorescent proteins (FPs), from the intracellular side (see Figure 1A).
The employed methods are based on the statistical analysis of fluorescence fluctuations induced by the diffusive motion of fluorescent fusion proteins through the focal volume of a confocal laser scanning microscope. More in detail, the assay probes the co-diffusion of the proteins of interest in both neighboring PMs at cell-cell contacts. If the proteins undergo trans interactions, these trans complexes will carry fluorescent proteins emitting in both spectral channels, causing correlated fluorescence fluctuations of both emitters. On the other hand, if no binding occurs, the number fluctuations of proteins in facing PMs will be independent, causing no correlated fluctuations. The acquisition can be performed in two ways: 1) sFCCS is based on a line-shaped scan across the cell-cell contact and effectively probes the interactions in a spot located in the contact region. Through a temporal analysis of fluorescence fluctuations, sFCCS provides also dynamics information, i.e., the diffusion coefficients of protein complexes; 2) ccN&B is based on a pixel-wise analysis of a sequence of images acquired at the cell-cell contact regions. It has capability to probe and map interactions along the whole contact region (in one focal plane), but does not provide information on dynamics. Both methods can be combined with an analysis of the molecular brightness, i.e., the average fluorescence signal emitted in the time unit by single diffusing protein complexes and, thus, provide estimates of the stoichiometry of protein complexes at cell-cell contacts.
In this article, we provide detailed protocols for sample preparation, instrument calibration, data acquisition and analysis to perform the presented assay on a commercial confocal laser scanning microscope. The experiments can be performed on any instrument equipped with photon counting or analog detectors and an objective with high numerical aperture. We further discuss critical steps of the protocol and provide correction schemes for several processes causing artefactual signal fluctuations, e.g., detector noise, photobleaching or cell movement. Originally developed to probe interactions between adherent cells, the assay may be modified for suspension cells, or adapted to model membrane systems, e.g., giant unilamellar vesicles (GUVs) or giant plasma membrane vesicles (GPMVs), allowing the quantification of interactions in different lipid environments or in the absence of an organized cytoskeleton12,13.
Scanning fluorescence cross-correlation spectroscopy is a modified version of fluorescence cross-correlation spectroscopy14 and was specifically designed to probe slow diffusive dynamics in lipid membranes15. It is based on a line scan acquisition perpendicular to the PM containing the fluorescent proteins of interest. To probe interactions of two differently labeled protein species, the acquisition is performed in two spectral channels using two laser lines and two detection windows for spectrally separated fluorophores. Due to the slow diffusion dynamics of proteins in the PM (D≤~1 µm2/s), a cross-talk-free measurement can be performed by alternating the excitation scheme from line to line15. The analysis starts with: 1) an alignment algorithm correcting for lateral cell movement based on block-wise averaging of ~1000 lines, 2) determination of the position with maximum fluorescence signal, i.e., the PM position, in each block and 3) shifting of all blocks to a common origin12,15, separately in each channel. Then, an automatic selection of pixels corresponding to the PM is performed by selecting the central region from a Gaussian fit of the sum of all aligned lines (i.e., center ± 2.5σ). Integration of the signal in each line yields the membrane fluorescence time series F(t) in each channel (g = green channel, r = red channel). Note that the pixel size has to be small enough, e.g., <200 nm, to reconstruct the shape of the point spread function and find its center, corresponding to the position of the PM. In the presence of substantial photobleaching, the fluorescence time series in each channel may be modeled with a double-exponential function and then corrected with the following formula:16
 . (1)
. (1)
It is important to note that this formula effectively corrects both the amplitudes and diffusion times obtained from correlation analysis of F(t)c, compared to parameter estimates that would be obtained from the uncorrected F(t). Then, the auto- and cross-correlation functions (ACFs/ CCFs) of the fluorescence signals are calculated:
 , (2)
, (2)
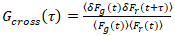 , (3)
, (3)
where δFi = Fi(t) -  Fi(t)
Fi(t) and i = g,r.
A two-dimensional diffusion model is then fitted to all correlation functions (CFs):
 . (4)
. (4)
Here, N denotes the number of fluorescent proteins in the observation volume and τd the diffusion time for each channel. This model takes into account that in the described experimental setting, diffusion of proteins in the PM occurs in the x-z plane, in contrast to the commonly used configuration of fluorescence correlation spectroscopy (FCS) experiments on membranes probing diffusion in the x-y plane of the confocal volume17. The waist w0 and the structure factor S, describing the elongation wz of the focal volume in z, S = wz/w0, are obtained from a point FCS calibration measurement performed with spectrally similar dyes and same optical settings using already available values for the diffusion coefficient Ddye:
 , (5)
, (5)
where τd,dye is the measured average diffusion time of the dye molecules, obtained from fitting a model for three-dimensional diffusion to the data, taking into account transitions of a fraction T of all N molecules to a triplet state with a time constant ττ:
 . (6)
. (6)
Finally, diffusion coefficients (D), molecular brightness values (ε) and the relative cross-correlation of sFCCS data (rel.cc.) are calculated as follows:
 , (7)
, (7)
 , (8)
, (8)
 , (9)
, (9)
where Gcross(0) is the amplitude of the cross-correlation function and  is the amplitude of the autocorrelation function in the i-th channel.
This definition of the relative cross-correlation, i.e. using max instead of mean in Equation 9, takes into account that the maximum number of complexes of two protein species present at different concentrations is limited by the species present in a lower number.
Cross-correlation number and brightness is based on a moment analysis of the fluorescence intensity for each pixel of an image stack acquired over time at a fixed position in the sample, typically consisting of ~100-200 frames, with two spectral channels (g = green channel, r = red channel). From the temporal mean Ii and variance  , the molecular brightness εi and number ni are calculated in each pixel and spectral channel (i = g, r)18:
 , (10)
 . (11)
It is important to note that the given equations apply to the ideal case of a true photon-counting detector. For analog detection systems, the following equations apply19,20:
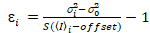 , (12)
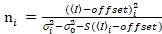 . (13)
Here, S is the conversion factor between detected photons and the recorded digital counts,  is the readout noise and offset refers to the detector intensity offset. Generally, these quantities should be calibrated, for any detector type, based on measuring the detector variance as a function of intensity for steady illumination19, e.g., a reflective metal surface or dried dye solution. The offset can be determined by measuring the count rate for a sample without excitation light. By performing a linear regression of the detector-associated variance
  versus intensity (I) plot, S and can be determined19:
 . (14)
Finally, the cross-correlation brightness is calculated in each pixel and is defined in general as21
 , (15)
where  is the cross-variance
  .
.
In order to filter long-lived fluctuations, all ccN&B calculations are performed following a boxcar filtering, independently for each pixel22. Briefly, ni, εi (i = g, r) and Bcc are calculated in sliding segments of e.g., 8-15 frames. The values thus obtained can be then averaged to obtain the final pixel number and brightness values.
Stoichiometry analysis
In order to estimate the stoichiometry of protein complexes at cell-cell contacts, the molecular brightness can be separately analyzed in each spectral channel for the sFCCS or ccN&B data. In sFCCS, one brightness value is obtained per measurement in each channel. In ccN&B, a brightness histogram of all pixels corresponding to the cell-cell contact is obtained and the average (or median) value can be used as representative brightness for the measurement. By performing the same analysis on a monomeric reference, all brightness values can be normalized to directly obtain the average oligomeric state of the detected protein complexes. At this point, it is important to correct for the presence of non-fluorescent FPs that may result in an underestimation of the oligomeric state. This is typically performed by measuring the brightness of a homo-dimeric reference protein23,24 using one-color sFCS or number and brightness (N&B).
Access restricted. Please log in or start a trial to view this content.
Protocol
1. Sample Preparation: Cell-Cell Mixing Assay
NOTE: The following protocol describes the mixing procedure for adherent cells. It may be modified for cells cultured in suspension.
- Seed an appropriate number of cells on a 6-well plate, e.g., 800,000 HEK 293T cells (counted with a Neubauer counting chamber), a day before transfection. The number can be modified depending on the time between seeding and transfection and adjusted for other cell types. To perform a basic experiment (i.e., proteins of interest and negative control), prepare at least 4 wells. Culture cells at 37 °C, 5% CO2 in Dulbecco's Modified Eagle Medium (DMEM) medium, supplemented with fetal bovine serum (10%) and L-glutamine (1%).
- Transfect cells according to the manufacturer's instructions (see the Table of Materials).
- To perform a basic experiment, transfect, in separate wells, plasmids for the protein of interest fused to a 'green' (e.g., monomeric enhanced green fluorescent protein (mEGFP), or yellow fluorescent protein (mEYFP)) or 'red' (e.g., mCherry, or mCardinal) fluorescent protein.
NOTE: In this protocol, we focus on APLP1-mEYFP and APLP1-mCardinal12, and the corresponding negative control, e.g., myristoylated-palmitoylated-mEYFP (myr-palm-mEYFP) and -mCardinal (myr-palm-mCardinal)12. Generally, 200 ng - 1 µg of plasmid DNA are sufficient. High transfection efficiency increases the chance to find 'red' and 'green' cells in contact. Modify the amount of plasmid and transfection reagent to optimize transfection efficiency. Critical: Cell confluency should be around 70% when transfecting the cells. If cells are over-confluent, the transfection efficiency will decrease. If cells are not confluent enough, transfection and mixing may induce stress and prevent many cells from proper attachment after mixing.
- To perform a basic experiment, transfect, in separate wells, plasmids for the protein of interest fused to a 'green' (e.g., monomeric enhanced green fluorescent protein (mEGFP), or yellow fluorescent protein (mEYFP)) or 'red' (e.g., mCherry, or mCardinal) fluorescent protein.
- Perform cell mixing ~4 ± 2 h after transfection.
- Remove growth medium and wash each well gently with 1 mL PBS supplemented with Mg2+ and Ca2+. Then, remove the PBS. (Critical) Drop PBS on well edge to prevent detachment of cells during washing.
- Add ~50 µL trypsin ethylenediaminetetraacetic acid (EDTA) solution drop-wise to each well to facilitate detachment of cells. Incubate at 37 °C for 2 min. Afterwards, slowly shake the 6-well plate laterally to detach the cells.
NOTE: Extended incubation times may be required for some cell types. - Add 950 µL of growth medium to each well and resuspend cells by pipetting a few times up and down, thereby detaching all cells from the well bottom. (Critical) Ensure that cells are resuspended properly and detached from each other by visually checking for the absence of large cell aggregates after resuspension. Otherwise many 'red'-'red' or 'green'-'green' contacts will be obtained after mixing.
- Transfer the cell solution of one well (protein of interest or negative control) to the corresponding well, i.e., 'red' (e.g., APLP1-mCardinal transfected) to 'green' (e.g., APLP1-mEYFP transfected) cells. Mix by gently pipetting a few times up and down. Then, seed the mixed cells on 35-mm glass bottom dishes (1 mL of mixed cell solution per dish, plus 1 mL of growth medium) and culture seeded cells for another day at 37 °C, 5% CO2.
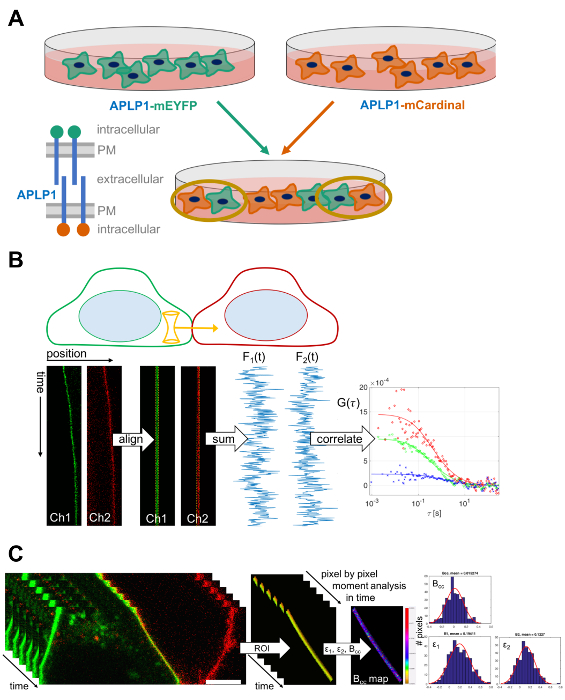
Figure 1. Experimental workflow and schematic representation of scanning fluorescence cross-correlation spectroscopy and cross-correlation number and brightness analysis at cell-cell contacts. (A) Scheme of sample preparation: Two cell populations transfected with the protein of interest (e.g., APLP1) fused to two spectrally distinct fluorescent proteins (e.g., mEYFP and mCardinal) are mixed after transfection. Contacts of differently transfected cells are selected in the microscopy experiments. To avoid interference with extracellular binding domains, the fluorescent protein should be fused to the intracellular terminus of the protein of interest. (B) Scanning FCCS (sFCCS) measurements are performed perpendicular to the cell-cell contact in two spectral channels (channel 1, green and channel 2, red). Scan lines (represented as kymographs) are aligned and membrane pixels summed. Then, ACFs and CCFs are calculated from the intensity traces Fi(t). ACFs are represented in red and green. CCF is represented in blue. (C) Cross-correlation N&B (ccN&B) acquisition results in a three-dimensional (x-y-time) image stack. A ROI is selected around the cell-cell contact. Then channel and cross-correlation brightness (ε1, ε2, and Bcc) values are calculated in each cell-cell contact pixel. The results are then visualized as histograms, pooling all selected pixels. Please click here to view a larger version of this figure.
2. Sample Preparation: Positive Control for Cross-Correlation Experiments and Homo-Dimer Construct for Brightness Analysis
- Seed 600,000 HEK 293T cells, counted with a cell counting chamber, on 35-mm glass bottom dishes one day before transfection. Culture the cells at 37 °C, 5% CO2 in complete DMEM medium (see step 1.1) for another day.
- Transfect cells with ~250 ng of plasmid DNA according to manufacturer instructions. For the positive cross-correlation control, use a plasmid encoding a membrane-anchored fluorescent protein hetero-dimer, e.g., myr-palm-mCherry-mEGFP or myr-palm-mCardinal-mEYFP12 corresponding to the FPs of the protein of interest. For brightness calibration, use plasmids encoding both a membrane-anchored FP monomer and homo-dimer corresponding to the FPs fused to the protein of interest , e.g., myr-palm-mEYFP and myr-palm-mEYFP-mEYFP to calibrate the brightness analysis of APLP1-mEYFP12.
- Culture cells at 37 °C, 5% CO2 in complete DMEM medium (see step 1.1) for another day .
3. Confocal Laser Scanning Microscopy: Setup and Focal Volume Calibration
NOTE: The following protocol is written for experiments performed with mEGFP/mEYFP and mCherry/mCardinal on the laser scanning confocal microscope used in this study. The optical setup, the software settings (laser lines, dichroic mirrors, filters) and choice of calibration dyes may be modified for other FPs and microscope setups.
- Turn on the microscope and lasers at least an hour before the experiment to ensure laser stability and equilibration of temperature.
- Prepare 100-200 µL of appropriate water-soluble fluorescent dye solutions (see the Table of Materials for examples) in water or PBS to calibrate the focal volume, with concentrations in the 10-50 nM range.
- Place the dye solutions on a clean 35-mm glass bottom dish #1.5, i.e., having a thickness of 0.16-0.19 mm.
NOTE: Ideally, use dishes with high performance cover glass having a low thickness tolerance, e.g., 0.170 ± 0.005 mm, allowing an optimal collar ring correction (step 3.6). It is important to use the same type of dish as used later for the following experiments. - Place the dish containing the dye solution directly on the objective (preferably, water immersion, with NA 1.2) to ensure focusing into the solution. Alternatively, place the dish on the sample holder and focus into the sample (e.g., 10-20 µm above the bottom of the dish).
NOTE: We do not recommend using oil objectives due to the poor signal obtained when focusing deep into aqueous samples. - Set up the excitation and emission path, e.g., choose the 488 nm laser, a 488/561 nm dichroic mirror, detection window 499-552 nm and a pinhole size of 1 Airy unit (AU). Make sure that the pinhole size is the same as the one that will be used in cross-correlation measurements.
- Adjust pinhole position (pinhole adjustment) and the objective collar ring to maximize count rate. To this aim, turn collar ring until maximum count rate is detected.
NOTE: The collar ring correction accounts for the specific thickness of the cover glass used. Maximizing the count rate, i.e., collecting as many photons per molecule as possible, is crucial to maximize the signal-to-noise ratio (SNR) of the measurements. - Perform a series of point FCS measurements (e.g., 6 measurements at different locations, each consisting of 15 repetitions of 10 s, i.e., 2.5 min total time, sampled with 1 µs dwell time or less) at the same laser power as used in cross-correlation measurements (typically ~1%, i.e., ~1-2 µW).
- Fit a three-dimensional diffusion model including a triplet contribution (Equation 6) to the data.
NOTE: Typically, the obtained diffusion times are around 30 µs and the structure factor is around 4-8. - Calculate the waist w0 from the measured average diffusion time and published values for the diffusion coefficient of the used dye at room temperature25 according to Equation 5. Typical values are 200-250 nm.
- Repeat the calibration routine (steps 3.4-3.9) with a different fluorescent dye for a second detection channel if needed (e.g., 561 nm excitation and detection between 570 nm and 695 nm). Keep the pinhole position and size as it was set for the first detection channel.
- Calculate the molecular brightness (Equation 8) from the calibration measurements, and store the obtained values.
NOTE: Typical values for the used setup are ~8-10 kHz/molecule (MOL) for 1.8 µW 488 nm excitation power. Lower than usual values might indicate dirt on the objective, misalignment of the setup or a reduced laser output. Check and store laser output powers at the objective regularly using a power meter. For comparison of different setups, molecular brightness normalized by the excitation laser power is the most meaningful parameter to assess microscope performance.
4. Scanning Fluorescence Cross-Correlation Spectroscopy: Acquisition
NOTE: The following protocol is written for experiments performed with mEGFP/mEYFP ('green') and mCherry/mCardinal ('red') on the laser scanning confocal microscope used in this study. The optical setup and the software settings (laser lines, dichroic mirrors, filters) may be different for other FPs or microscope setups.
- Set up the optical path, e.g., 488 nm and 561 nm excitation and a 488/561 nm dichroic mirror, pinhole on 1 AU for 488 nm excitation. To avoid spectral cross-talk, select two separate tracks to excite and detect mEGFP/mEYFP (488 nm excitation, green channel) and mCherry/ mCardinal (561 nm excitation, red channel) sequentially and select switch tracks every line. For the detection, use appropriate filters for both channels, e.g., 499-552 nm in the green channel and 570-695 nm in the red channel.
- If alternated excitation is not possible, use appropriate filter settings for the red channel to minimize spectral cross-talk (i.e. detect mCherry/mCardinal fluorescence not below 600 nm). This may reduce the amount of photons detected in the red channel and thus reduce the SNR.
- Place the dish containing the mixed cells on the sample holder. Wait at least 10 min to ensure temperature equilibration and to reduce focus drift.
- Focus on the cells using transmission light in the Locate menu.
- Search for a pair of a 'red' and a 'green' cell in contact with each other. For the positive cross-correlation or homo-dimer brightness control (see section 2), search for an isolated cell emitting fluorescence in both channels or the respective homo-dimer signal at the PM.
NOTE: (Critical) Minimize sample exposure while searching for cells to avoid pre-bleaching, which may reduce the cross-correlation26. Therefore, scan at the fastest scan speed and low laser powers. To avoid detector saturation while imaging strongly expressing cells, search in integration mode. However, to minimize exposure, scanning at lower laser powers is possible in photon counting mode. - Select a scan path perpendicular to cell-cell contact (or to PM of a single cell for the positive cross-correlation or homo-dimer brightness control) using the Crop button as depicted in Figures 1B and 2A.
NOTE: Some older microscopes do not allow arbitrary scan directions. In this case, cell-cell contacts with an orientation perpendicular to the scan direction have to be located. - Zoom to achieve a pixel size of 50-200 nm and select Line in Scan Mode. Set Frame Size to 128 × 1 pixels.
NOTE: Typical pixel size is 160 nm, corresponding to a scan length of around 20 µm. - Set Scan speed to the maximum allowed value, e.g., 472.73 µs per line.
NOTE: For an alternate excitation scheme, this corresponds to 954.45 µs scan time, i.e. ~1000 scans/s on the setup used. The scan speed may be adjusted depending on the diffusion coefficient of the protein of interest. For membrane-anchored proteins, typical diffusion times are around 10-20 ms. The scan time should be at least ten times smaller than the diffusion times. Lower scan speeds may induce stronger photobleaching and require lower illumination powers. Alternatively, one can impose a pause, e.g., 5 ms, in between each scan for very slowly diffusing complexes using Interval in the Time Series submenu. - Choose the appropriate laser powers, e.g., ~1-2 µW for 488 nm and ~5-10 µW for 561 nm excitation.
NOTE: Higher laser powers improve SNR, but increase photobleaching. Therefore, laser powers should be chosen such that photobleaching is less than 50% of the initial count rate. - Set Cycles to 100,000-500,000.
NOTE: The number of scans, i.e., duration of the measurement, may vary: Longer measurement times will improve SNR and may be more appropriate for slowly diffusing molecules, however, motion of the cells and photobleaching limit the maximal measurement time. Data presented here were routinely acquired for ~3-6 min, i.e., 200,000-400,000 line scans. - Set detectors to Photon counting mode. Press Start Experiment to start the acquisition. Repeat steps 4.5-4.11 to measure another cell.
NOTE: It is recommended to measure 10-15 cells per sample at different expression levels. (Critical) Avoid detector saturation at high expression levels. The maximum count rate should not exceed ~1 MHz. - If brightness analysis is carried out to determine oligomeric states, perform homo-dimer brightness calibration measurements according to modified steps 4.1-4.11: Measure each fluorescent protein homo-dimer separately (in isolated cells, prepared using protocol section 2) and perform measurements only in one spectral channel.
5. Scanning Fluorescence Cross-Correlation Spectroscopy: Data Analysis
NOTE: The following protocol follows an implementation of the analysis procedure described in detail in previous articles12,15. The software code is available upon request to the authors.
- Export the raw data (e.g., CZI) files to an RGB TIFF image in raw data format. This file will contain a kymograph with the green and red channel data, in the channel termed G and R of the image, respectively.
- Import the TIFF file with the appropriate analysis software and proceed to perform the analysis.
NOTE: The following steps (steps 5.3-5.7) are applied separately to each channel: - Align the lines by performing a segment-wise or moving time average with blocks of 500-1000 lines. Determine the membrane position, i.e., the pixel position with the maximum count rate, in each block. Shift all blocks to the same lateral position. This procedure corrects for lateral displacement of the cell-cell contact, e.g., due to cell movement.
- Sum up all aligned lines along the time axis and fit the average intensity profile using a Gaussian function. In the presence of significant intracellular background, use a Gaussian plus a sigmoid function. Define the pixels corresponding to the membrane as all pixels within ±2.5σ of the membrane position and sum up the intensity of these pixels in each line, obtaining a single fluorescence signal value for each time point (i.e., for each line scan).
- If needed (e.g., background >10% of the membrane signal), apply a background correction by subtracting the average pixel intensity in the cytoplasm multiplied by 2.5σ (in pixel units) from the membrane fluorescence, in blocks of 1000 lines. Avoid bright intracellular vesicles when selecting background pixels.
- If photobleaching is observed, apply a bleaching correction. Therefore, fit the membrane fluorescence time series with a double-exponential function and apply the appropriate correction formula, Equation 116.
NOTE: Alternatively, Fourier spectrum based correction schemes may be applied27. (Critical) If photobleaching is present but not corrected for, the CFs may be severely distorted and parameter estimates may be strongly biased (e.g., see Figure 5E). - Calculate the ACFs and CCFs according to Equations 2 and 3 using, e.g., a multiple-tau algorithm28. To improve the reliability of the analysis and avoid artefacts, perform the calculations for 10-20 equal segments of the total measurement. Inspect the fluorescence time series and CFs in each segment and remove clearly distorted segments (see examples in Figure 4A- 4D). Average all non-distorted segments.
NOTE: This procedure can be automated to avoid a subjective bias to the data29. For very unstable measurements having many short segments may be helpful. However, the length of a segment should still be at least three orders of magnitude above the diffusion time to avoid statistical undersampling errors29,30,17. - Fit a two-dimensional diffusion model, Equation 4, to the obtained CFs. Therefore, fix the structure factor to the value obtained in calibration measurement (Protocol section 3). The accuracy of the fit can be improved by performing a weighted fit using the statistical weights of each data point obtained from the multiple tau algorithm.
- Calculate the diffusion coefficient using the calibrated waist according to Equation 7.
- Calculate the molecular brightness by dividing the average fluorescence intensity in each channel by the corresponding number of particles, Equation 8. Normalize the determined brightness value in each channel by the average brightness of the corresponding monomeric reference to obtain the oligomeric state, taking into account non-fluorescent FPs23. To this aim, determine average homo-dimer brightness values from one-color analysis to calculate the fraction of non-fluorescent FPs23.
- Calculate the relative cross-correlation according to Equation 9.
6. Cross-Correlation Number and Brightness: Detector Calibration
NOTE: The following protocol provides a general guideline regarding how to calibrate the detection system. This procedure is mandatory for analog detection systems, but is not strictly needed when true photon counting detectors are used.
- Dry appropriate water-soluble dye solutions (see Table of Materials for examples) on a 35-mm glass bottom dish. Set the optical path accordingly, i.e., 488 or 561 nm excitation and detection at 499-552 nm or 570-695 nm, respectively.
NOTE: Alternatively, a reflective metal surface can be used instead of dried dye solutions by placing the metal piece directly on top of the objective. - Perform one-color N&B measurements in regions with different dye concentrations or at different laser powers. Therefore, use Zoom to achieve a pixel size of 300 nm, Scan speed to set appropriate pixel dwell time, e.g., 25 µs and set Cycles to 100-200 frames.
- Set detectors to photon counting (or analog mode if measurements are performed with analog detection) and press Start Experiment to start the acquisition. Perform measurement at zero excitation power to determine the intensity offset.
- Plot pixel variance as a function of pixel intensity for all measured pixels and perform a linear fit of these data. Determine S as the slope of the linear fit. Calculate the readout noise from the y-intercept, using S and the determined intensity offset according to Equation 14.
7. Cross-Correlation Number and Brightness: Acquisition
- Follow steps 4.1-4.4 of the sFCCS acquisition protocol.
- Use Crop to select a frame of 512 × 128 pixels around a cell-cell contact (or isolated PM for homo-dimer brightness control) and Zoom to achieve a pixel size of 50-100 nm.
- Use Scan speed to set appropriate pixel dwell time, e.g., 6.3 µs.
NOTE: In N&B, the pixel dwell time should be much smaller than the diffusion time of the protein of interest. If an alternate excitation scheme is chosen, e.g., switching tracks every line, the time between the two tracks should be smaller than the diffusion time of the protein of interest. Otherwise the detectable cross-correlation is reduced. - Set Cycles to 100-200 frames.
NOTE: A higher frame number will improve the SNR, however, cell movement may limit the total measurement time. The scan time per frame should be much higher than the diffusion time of the protein of interest. Otherwise the apparent brightness is reduced, i.e., particles appear to be immobile. For very slowly diffusing complexes, impose a pause, e.g., 2 s, in between frames using Interval in the Time Series submenu. - Set laser powers to appropriate values (typical values are ~1-2 µW for 488 nm and ~5-10 µW for 561 nm excitation).
NOTE: Higher laser power leads to higher brightness and improved SNR, but also enhanced photobleaching. Laser powers should be high enough to achieve a detected brightness of at least ~1 kHz/MOL but kept low enough to avoid more than 10-20% photobleaching. For mEGFP/mEYFP or mCherry/mCardinal, less than 10% photobleaching are usually obtained. - Set detectors to photon counting (or analog mode if measurements are performed with analog detection). Press Start Experiment to start the acquisition.
- Evaluate the photon count rate. If count rates in cell-cell contact pixels exceed 1 MHz, reduce the laser power or select cells with lower expression levels. Repeat the steps 7.2-7.7. to measure the next pair of cells. It is recommended to measure 10-15 cells per experiment at different expression levels.
- If brightness analysis is performed to quantify oligomerization, perform homo-dimer brightness calibration measurements according to modified steps 7.1-7.7: Measure each fluorescent protein homo-dimer separately (in isolated cells, prepared using protocol section 2) and perform measurements only in one spectral channel.
8. Cross-correlation Number and Brightness: Data Analysis
NOTE: The following protocol follows a previously described analysis procedure12,31. The software code is available from the authors upon request.
- Import the raw data (e.g., CZI files can be imported using the Bioformats32 package). Average all frames and select a region of interest (ROI) around the cell-cell contact.
- Perform an image alignment algorithm33, e.g., by maximizing the spatial correlation between ROIs in subsequent frames for arbitrary lateral translations, averaged over both channels. This procedure will correct for lateral movement of the cells.
- Apply a boxcar filter22 to reduce extraneous long-lived fluctuations, originating from, e.g., residual cell movement or background bleaching. Alternatively, a detrending method may be applied to correct for photobleaching34.
NOTE: If no segment-wise analysis or detrending is applied, the apparent brightness may be largely overestimated.- Define sliding segments of, e.g., 8 to 15 frames (e.g., frames 1 to 8, 2 to 9 and so forth) and calculate the channel and cross-correlation brightness values according to Equations 10, 11 and 15 pixel-wise in each segment. If detectors are not true photon counting detectors, take the calibrated detector parameters into account when calculating the brightness, i.e., use Equations 12 and 13 instead.
NOTE: Calculating the brightness values in segments of 8 to 15 frames leads to a 10-20% underestimation of the absolute brightness and a 10-20% overestimation of particle numbers. Nevertheless, brightness ratios (e.g., dimer to monomer brightness) are not affected, as long as the segment length is kept constant throughout the analysis (data not shown). The statistical error for a given segment length can be determined via simulations and thus corrected for. - Average the obtained brightness values pixel-wise over all segments. In this step, one may remove the highest and lowest 5% of segment brightness values from the average or exclude segments which show a clear distortion in the intensity, due to, e.g., an intracellular vesicle or aggregate transiently present in these pixels.
- Define sliding segments of, e.g., 8 to 15 frames (e.g., frames 1 to 8, 2 to 9 and so forth) and calculate the channel and cross-correlation brightness values according to Equations 10, 11 and 15 pixel-wise in each segment. If detectors are not true photon counting detectors, take the calibrated detector parameters into account when calculating the brightness, i.e., use Equations 12 and 13 instead.
- Plot the pixel brightness values as a function of the pixel intensity and select the population of pixels that corresponds to the cell-cell contact. Background pixels will have very low intensity values. At this point, re-evaluate the maximum count rate. Exclude pixels with count rates above 1 MHz to prevent pile-up effects.
- Create channel and cross-correlation brightness histograms of selected cell-cell contact pixels and obtain the ROI-averaged brightness values. Normalize the average channel brightness value by the average brightness of the corresponding monomeric reference to obtain the oligomeric state, taking into account non-fluorescent FPs23. Therefore, determine average homo-dimer brightness values from one-color analysis to calculate the fraction of non-fluorescent FPs23.
- For illustration, plot channel and cross-correlation brightness maps.
Access restricted. Please log in or start a trial to view this content.
Results
A first test for the protein-protein interaction assay, i.e., mixing of cells expressing spectrally distinct fluorescent proteins followed by sFCCS/ccN&B measurements (Figure 1), should be performed on proteins that are not expected to interact at the cell-cell contact (i.e., a negative control). Therefore, HEK 293T cells expressing myristoylated-palmitoylated-mEYFP (myr-palm-mEYFP) or -mCardinal were mixed and sFCCS was performed across...
Access restricted. Please log in or start a trial to view this content.
Discussion
The experimental procedure described here allows the investigation of protein-protein trans interactions at cell-cell contacts, employing fluorescence fluctuation spectroscopy techniques, namely sFCCS and ccN&B. These methods involve a statistical analysis of fluorescence fluctuations emitted by two spectrally separated FPs fused to the protein(s) of interest at a contact of two neighboring cells, each expressing one or the other fusion protein. The presence of trans complexes is quantified by probi...
Access restricted. Please log in or start a trial to view this content.
Disclosures
The authors have nothing to disclose.
Acknowledgements
This work was partially supported by the Deutsche Forschungsgemeinschaft (DFG) grant 254850309. The authors thank Madlen Luckner for critical reading of the manuscript.
Access restricted. Please log in or start a trial to view this content.
Materials
| Name | Company | Catalog Number | Comments |
|---|---|---|---|
| DMEM growth medium | PAN-Biotech | P04-01548 | |
| DPBS w/o: Ca2+ and Mg2+ | PAN-Biotech | P04-36500 | |
| DPBS w: Ca2+ and Mg2+ | PAN-Biotech | P04-35500 | |
| Trypsin EDTA | PAN-Biotech | P10-023100 | |
| TurboFect Transfection Reagent | Thermo Fisher Scientific | R0531 | |
| HEK 293T cells | DSMZ | ACC 635 | |
| Alexa Fluor 488 NHS Ester | Thermo Fisher Scientific | A20000 | |
| Rhodamine B | Sigma-Alderich | 83689-1G | |
| Plasmid DNA | Addgene | NA | See reference 12 (Dunsing et. al., MBoC 2017),for a detailed description of all plasmids |
| 6-well plate | Starlab | CC7672-7506 | |
| 35-mm glass bottom dishes | CellVis | D35-14-1.5-N | |
| Zeiss LSM780 confocal | Carl Zeiss | NA | |
| MATLAB software package | MathWorks | 2015b | |
| Neubauer cell counting chamber | Marienfeld | 640110 |
References
- Alberts, B., Johnson, A., Lewis, J., Raff, M., Roberts, K., Walter, P. Molecular biology of the cell. , Garland Science. (2002).
- Tepass, U., Truong, K., Godt, D., Ikura, M., Peifer, M. Cadherins in embryonic and neural morphogenesis. Nature Reviews Molecular Cell Biology. 1 (2), 91-100 (2000).
- Harris, T. J. C., Tepass, U. Adherens junctions: from molecules to morphogenesis. Nature Reviews Molecular Cell Biology. 11 (7), 502-514 (2010).
- Hernández, J. M., Podbilewicz, B. The hallmarks of cell-cell fusion. Development. 144 (24), Cambridge, England. 4481-4495 (2017).
- Huppa, J. B., Davis, M. M. T-cell-antigen recognition and the immunological synapse. Nature Reviews Immunology. 3 (12), 973-983 (2003).
- Kaden, D., Voigt, P., Munter, L. -M., Bobowski, K. D., Schaefer, M., Multhaup, G. Subcellular localization and dimerization of APLP1 are strikingly different from APP and APLP2. Journal of cell science. 122, Pt 3 368-377 (2009).
- Yap, A. S., Michael, M., Parton, R. G. Seeing and believing: recent advances in imaging cell-cell interactions. F1000Research. 4, F1000 Faculty Rev 273(2015).
- Kashef, J., Franz, C. M. Quantitative methods for analyzing cell-cell adhesion in development. Developmental Biology. 401 (1), 165-174 (2015).
- Soba, P., et al. Homo- and heterodimerization of APP family members promotes intercellular adhesion. The EMBO Journal. 24 (20), 3624-3634 (2005).
- Kim, S. A., Tai, C. -Y., Mok, L. -P., Mosser, E. A., Schuman, E. M. Calcium-dependent dynamics of cadherin interactions at cell-cell junctions. Proceedings of the National Academy of Sciences of the United States of America. 108 (24), 9857-9862 (2011).
- Feinberg, E. H., et al. GFP Reconstitution Across Synaptic Partners (GRASP) Defines Cell Contacts and Synapses in Living Nervous Systems. Neuron. 57 (3), 353-363 (2008).
- Dunsing, V., Mayer, M., Liebsch, F., Multhaup, G., Chiantia, S. Direct evidence of amyloid precursor-like protein 1 trans interactions in cell-cell adhesion platforms investigated via fluorescence fluctuation spectroscopy. Molecular biology of the cell. 28 (25), 3609-3620 (2017).
- Schneider, F., et al. Diffusion of lipids and GPI-anchored proteins in actin-free plasma membrane vesicles measured by STED-FCS. Molecular Biology of the Cell. 28 (11), 1507-1518 (2017).
- Bacia, K., Kim, S. A., Schwille, P. Fluorescence cross-correlation spectroscopy in living cells. Nature methods. 3 (2), 83-89 (2006).
- Ries, J., Schwille, P. Studying Slow Membrane Dynamics with Continuous Wave Scanning Fluorescence Correlation Spectroscopy. Biophysical Journal. 91 (5), 1915-1924 (2006).
- Ries, J., Chiantia, S., Schwille, P. Accurate Determination of Membrane Dynamics with Line-Scan FCS. Biophysical Journal. 96 (5), 1999-2008 (2009).
- Chiantia, S., Ries, J., Schwille, P. Fluorescence correlation spectroscopy in membrane structure elucidation. Biochimica et Biophysica Acta (BBA) - Biomembranes. 1788 (1), 225-233 (2009).
- Digman, M. A., Dalal, R., Horwitz, A. F., Gratton, E. Mapping the number of molecules and brightness in the laser scanning microscope. Biophysical journal. 94 (6), 2320-2332 (2008).
- Dalal, R. B., Digman, M. A., Horwitz, A. F., Vetri, V., Gratton, E. Determination of particle number and brightness using a laser scanning confocal microscope operating in the analog mode. Microscopy research and technique. 71 (1), 69-81 (2008).
- Unruh, J. R., Gratton, E. Analysis of Molecular Concentration and Brightness from Fluorescence Fluctuation Data with an Electron Multiplied CCD Camera. Biophysical Journal. 95 (11), 5385-5398 (2008).
- Digman, M. A., Wiseman, P. W., Choi, C., Horwitz, A. R., Gratton, E. Stoichiometry of molecular complexes at adhesions in living cells. Proceedings of the National Academy of Sciences of the United States of America. 106 (7), 2170-2175 (2009).
- Hellriegel, C., Caiolfa, V. R., Corti, V., Sidenius, N., Zamai, M. Number and brightness image analysis reveals ATF-induced dimerization kinetics of uPAR in the cell membrane. The FASEB journal official publication of the Federation of American Societies for Experimental Biology. 25 (9), 2883-2897 (2011).
- Dunsing, V., Luckner, M., Zühlke, B., Petazzi, R. A., Herrmann, A., Chiantia, S. Optimal fluorescent protein tags for quantifying protein oligomerization in living cells. Scientific Reports. 8 (1), 10634(2018).
- Chen, Y., Johnson, J., Macdonald, P., Wu, B., Mueller, J. D. Observing Protein Interactions and Their Stoichiometry in Living Cells by Brightness Analysis of Fluorescence Fluctuation Experiments. Methods in enzymology. 472, 345-363 (2010).
- Kapusta, P. Absolute Diffusion Coefficients: Compilation of Reference Data for FCS Calibration. , Available from: https://www.picoquant.com/images/uploads/page/files/7353/appnote_diffusioncoeffients.pdf (2010).
- Foo, Y. H., Naredi-Rainer, N., Lamb, D. C., Ahmed, S., Wohland, T. Factors affecting the quantification of biomolecular interactions by fluorescence cross-correlation spectroscopy. Biophysical journal. 102 (5), 1174-1183 (2012).
- Baum, M., Erdel, F., Wachsmuth, M., Rippe, K. Retrieving the intracellular topology from multi-scale protein mobility mapping in living cells. Nature Communications. 5, 4494(2014).
- Wohland, T., Rigler, R., Vogel, H. The standard deviation in fluorescence correlation spectroscopy. Biophysical journal. 80 (6), 2987-2999 (2001).
- Ries, J., et al. Automated suppression of sample-related artifacts in Fluorescence Correlation Spectroscopy. Optics Express. 18 (11), 11073(2010).
- Ries, J., Schwille, P. New concepts for fluorescence correlation spectroscopy on membranes. Physical Chemistry Chemical Physics. 10 (24), 3487(2008).
- Mayer, M. C., et al. Amyloid precursor-like protein 1 (APLP1) exhibits stronger zinc-dependent neuronal adhesion than amyloid precursor protein and APLP2. Journal of Neurochemistry. 137 (2), 266-276 (2016).
- Linkert, M., et al. Metadata matters: access to image data in the real world. The Journal of Cell Biology. 189 (5), 777-782 (2010).
- Trullo, A., Corti, V., Arza, E., Caiolfa, V. R., Zamai, M. Application limits and data correction in number of molecules and brightness analysis. Microscopy Research and Technique. 76 (11), 1135-1146 (2013).
- Nolan, R., et al. nandb-number and brightness in R with a novel automatic detrending algorithm. Bioinformatics. 33 (21), Oxford, England. 3508-3510 (2017).
- Hammond, G. R. V., Sim, Y., Lagnado, L., Irvine, R. F. Reversible binding and rapid diffusion of proteins in complex with inositol lipids serves to coordinate free movement with spatial information. The Journal of cell biology. 184 (2), 297-308 (2009).
- Hendrix, J., Dekens, T., Schrimpf, W., Lamb, D. C. Arbitrary-Region Raster Image Correlation Spectroscopy. Biophysical journal. 111 (8), 1785-1796 (2016).
- Hendrix, J., et al. Live-cell observation of cytosolic HIV-1 assembly onset reveals RNA-interacting Gag oligomers. The Journal of cell biology. 210 (4), 629-646 (2015).
- Hendrix, J., Schrimpf, W., Höller, M., Lamb, D. C. Pulsed Interleaved Excitation Fluctuation Imaging. Biophysical Journal. 105 (4), 848-861 (2013).
- Honigmann, A., et al. Scanning STED-FCS reveals spatiotemporal heterogeneity of lipid interaction in the plasma membrane of living cells. Nature Communications. 5 (1), 5412(2014).
- Chojnacki, J., et al. Envelope glycoprotein mobility on HIV-1 particles depends on the virus maturation state. Nature Communications. 8 (1), 545(2017).
- Godin, A. G., et al. Revealing protein oligomerization and densities in situ using spatial intensity distribution analysis. Proceedings of the National Academy of Sciences of the United States of America. 108 (17), 7010-7015 (2011).
- Müller, J. D., Chen, Y., Gratton, E. Resolving Heterogeneity on the Single Molecular Level with the Photon-Counting Histogram. Biophysical Journal. 78 (1), 474-486 (2000).
- Kim, S. A., Heinze, K. G., Bacia, K., Waxham, M. N., Schwille, P. Two-Photon Cross-Correlation Analysis of Intracellular Reactions with Variable Stoichiometry. Biophysical Journal. 88 (6), 4319-4336 (2005).
- Jenkins, E., et al. Reconstitution of immune cell interactions in free-standing membranes. Journal of cell science. 132 (4), (2018).
Access restricted. Please log in or start a trial to view this content.
Reprints and Permissions
