Here we describe a high-throughput method for comprehensive drug surveillance that allows for the improved resolution and detection of large panels of drugs of abuse and their metabolites, with quality control based on multisegment injection-capillary electrophoresis-mass spectrometry.
Method Article
High-throughput and Comprehensive Drug Surveillance Using Multisegment Injection-Capillary Electrophoresis-Mass Spectrometry
In This Article
Erratum Notice
Important: There has been an erratum issued for this article. View Erratum Notice
Summary
Abstract
New analytical methods are urgently needed to enable high-throughput, yet comprehensive drug screening, given an alarming opioid and prescription drug crisis in public health. Conventional urine drug testing based on a two-tier immunoassay screen followed by a gas chromatography-tandem mass spectrometry (GC-MS/MS) or liquid chromatography-tandem mass spectrometry (LC-MS/MS) method are expensive and prone to bias while being limited to targeted panels of known drugs of abuse (DoA). Herein, we outline an improved method for drug surveillance that allows for the resolution and detection of an expanded panel of DoA and their metabolites when using multisegment injection-capillary electrophoresis-mass spectrometry (MSI-CE-MS). Multiplexed separations of ten urine samples with a quality control by CE (< 3 min/sample) in conjunction with full-scan data acquisition using a time-of-flight mass spectrometer (TOF-MS) under positive ion mode detection allows for the identification and quantification of DoA above recommended cut-off levels. An excellent resolution of drug isomers and isobars, including background interferences, are achieved when using MSI-CE-MS with an electrokinetic spacer between sample segments, where accurate mass/molecular formula together with the comigration of a matching deuterated internal standard and the detection of one or more bio-transformed metabolites facilitate DoA identification over a wider detection window. Additionally, urine samples can be analyzed directly without enzyme deconjugation for the rapid screening without complicated sample workup. MSI-CE-MS enables the surveillance of a broad spectrum of DoA that is required for the treatment monitoring of high-risk patients, including confirming prescribed drug adherence, revealing illicit drug use/substitution, and evaluating optimal dosage regimes as required for new advances in precision medicine.
Introduction
An alarming increase in the misuse of and the addiction to opioids for the management of chronic pain represents a growing menace to public health, with over 70,000 drug overdose deaths in the USA estimated in 20171. Similarly, various other psychotropic medications are also widely prescribed to children and young adults for the treatment of anxiety, depression, and mental health issues2. As a result, urine drug testing methods, widely developed for the workplace and forensic toxicology, is of vital importance to the therapeutic monitoring of prescribed medications that are prone to tolerance and dependence3,4. This is needed to ensure adherence, optimal therapeutic efficacy, and patient safety, while revealing potential substitution, including illicit or nonprescribed drug misuse. Currently, urine drug tests for DoA rely on a two-tiered approach, comprising of an initial competitive immunoassay screen via point-of-care devices or laboratory analyzers, followed by a confirmatory test with greater specificity based on GC-MS/MS and, increasingly, LC-MS/MS5. However, immunoassays are prone to the bias, as antibody reagents bind nonspecifically to various drug classes to generate a presumptive screen-positive result, which prevents a reliable identification and quantification of specific drugs or complex drug mixtures6. In this context, more accurate urine drug tests are urgently needed given the exorbitant costs of comprehensive polydrug screens,7 including designer drugs and synthetic urine products that elude conventional targeted assays.
High-efficiency separations in conjunction with high-resolution MS (HRMS) using TOF or orbitrap mass analyzers have been proposed as a nontargeted strategy for drug surveillance in an era of polypharmacy and expanding panels of DoA8,9. However, conventional LC separations are slow (> 15 min) due to the long elution times for the resolution of chemically diverse classes of DoA and their metabolites using gradient elution programs, which limits the sample throughput for routine drug screening. Alternatively, direct analysis methods based on the desorption ionization (DESI)10 and laser diode thermal desorption (LDTD) allow for faster drug screening without separation11. However, these ambient ionization methods are prone to isobaric/isomeric interferences when analyzing complex urine specimens, thus requiring independent confirmatory testing.
Our laboratory has recently developed a multiplexed separation platform to increase sample throughput while retaining the resolution and data fidelity of a high-efficiency separation based on MSI-CE-MS12. Novel data workflows can be designed in MSI-CE-MS for the nontargeted metabolite profiling (i.e., metabolomics) of volume-restricted biospecimens, whereas quality controls (QC) allow for the batch correction as required for large-scale population studies13. In this case, separations are performed using an isocratic buffer with solute ionization occurring under steady-state solvent conditions when using a conventional sheath liquid interface, which allows for serial injections of 10 or more samples within a single run for the rapid yet selective screening of diverse classes of DoA and their metabolites14. The focus of this study is to further validate MSI-CE-MS for the direct analysis of authentic urine samples from a representative cohort of clinically depressed patients using a “dilute-and-shoot” method that avoids the need for enzyme hydrolysis15. Additionally, the implementation of an electrokinetic spacer between serial sample plugs in MSI-CE-MS16 was performed to further improve the resolution of various drug isomers/isobars, background urinary interferences, and/or cross-interferences when screening large panels of DoA. The absolute quantification of DoA in urine specimens when using matching deuterated internal standards (d-IS) is demonstrated when using MSI-CE-MS. This approach also facilitates drug identification, as well as deducing the correct sample position of screen-positive cases when compared to a drug panel mixture at the recommended screening cut-off level that also functions as an internal reference/QC within the same run.
Protocol
Blinded urine samples were kindly provided by Dr. Zainab Samaan from the Moods Disorder Clinic at St. Joseph’s Hospital (Hamilton, ON, Canada), whose study was approved by the Hamilton Integrated Research Ethics Board.
1. Reagents and Sample Solutions Preparation
- Background electrolyte preparation
- Prepare 50 mL of background electrolyte (BGE) biweekly, 1 M formic acid, pH 1.8, with 15% v/v acetonitrile as an organic modifier.
- Aliquot 1.9 mL of concentrated formic acid stock (26.5 M) into a 50 mL volumetric flask and add 7.5 mL of acetonitrile and 40.6 mL of deionized water to bring the total volume to 50 mL. Then, sonicate the solution for 15 min and transfer it to a sterilized bottle with tight sealing.
- Sheath liquid preparation
- Prepare 200 mL of sheath liquid solution weekly, comprising 0.1% formic acid in 60:40 (MeOH:H2O).
- Aliquot 200 µL of formic acid (26.5 M stock) into a bottle containing 120 mL of MeOH and 80 mL of H2O to make sheath liquid and degas it for 15 min.
- Next, add 10 µL of each of the following reference ions, purine and hexakis(2,2,3,3-tetrafluoropropoxy)phosphazine (HP-921), into the sheath liquid to provide constant mass signals at m/z 121.05087 and m/z 922.00979, respectively.
NOTE: Those reference ions allow for real-time mass correction and also monitor for potential matrix-induced ion suppression or enhancement effects during separation.
- Standard preparation
- Prepare a standard solution containing an 84-drug panel mixture at the 3x clinical screening cut-off level (L6)14 in 1 mL of methanol, using the drug standards purchased from a chemical supplier. Prepare separately a mixture of 48 matching deuterated internal drug standard (d-ISs) at a 10-fold higher concentration than the 84-drug mixture in 1 mL of methanol. In addition, prepare a stock solution containing 200 µM of 4-fluoro-L-phenylalanine (F-Phe) and 3-chloro-L-tyrosine (Cl-Tyr) in 1 mL of deionized H2O.
- Perform a fivefold dilution of the above-mentioned 84-drug mixture (20 µL) and the 48 d-ISs (20 µL), as well as a tenfold dilution of 4-fluorophenylalanine (F-Phe, 10 µL) and 3-chlorotyrosine (Cl-Tyr, 10 µL) in a certified synthetic urine matrix (40 µL) to make a total volume of 100 µL in a 250 µL centrifuge tube.
- External calibration curve preparation
- Prepare five-point external calibration curves (as described below) in quadruplicate (n = 4) over a 20-fold dynamic range using the 84-drug standard mixture and 48 of their corresponding d-ISs made in step 1.3.1. For example, for making a five-point external calibration curve, ensure diluting the 84-drug mixture (L6, step 1.3.1) to 2-, 4-, 10-, 20-, and 40-fold, whereas it is necessary to prepare a fivefold dilution of matching d-ISs (20 µL) and a tenfold dilution of 4-F-Phe (10 µL) and Cl-Tyr (10 µL) as an additional IS in a synthetic urine matrix to make a total volume of 100 µL. In cases when a matching d-IS is not available for a specific drug, use 4-F-Phe as a surrogate IS for data normalization.
NOTE: Avoid the inclusion of additional d-ISs that cross-interfere (isobaric) with other DoA within the panel if they are not fully resolved by the CE separation.
- Prepare five-point external calibration curves (as described below) in quadruplicate (n = 4) over a 20-fold dynamic range using the 84-drug standard mixture and 48 of their corresponding d-ISs made in step 1.3.1. For example, for making a five-point external calibration curve, ensure diluting the 84-drug mixture (L6, step 1.3.1) to 2-, 4-, 10-, 20-, and 40-fold, whereas it is necessary to prepare a fivefold dilution of matching d-ISs (20 µL) and a tenfold dilution of 4-F-Phe (10 µL) and Cl-Tyr (10 µL) as an additional IS in a synthetic urine matrix to make a total volume of 100 µL. In cases when a matching d-IS is not available for a specific drug, use 4-F-Phe as a surrogate IS for data normalization.
- Urine sample preparation
- Thaw deidentified morning urine samples from a representative cohort of ten clinically depressed patients with a known prescription drug history. Store the urine samples at -80 °C after collection until they have to be thawed for analysis.
NOTE: Avoid multiple freeze-thaw cycles of urine or a delayed storage at room temperature following the collection due to their effect on the chemical stability of certain DoA metabolites and their conjugates. - Vortex the deidentified morning urine samples for 30 s and, then, centrifuge them for 1 min at 14,000 x g for sedimentation. After that, aliquot 10 µL of the above-mentioned processed urine, 10 µL of d-IS, and 5 µL of F-Phe/Cl-Tyr and 25 µL of deionized H2O, and vortex for 1 min (repeat these steps in triplicate to assess technical precision). Transfer a 20 µL aliquot of the above-described mixture to a polypropylene vial for analysis.
- Thaw deidentified morning urine samples from a representative cohort of ten clinically depressed patients with a known prescription drug history. Store the urine samples at -80 °C after collection until they have to be thawed for analysis.
2. Setup of the CE-TOF-MS System
- Uncoated fused-silica capillary conditioning parameters
- Make sure that all standards, external calibration curves, and urine samples prepared in sections 1.3 - 1.5 are separated using an uncoated open-tubular fused silica polyimide-coated capillary with an internal diameter of 50 μm, an outer diameter of 360 µm, and a total capillary length of 135 cm.
NOTE: A diamond cutter tool is used to ensure consistent capillaries that are further inspected to ensure a flush and smooth cut. - Remove about 7 mm of the polyimide coating from both the distal capillary ends, using a capillary window maker to reduce sample carry-over and to prevent potential polyimide swelling when in contact with organic solvent.
- Make sure to protrude about 2 mm of the capillary outlet out of the CE sprayer needle and install the capillary inlet in the CE cartridge by looping two 360° turns. Then, carefully install the CE cartridge in the CE and place the CE sprayer out of the ion source when conditioning the capillary.
NOTE: Cut the capillary outlet consistently as it is crucial for ensuring a stable electrospray current when coupled to MS. Two different sprayers were used in this work: a CE sprayer was used for the sample analysis, and an LC sprayer was used for the mass calibration. - Make sure to perform the capillary conditioning with the CE sprayer not placed in the ion source. Put the LC sprayer in the ion source.
NOTE: This allows for mass calibration while avoiding any contamination of the coaxial sheath liquid interface that is subsequently coupled to the TOF-MS. - Condition new capillaries by selecting the flush function (940 mbar) on the vendor’s software used to control the instrument and set the duration of the flush at 30 min each for four different solvents in the following order: methanol, 1M NaOH, deionized water, and BGE. Make sure to put the isocratic pump at standby during the capillary conditioning period.
- Wipe the CE-MS sprayer with a tissue wipe soaked in MeOH/H2O to remove any residual salt deposits.
- Perform the daily preventative maintenance of the CE-MS system before analyzing the samples. Use methanol to wipe down of CE electrode (at inlet) but use an isopropanol and water (50:50) mixture to clean the CE-MS interface, which is important to avoid salt build-up and limit potential sample carry-over.
- Remove the LC sprayer out of the ion source and position the cleaned sprayer with a newly conditioned capillary in the coaxial sheath liquid interface for CE-MS.
- Turn the isocratic pump on and apply a voltage of 30 kV for 15 min to ensure that a stable CE current profile is achieved prior to the urine analysis.
- Make sure that all standards, external calibration curves, and urine samples prepared in sections 1.3 - 1.5 are separated using an uncoated open-tubular fused silica polyimide-coated capillary with an internal diameter of 50 μm, an outer diameter of 360 µm, and a total capillary length of 135 cm.
- Injection and separation conditions using CE
- Open the vendor software used for controlling the instrument to set the CE parameters and select the preconditioning step. Set flush function to 600 s and specify a BGE vial position.
NOTE: An external water chiller may need to be connected to CE systems that lack sample tray cooling features, as this is required to prevent sample evaporation when analyzing large batches of volume-restricted samples. - Set the injection function to hydrodynamically inject the samples at 100 mbar for 5 s and electrokinetically inject BGE spacers at 30 kV for 75 s.
NOTE: This process is repeated with each sample injection (from a different vial position) followed by a BGE spacer (from the same vial position) that is performed automatically within a method program on the software for a total of 11 discrete samples analyzed in the same run when using an MSI format. Analyze 10 urine samples in random order after an 84-panel drug mixture at the screening cut-off level is injected as the first sample position for each MSI-CE-MS run. - Set the applied voltage to be 30 kV, the cartridge temperature to be 25 °C, and the total runtime to be 40 min. Using the timetable, apply a pressure gradient of 2 mbar/min from 0 min to 40 min during the separation.
NOTE: A gradient pressure is applied during the separation to allow for the elution of slow-migrating drugs, which includes some weakly, basic benzodiazepines and neutral/acidic drugs (e.g., acetaminophen, barbiturates). However, most basic DoA and their metabolites migrate as cations within 25 min, including amphetamines, opioids, and other classes of alkaloids. - After the sample acquisition is completed, make sure to rinse the capillary at a low pressure (50 mbar) with BGE until the next day. Otherwise, rinse the capillary for 600 s at a high pressure (900 mbar) with water and then for 600 s with air, and store it in a sprayer holder until the next use.
- Open the vendor software used for controlling the instrument to set the CE parameters and select the preconditioning step. Set flush function to 600 s and specify a BGE vial position.
- Isocratic pump and sheath liquid
- Use an Infinity Isocratic Pump and an Infinity Degasser to deliver the sheath liquid (60:40 MeOH:H2O with 0.1% v/v formic acid) at a rate of 10 µL/min to the CE-MS sprayer.
- TOF-MS settings
- Ensure that a TOF-MS, with a coaxial sheath-liquid electrospray ion source and heated nitrogen gas, is equipped with a CE unit.
- Operate the TOF-MS under positive ion detection that spanned a mass of m/z 50 - 1,700, with a data acquisition rate of 500 ms/spectrum. Ensure that both the profile and the centroid data are stored in a “.d” file format.
- Set the electrospray ionization conditions to be: Vcap and nozzle voltage at 2,000 V, the nebulizer gas at 10 psi, and the drying gas delivered at 8 L/min at 300 °C, with a sheath gas flow of 3.5 L/min at 195 °C. In addition, set the MS voltage settings of the fragmentor, skimmer, and Oct1 RF to 120, 65, and 750 V, respectively.
NOTE: Vcap and nozzle voltage, as well as nebulizer gas were turned off during the serial sample injection sequence used in MSI-CE-MS, but the electrospray was programmed to be turned back on 1 min after initiation of the electrophoretic separation to prevent current errors due to suctioning effects. - Perform the instrument control and data acquisition using the vendor’s software (Table of Materials).
- Data analysis
- Analyze the MSI-CE-MS data using the vendor’s software, including processing, data smoothing, and the integration of extracted ion electropherograms (EIEs) for representative DoA and their metabolites.
- Open the software and set the following parameters.
- Under chromatograms, select the extraction data format, and chromatogram and mass spectral data format to Profile mode.
- Select Quadratic/Cubic Savitzky Golay under the smoothing function and function width to 15 points.
- Then, click Integrate (MS), set the integrator to be Agile, and select the maximum number of peaks limit to the largest 11 under peak filters.
- Click View, click Integration peak list, and select the peak number, retention time (RT), peak area, peak height, and signal-to-noise ratio (SNR).
- Save these parameters under a unique method name. Apply this method to the process and interpret each data set.
NOTE: A summary table with peak number, the RT, the peak area and height, and the SNR displays on the right-hand side. Perform data normalization for measured RT and integrated peak area for each DoA to either a matching d-IS or (if not available) to F-Phe to improve analytical precision.
3. Analysis of the Urine Samples and External Calibration Curves
- Different serial injection configurations used in MSI-CE-MS
- For the first serial sample injection configuration, used to demonstrate drug isomer/isobar resolution (Figure 1A), ensure that five repeated injections are performed on a mixture of 84 drug standards with d-IS and 4-F-Phe/Cl-Tyr, followed by a sixth injection, which is a blank sample in synthetic urine, and five additional injections of the standard drug mixture.
- For the second serial sample injection configuration, used to demonstrate the detection of DoA in individual urine samples from patients with a known prescription (Figure 2A), ensure that the first sample plug is a mixture of 84-drug standard mixture at a 1x cut-off screening level (positive control) followed by a randomized injection of 10 diluted urine samples from patients: #293, #88, #309, #43, #281, #64, #221, #208, #183, and #50.
- For the third serial sample injection configuration, used to illustrate the acquisition of external calibration curves in a single run, ensure that calibrant solutions for DoA are prepared over a 20-fold linear dynamic range corresponding to 0.25x, 0.5x, 1x, 2.5x, and 5x cut-off concentration levels, together with matching d-IS and F-Phe/Cl-Tyr as additional IS in a synthetic urine matrix (n = 4).
Results
MSI-CE-MS enables the serial injection of ten or more discrete samples within a single run, which greatly enhances throughput (<3 min/sample) without complicated instrumental modifications, column-switching programs, or costly infrastructure investments (Figure 1A). An alternating series of hydrodynamic injections of the sample and electrokinetic spacer of BGE is performed within an unmodified fused-silica capillary, where zonal electrophoretic separations of ions occur under strongly acidic electrolyte conditions (pH 1.8). Solute ionization also occurs under steady-state conditions. In this case a coaxial sheath liquid, with a mass calibrant, is used as an interface for CE-MS under the positive ion mode detection with minimal ion suppression or enhancement effects as monitored by the mass calibrant ions signal. TOF represents a robust yet cost-effective HRMS with a fast data acquisition ideally suited for the nontargeted screening/drug surveillance applications when using MSI-CE-MS. For example, impressive resolution is achieved for various isobaric/isomeric DoA and their metabolites, including structural isomers of three opioid structural isomers, namely norhydrocodone, hydromorphone, and morphine (Figure 1B). In this case, 30 resolved peaks from 10 independent samples of a drug mixture are detected without sample carry-over. A synthetic urine blank/negative urine control is also included within the serial injection series (sample position #6). Also, two other isobaric opioids, namely 6-acetylmorphine (an inactive heroin metabolite) and naloxone (an opioid receptor antagonist used for the emergency treatment of opioid overdose) are fully resolved as 20 distinct peaks with full-scan data acquisition (Figure 1C). Similarly, two amphetamine positional isomers are fully resolved in MSI-CE-MS to distinguish illicit methamphetamine abuse from the potential misuse of phentermine, a prescribed stimulant that is used as an appetite suppressant for weight loss.
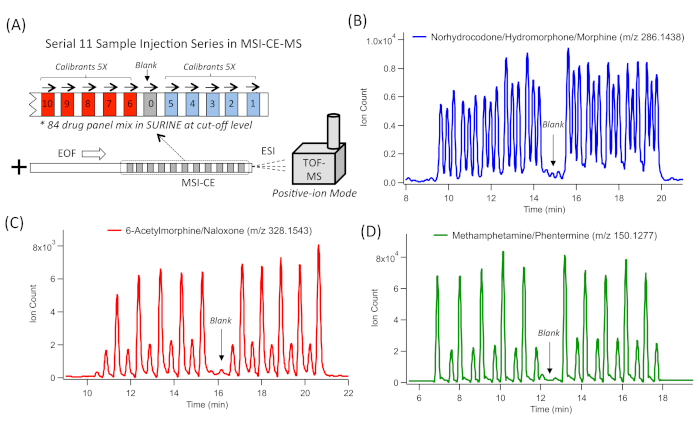
Figure 1: A series of extracted ion electropherograms (EIE) for representative DoA isomers/isobars that are resolved by MSI-CE-MS by analyzing ten samples and a blank within a single run. (A) Schematic of MSI-CE-MS that depicts the serial injection configuration used for an 84-DoA panel in synthetic urine. This multiplexed separation method uses an alternating series of hydrodynamic injections of 11 discrete samples and blank with an electrokinetic injection of a buffer to initiate the zonal electrophoretic separation of ions, followed by a full-scan data acquisition by TOF-MS with positive ion mode detection. (B) Three isobaric functional group opioid isomers (m/z 286.1438), separated by CE, comprising 30 resolved peaks from 10 discrete sample injections, including norhydrocodone, hydromorphone, and morphine. (C) Two isobaric opioid drugs and their metabolites (m/z 328.1543), separated by CE, comprising 20 resolved peaks from 10 discrete sample injections, including 6-acetylmorphine (heroin metabolite) and naloxone. (D) Two isobaric functional group amphetamine isomers, separated by CE, comprising 20 resolved peaks from 10 discrete sample injections, including methamphetamine and phentermine. In all cases, negative urine controls/blanks introduced at the sixth sample position in MSI-CE-MS had negligible evidence of sample carry-over. Please click here to view a larger version of this figure.
To screen DoA, a serial injection configuration in MSI-CE-MS used an 84-drug panel mixture at the recommended screening cut-off concentration levels (as the first injection position for all runs) followed by a randomized analysis of 10 representative urine samples from clinically depressed patients with a known prescription history. For instance, a positive screening test result for methadone (m/z 310.2165) from patient #208 (Figure 2A) is deduced by a detection of a large signal peak (originating from injection #9) which comigrates with methadone-d3 with a low mass error (<5 ppm). No other signals are detected in any other urine samples within the same run. Methadone concentration exceeds 13x the recommended cut-off limit when comparing its measured ion response ratio in the sample (injection #9) with the reference drug mixture/QC (injection #1) and corrected by a fourfold urine dilution factor. Thus, this result confirms the patient's adherence to methadone maintenance therapy. Evidence of nonprescribed amphetamine intake (Figure 2B) is shown by elevated amphetamine levels (m/z 136.1121) which was only detected in one patient (patient #50, in injection #11) within the MSI-CE-MS run. The measured concentration slightly exceeded the recommended cut-off levels (1.3x). This comigrates with amphetamine-d5 and had a low mass error with a top-ranked molecular formula match. A positive test result for the antidepressant venlafaxine (m/z 278.2115), a selective serotonin-norepinephrine reuptake inhibitor, is also demonstrated in patient #281 (injection #6). In this case, the concentration exceeds the recommended cut-off levels (15x), This is identified by its accurate mass- or molecular formula-match, together with comigrating venlafaxine-d6 (Figure 2C). The latter criterion is not met for an unknown isobar that is also detected within the EIE trace, which highlights the need for caution when relying solely on its accurate mass. Also, a definitive detection of prescribed pregabalin, which is prescribed for the treatment of neuropathic pain, as well as of generalized anxiety, is also demonstrated for patient #309, based on its grossly elevated concentration (64x) above the recommended cut-off levels (Figure 2D). It is, however, not detected in the nine other patient urine samples analyzed within the same run. Similar to the other screen-positive cases, injection #4, comigrates with pregabalin-d6, which is included in all urine samples analyzed by MSI-CE-MS.
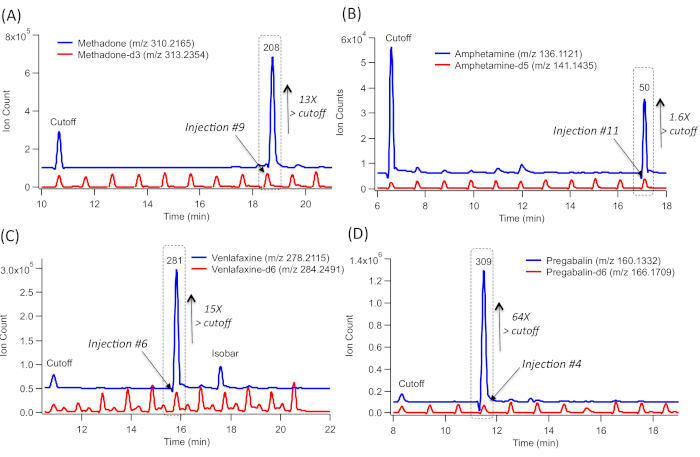
Figure 2: A series of extracted ion electropherograms (EIE) for representative screen-positive urine drug test results from a cohort of 10 clinically depressed patients as confirmed when using MSI-CE-MS, which includes an 84-drug panel at recommended cut-off level, injected as the first sample injection position serving as internal reference/QC. (A) EIE overlay corresponding to methadone-d3, which comigrates with methadone, highlighting that only one urine sample (injection position #9) has elevated methadone concentrations far exceeding the cut-off level. (B) EIE overlay corresponding to amphetamine-d3, which comigrates with amphetamine, highlighting that only one urine sample (injection position #11) has elevated concentrations above cut-off levels. (C) EIE overlay corresponding to venlafaxine-d6, which comigrates with venlafaxine, highlighting that only one urine sample (injection position #6) has elevated concentrations above cut-off levels. (D) EIE overlay corresponding to pregabalin-d6, which comigrates with pregabalin, highlighting that only one urine sample (injection position #4) has grossly elevated concentrations exceeding cut-off levels. All urine samples were analyzed directly after a fivefold dilution in deionized water together with the addition of a matching d-IS (when available). A screen-positive result in MSI-CE-MS corresponds to a drug that comigrates with d-ISs with a low mass error (<5 ppm) and the correct molecular formula, whose concentration exceeds the cut-off that is analyzed within the same run as internal reference/QC. Please click here to view a larger version of this figure.
The absolute quantification of DoA and their metabolites is also achieved by MSI-CE-MS based on external calibration curves, using reference calibrant standards for DoA that are acquired rapidly within a single run. For instance, the serial dilution of an 84-drug calibrant mixture together with a matching d-IS at a fixed concentration provides a reliable quantitative analysis in complex urine samples. This compensates for the potential matrix-induced ion suppression or enhancement but also for variations in the injection volume in the capillary between the samples. In cases when a matching d-IS is commercially unavailable or cost-prohibitive for certain DoA, a surrogate IS is used for data normalization, such as a d-IS from within the same drug class or a synthetic compound not found in urine (F-Phe), as demonstrated previously14. Representative EIEs and external calibration curves for oxycodone are shown in Figure 3A, B. and for citalopram in Figure 3C, D. These are widely prescribed analgesics and antidepressants, respectively, with abuse potential. Relative ion response ratios to their matching d-IS are measured. In this case, a serial injection configuration in MSI-CE-MS, comprising five different drug calibrants, are analyzed in duplicate within a single run together with a synthetic urine blank. Overall, good linearity (R2 > 0.990) over a 20-fold concentration range was achieved with adequate sensitivity for the detection of the majority of DoA and their metabolites (i.e., cationic alkaloids) within the 84-drug panel14. In all cases, drug metabolites are detected as their protonated molecular ion [MH+] above their screening cut-off limits (>50 ng/mL), with the exception of certain acidic/neutral drugs that have a poor ionization efficiency under the positive ion mode, such as cannabinoids (e.g., THC-COOH), barbiturates (e.g., secobarbital), and carbamates (e.g., carisoprodol).
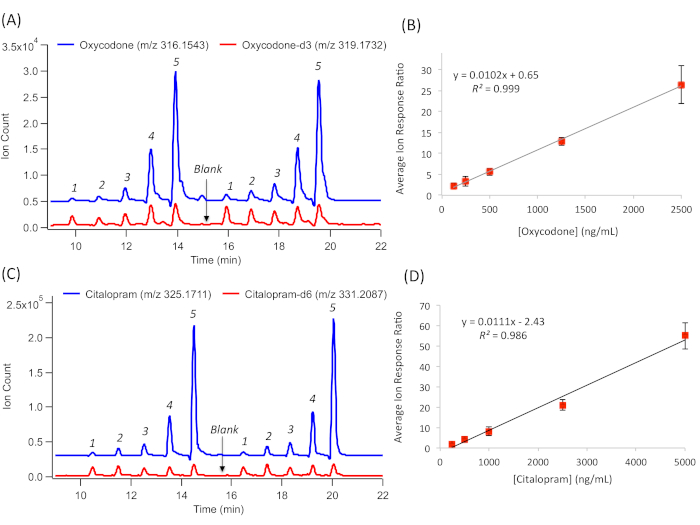
Figure 3: A series of extracted ion electropherograms (EIE) for the quantification of the representative DoA. This is done by generating external calibration curves based on their relative ion response ratio with a a matching d-IS over a 20-fold linear dynamic range. (A) Duplicate injection of a five-point calibration curve for oxycodone calibrants together with oxycodone-d3 and a blank. (B) External calibration curve for oxycodone, following linear regression to derive sensitivity (slope) and linearity (R2), with error bars representing ±1σ (n = 4). (C) Duplicate injection of a five-point calibration curve for citalopram calibrants, together with citalopram-d6 and a blank. (D) External calibration curve for citalopram, following linear regression to derive sensitivity (slope) and linearity (R2), with error bars representing ±1 SD (n = 4). Please click here to view a larger version of this figure.
Discussion
Conventional chromatographic separations typically rely on a single sample injection per run, which is then followed by a gradient elution for resolving complex drug mixtures and column reconditioning. These requirements fundamentally limit sample throughput and duty cycle even when using optimal column-switching programs. In this context, high-volume urine drug analysis for the workplace, toxicology, or therapeutic monitoring applications by GC-MS/MS and, increasingly, LC-MS/MS are thus performed in parallel but used preferentially as a second-tier or confirmatory test when necessary (i.e., legal or medical context). This is due to the much higher capital investments and operational costs, as well as complications with data analysis when comparing samples analyzed across multiple instrumental platforms within an accredited laboratory. As a result, immunoassays still remain the primary method for routine drug screening despite being prone to false-positives and false-negatives among many drug classes, with limited access to antibody reagents for emerging designer drugs. Previous studies have demonstrated that multiplexed separations based on MSI-CE-MS offer a simple solution to enhance the sample throughput up to one order of magnitude. Additionally, this approach allows for the design of novel data workflows for biomarker discovery with high data fidelity based on the implementation of effective batch correction and quality control12,13,14. However, the introduction of 10 or more serial hydrodynamic injections in MSI-CE-MS shortens the effective capillary length required to maintain high-efficiency separations, which may compromise the selectivity when analyzing DoA and their metabolites in human urine.
Herein, we introduced an electrokinetic injection of the BGE following each hydrodynamic sample injection, such that the separation takes advantage of the full capillary length (120 cm), thus improving the resolution of important drug isobars/isomers when using full-scan data acquisition by TOF-MS (Figure 1A). In comparison to a recent report14, better resolution is achieved for several important isobaric/isomeric DoA and their metabolites, which is critical when screening for large drug panels. For instance, the resolution of several important structural/functional group isomers was realized, including three analogous opioid drugs/metabolites (Figure 1B), two unrelated opioid isobars (Figure 1C), and two methamphetamine positional isomers (Figure 1D). In all cases, sample carry-over from serial injection of different calibrant solutions within the same run is not significant as confirmed by a negative urine control/blank. Additionally, improved resolution is also realized for several cross-interferences involving certain d-ISs with isobaric drugs within the panel, such as cotinine-d3 and 3,4-methylenedioxyamphetamine (MDA), EDDP-d3 and imipramine, norfentanyl-d5 and ketamine, codeine-d6 and sertraline, and cocaine-d3 and zolpidem. This outcome is extended to other isobaric interferences within the drug panel that were better resolved in this study (e.g., noroxycodone/oxymorphone, normeperidine/methylphenidate), as well as major background urinary interferences (e.g., in-source fragment ions of creatinine with amphetamine)14. Indeed, access to two orthogonal parameters to satisfy the putative identification of a specific DoA is critical to reducing false-positives due to isobaric interferences, namely accurate mass combined with comigration with d-ISs. Also, the detection of one or more biotransformed metabolites of the parent drug within the same sample, such as hydroxylated, demethylated, or intact glucuronide drug conjugate(s), adds further confidence toward drug identification while expanding the window for detection.
The recommended cut-off levels for urine drug screening vary widely for different classes of DoA (ranging from 50 to 1,000 ng/mL) depending on their pharmacokinetics, toxicity, and background interferences, in order to reduce method bias based on guidelines from the Substance Abuse and Mental Health Services Administration (SAMHSA)14. The potential for MSI-CE-MS to detect and identify diverse classes of DoA directly in urine with minimal sample pretreatment was applied to a group of clinically depressed patients with a known prescription record. The definitive identification of methadone (prescribed), amphetamine (nonprescribed/illicit), venlafaxine (prescribed), and pregabalin (prescribed) in diluted, yet nonhydrolyzed, urine samples was demonstrated when using MSI-CE-MS. This was based on a direct comparison of a drug detected in a specific injection position relative to the 84-drug mixture introduced in the first sample position at the recommended screening cut-off level which serves as an internal reference/QC and positive control (Figure 2). Also, absolute drug quantification is feasible when using external calibration curves (Figure 3) based on the ion response ratio measured for a drug relative to its d-IS. Unlike most chromatographic separations, there is no deuterium effect impacting migration time differences between a d-IS and its nondeuterated drug since they possess analogous electrophoretic mobilities in free solution in CE. Indeed, the migration behavior of DoA is accurately modeled in CE, based on their fundamental physicochemical properties/chemical structure, namely molecular volume and effective charge (pKa)14. Since many drugs also undergo significant secondary metabolism prior to excretion in urine (e.g., morphine glucuronide), screening cut-off levels require adjustment as their measured concentrations are lower than anticipated when compared to methods that utilize enzyme hydrolysis for total drug detection. A major benefit of “dilute-and-shoot” urine drug testing, besides reducing costs/time, sample handling, and a potential bias or batch variations due to incomplete enzyme hydrolysis, is that presumptive screen-positive cases are further confirmed by the detection of one or more related drug metabolites within the same sample. This also provides deeper insights into drug pharmacokinetics and optimum dosage requirements for individual patients while improving the detection for “fast” metabolizers or prescribed/illicit drugs with short half-lives. Additionally, comigration with a matching d-IS plays two important functions for reliable drug screening when using MSI-CE-MS—namely, it identifies the exact sample injection position (i.e., patient #) while also correcting for differences in ion responses/injection volumes for improved precision and accuracy.
Future work aims to develop customized software tools to facilitate automated data processing of multiplexed separations coupled to HRMS as required for high-volume urine drug testing with QC/QA. Rigorous validation of MSI-CE-MS for the broad-spectrum screening of DoA will also be investigated among a larger cohort of high-risk patients in order to objectively evaluate prescribed drug adherence and potential misuse/substitution that may compromise treatment efficacy, patient safety, and/or psychiatric evaluation/diagnosis. A complementary analysis of acidic/anionic classes of DoA and their metabolites will also be performed by MSI-CE-MS under alkaline conditions with negative ion mode detection as required for the comprehensive screening of natural/synthetic cannabinoids. This is important given the looming public health implications of the legalization of recreational marijuana across Canada and several US states. A major advantage of full-scan data acquisition by TOF-MS is that retrospective analysis of samples can be performed even when urine specimens are no longer available for follow-up testing, whereas other lifestyle or dietary exposures can be assessed to better understand differential responses to drug therapy. In summary, a rapid yet accurate drug surveillance method by MSI-CE-MS offers significant advantages to conventional targeted immunoassays, as well as direct infusion/ambient ionization-MS/MS methods that are prone to interferences/bias when resolving expanded panels of DoA and their metabolites in complex biological samples at incremental costs.
Disclosures
The authors disclose a US patent (PCT/CA2014/050454) on MSI-CE-MS as a multiplexed screening platform and data workflow for chemical analysis.
Acknowledgements
P.B.M. wishes to acknowledge funding support from the Natural Sciences and Engineering Research Council of Canada, the Canada Foundation for Innovation, Genome Canada and McMaster University. The authors thank Howard Lee at Seroclinix Corporation and Dr. Marcus Kim from Agilent Technologies for their insightful discussions. Additionally, the authors acknowledge Dr. Zainab Samaan from the Department of Psychiatry and Behavioral Sciences at McMaster University and the Moods Disorder Clinic at St. Joseph's Hospital for access to the deidentified patient urine samples used in this study.
Materials
| Name | Company | Catalog Number | Comments |
|---|---|---|---|
| 7100 Capillary Electrophoresis System | Agilent Technologies Inc. | G7100A | CE instrument used for separation of drug mixtures, desalting and anotation |
| 6230 Series Time-of-Flight Mass Spectrometer | Agilent Technologies Inc. | G6230B | HRMS mass analyzer used for drug detection and anotation |
| CE-ESI-MS Sprayer Kit | Agilent Technologies Inc. | G1603A | CE/MS coaxial sheath liquid interface and capillary casette |
| 1260 Infinity Isocratic Pump and Degasser | Agilent Technologies Inc. | G1310B | Isocratic pump to deliver sheath liquid/mass calibrant |
| MassHunter Workstation Data Acquisition Software (B.06.01) | Agilent Technologies Inc. | -- | Software used for control of CE-MS system |
| MassHunter Qualitative Analysis Software (B.06.01) | Agilent Technologies Inc. | -- | Software used for processing of CE-MS data |
| Shortix Capillary Cutter | Agilent Technologies Inc. | 5813-4620 | Cutting tool with diamond blade used to cut capillaries |
| Capillary Window Maker | Microsolv Inc. | 07200-S | Burner with 7 mm window size to remove polyimide coating from CE capillary |
| Flexible Fused-silica Capillary Tubing | Polymicro Technologies Inc. | TSP05375 | Standard polyimide coated fused-silica capillary for CE separation (50 micron ID; 360 micron OD) |
| Drug standards, deuterated internal standards, synthetic urine matrix (SURINE) | Cerilliant Inc. | Miscellaneous | Certified drugs of abuse reference standards (86 drug panel) with 48 deuterated internal standards and negative urine control (Surine) |
References
- CDC. Products - Vital Statistics Rapid Release - Provisional Drug Overdose Data. , Available from: https://www.cdc.gov/nchs/nvss/vsrr/drug-overdose-data.htm (2018).
- Olfson, M., King, M., Schoenbaum, M. Treatment of Young People With Antipsychotic Medications in the United States. JAMA Psychiatry. 72, 867-874 (2015).
- Moeller, K. E., Kissack, J. C., Atayee, R. S., Lee, K. C. Clinical Interpretation of Urine Drug Tests: What Clinicians Need to Know About Urine Drug Screens. Mayo Clinic Proceedings. 92, 774-796 (2017).
- Levy, S., Siqueira, L. M. Committee on Substance Abuse. Testing for Drugs of Abuse in Children and Adolescents. American Academy of Pediatrics. 133, e1798(2015).
- Pesce, M., Mikel, C., West, C. A tale of two drug testing technologies: GC-MS and LC-MS/MS. American Society of Interventional Pain Physicians. 13, 91-92 (2010).
- Saitman, A., Park, H. -D., Fitzgerald, R. L. False-Positive Interferences of Common Urine Drug Screen Immunoassays: A Review. Journal of Analytical Toxicology. 38, 387-396 (2014).
- Segal, D. In Pursuit of Liquid Gold. The New York Times. , Available from: https://www.nytimes.com/interactive/2017/12/27/business/urine-test-cost.html (2017).
- Wu, A. H., et al. Role of liquid chromatography-high resolution mass spectrometry (LC-HR/MS) in clinical toxicology. Clinical Toxicology. 50, 733-742 (2012).
- Guale, F., et al. Validation of LC-TOF-MS Screening for Drugs, Metabolites, and Collateral Compounds in Forensic Toxicology Specimens. Journal of Analytical Toxicology. 37, 17-24 (2013).
- Kaupilla, T. J., et al. Rapid analysis of metabolites and drugs of abuse from urine samples by desorption electrospray ionization-mass spectrometry. The Analyst. 132, 868-875 (2007).
- Bynum, N. D., Moore, K. N., Grabenauer, M. Evaluation of Laser Diode Thermal Desorption-Tandem Mass Spectrometry (LDTD-MS-MS) in Forensic Toxicology. Journal of Analytical Toxicology. 38, 528-535 (2014).
- Kuehnbaum, N. L., Kormendi, A., Britz-McKibbin, P. Multisegment Injection-Capillary Electrophoresis-Mass Spectrometry: A High-Throughput Platform for Metabolomics with High Data Fidelity. Analytical Chemistry. 85, 10664-10669 (2013).
- Nori de Macedo, A., et al. The Sweat Metabolome of Screen-Positive Cystic Fibrosis Infants: Revealing Mechanisms Beyond Impaired Chloride Transport. ACS Central Science. 3, 904-913 (2017).
- DiBattista, A., Rampersaud, D., Lee, H., Kim, M., Britz-McKibbin, P. High Throughput Screening Method for Systematic Surveillance of Drugs of Abuse by Multisegment Injection-Capillary Electrophoresis-Mass Spectrometry. Analytical Chemistry. 89, 11853-11861 (2017).
- Cao, Z., Kaleta, E., Wang, P. Simultaneous Quantitation of 78 Drugs and Metabolites in Urine with a Dilute-And-Shoot LC-MS-MS Assay. Journal of Analytical Toxicology. 29, 335-346 (2015).
- Drouin, N., Rudaz, S., Schappler, J. New Supported Liquid Membrane for Electromembrane Extraction of Polar Basic Endogenous Metabolites. Journal of Pharmaceutical and Biomedical Analysis. 159, 53-59 (2018).
Reprints and Permissions
Erratum
Formal Correction: Erratum: High-throughput and Comprehensive Drug Surveillance Using Multisegment Injection-Capillary Electrophoresis-Mass Spectrometry
Posted by JoVE Editors on 5/16/2019. Citeable Link.
An erratum was issued for: High-throughput and Comprehensive Drug Surveillance Using Multisegment Injection-Capillary Electrophoresis-Mass Spectrometry. The title was updated.
The title was updated from:
High-throughput and Comprehensive Drug Surveillance Using Multisegment Injection-capillary Electrophoresis Mass Spectrometry
to:
High-throughput and Comprehensive Drug Surveillance Using Multisegment Injection-Capillary Electrophoresis-Mass Spectrometry
