Perineural invasion is an aggressive phenotype for head and neck squamous cell carcinomas and other tumors. The chick chorioallantoic membrane model has been used for studying angiogenesis, cancer invasion, and metastasis. Here we demonstrate how this model can be utilized to assess perineural invasion in vivo.
Method Article
The Chick Chorioallantoic Membrane In Vivo Model to Assess Perineural Invasion in Head and Neck Cancer
In This Article
Summary
Abstract
Perineural invasion is a phenotype in which cancer surrounds or invades the nerves. It is associated with poor clinical outcome for head and neck squamous cell carcinoma and other cancers. Mechanistic studies have shown that the molecular crosstalk between nerves and tumor cells occurs prior to physical interaction. There are only a few in vivo models to study perineural invasion, especially to investigate early progression, before physical nerve-tumor interactions occur. The chick chorioallantoic membrane model has been used to study cancer invasion, because the basement membrane of the chorionic epithelium mimics that of human epithelial tissue. Here we repurposed the chick chorioallantoic membrane model to investigate perineural invasion, grafting rat dorsal root ganglia and human head and neck squamous cell carcinoma cells onto the chorionic epithelium. We have demonstrated how this model can be useful to evaluate the ability of cancer cells to invade neural tissue in vivo.
Introduction
Perineural invasion (PNI) is an understudied phenotype in cancer, which is associated with high disease recurrence and poor survival in patients with head and neck squamous cell carcinoma (HNC)1. PNI is defined microscopically as tumor cells within or surrounding the nerves2,3. When PNI is detected, patients are likely to receive adjuvant therapies such as elective neck dissection and/or radiation therapy4,5. However, these therapies are aggressive, and not PNI-specific. In fact, there is no therapy to block PNI, primarily because the mechanisms underlying nerve-tumor interactions are still poorly understood.
Different molecular mechanisms have been implicated in nerve-tumor attraction; tumors and stromal cells release neuropeptides and growth factors to promote neuritogenesis6,7. When cultured together in vitro, HNC cells and dorsal root ganglia (DRG) both have a robust response; effects on tumor cell invasion and neuritogenesis can be seen after a few days in culture6,8,9. However, there is a lack of appropriate in vivo models to recapitulate tumor-nerve interactions prior to invasion. Here we present an in vivo PNI model to study early interactions between HNC cells and nerves6. We adapted the chick chorioallantoic membrane (CAM) model to include a neural component, grafting a DRG in the CAM, followed by a graft of cancer cells to mimic an innervated tumor microenvironment.
The CAM model has been used successfully to assess the invasion of cells through the basement membrane, mimicking early invasive stages of carcinomas and melanoma10,11,12. The CAM is comprised of upper chorionic epithelium, intervening mesenchyme, and lower allantoic epithelium. The chorionic epithelium is structurally similar to human epithelium10,13 in that the collagen-IV-rich basement membrane simulates the basement membrane that separates the oral epithelium from the underlying connective tissue. Since the first tumor grafts were performed in the CAM in 191314, many adaptations of the method were developed to allow for the assessment of angiogenesis15,16,17, tumor progression, and metastasis18. Importantly, the technique of grafting tumors onto the CAM has changed very little, but the applications are continuously evolving. Assays of increasing complexity have been published, including drug screening19, bone tissue engineering20, and nanoparticle-based anticancer drugs21.
Our laboratory uses a CAM-DRG model in which a mammalian DRG is isolated and grafted onto the surface of the upper CAM. After the DRG becomes incorporated in the CAM, HNC cells are grafted near the DRG and allowed to interact with the DRG before the entire in vivo system is harvested and analyzed. Importantly, the system allows ex-vivo visual observation of both the DRG and tumor by fluorescence labeling of DRG and tumor cells. This protocol comprises multiple steps with different levels of complexity performed within 17 days, from incubating eggs to harvesting the CAM (Figure 1). Cells expressing different proteins of interest can be tested in this model to elucidate the molecular pathways responsible for nerve invasion in cancer, and also for screening drugs to directly target neural invasion. Cells pre-treated with a candidate drug can be grafted on the CAM and the occurrence of PNI investigated in comparison to untreated controls. In fact, the CAM model has been used for drug screening as an intermediate step between in vitro studies and pre-clinical in vivo trials in rodents19.
The experimental design will vary with the hypothesis. For instance, if testing the role of a specific protein on PNI, the experimental group would include DRG grafted with tumor cells overexpressing the protein, while the control group should include DRG with cells stably transfected with empty vector. Several different experimental designs can be used to address specific questions.
Protocol
Ethics statement: All experiments using rats in this protocol are done in accordance with IACUC (Institutional Animal Care and Use Committee) rules from our institution. Experiments with eggs in this study are exempt from IACUC regulation.
1. Egg Incubation (estimated timing: 5 min, day zero)
- Get pathogen-free fertilized commercial Lohmann White Leghorn eggs, preferably on the first day post-fertilization. Incubate six eggs per experimental group in an egg humidifying incubator at 38 °C and 54% humidity for 8 days with hourly rotation. Use regular rotation of the eggs to prevent the embryo from sticking to the egg membranes.
NOTE: Before incubation, keep the eggs in an 18 °C refrigerator to halt embryo development for a maximum of 1 week.
2. Harvest and preparation of DRGs (estimated timing: 2 h, day 8)
NOTE: Experiments with mice and rats require approval from the (IACUC). In some countries, the use of chicken eggs also requires approval.
- Get six to seven week-old Sprague Dawley rats ( ~200 g in weight) to extract DRGs.
NOTE: One rat should yield ~40 cervical and thoracic DRGs. Mouse DRG also integrates in the CAM, however the conditions for this species need to be optimized independently. - In a laminar flow cabinet, harvest DRGs from cervical and thoracic regions following the protocol for mouse DRG extraction published elsewhere22. Follow Figure 2 for orientation on how to harvest DRGs.
- Euthanize the rat by cardiac puncture after administration of Ketamine/ Xylazine injected intraperitoneally. Clean the rat skin with 70% ethanol and remove the rat spine using a scissor. Do not perform cervical dislocation because this would damage the cervical DRGs.
- Separate the cervical, thoracic and lumbar regions with the same scissor, following the schematic anatomic representation and gross images provided in the Figure 2A-D. Place the spine sections in a 10 cm culture dish with 1x PBS to keep tissues wet.
- With a delicate bone scissor, open the vertebral bones in the dorsal and ventral aspects, separating the spine in two lateral halves (Figure 2E-F). Place the tissue sections in a clean 10 cm dish with fresh 1x PBS.
- Using forceps, gently detach the spinal cord from the vertebral bones to visualize the DRGs (Figure 2G).
- With fine forceps held underneath each DRG, grasp it and pull it out from the bone cavity in which it is lodged. Do not hold the DRG directly because this will cause tissue damage. Do not trim the axon bundles from the DRG (Figure 2H).
NOTE: Avoid using lumbar DRGs since these have reduced integration in the CAM. For DRG region location, follow the schematic illustration and gross anatomic images on Figure 2A-D.
- Immediately after harvesting, place each DRG into DMEM culture medium supplemented with 2% Penicillin/Streptomycin (Pen/Strep) and 10% heat-inactivated Fetal Bovine Serum (FBS) to help prevent bacterial contamination of the DRGs. Group all DRGs in the same 6 cm culture dish with 4 mL of culture medium.
- After harvesting all DRGs, transfer them to a new culture dish with DMEM culture medium supplemented with 2% Pen/Strep plus 10% FBS and containing 1.25 µg/mL of red fluorescent dye. Incubate for 1 h in the cell culture incubator. During this time, prepare the eggs to receive the DRG as described below (step 3).
NOTE: The interval between harvesting DRGs and completion of fluorescence labeling should be sufficient to prepare the eggs; DRGs can be kept for a few hours in the incubator.
3. Preparation of eggs for DRG grafting (estimated timing: 1 h for a dozen eggs, day 8)
- In a laminar flow cabinet, dim the light and transilluminate the eggs to check for viability and embryonic phase. Exclude eggs with poor vasculature, non-fertilized eggs, or eggs not consistent with day 8 post-fertilization. Hold the egg gently with the naturally-occurring air sac toward the light source (Figure 3A).
- With a pencil, mark the egg shell to receive the openings (Figure 3A-B).
- First, identify the attachment of the developing embryo to the CAM as a dark moving vessel attached to the egg membrane and mark this area to avoid interventions in this region.
- Second, choose the operating window area as a well vascularized area at least 2 cm from the embryo attachment and draw a 1.5 cm diameter circle. Approximately 1 cm from the operating window, draw a 0.5 cm square in a less vascularized area.
- Third, draw the air sac region to exclude it from the operation area. Mark the middle of the air sac with a cross.
- With a rotary tool and engraving drill, 3 mm in diameter, drill the egg shell in the marked square (Figure 3C). Use blunt forceps to remove the egg shell without removing the outer egg shell membrane (the white membrane right under the shell) (Figure 3D). Work carefully to avoid accidental perforation of this membrane.
- Using the same drill as in step 3.3, make a pinpoint perforation in the marked cross in the air sac area to allow air flow into the egg (Figure 3E). Be careful not to apply too much pressure to the egg, to avoid breaking or damaging it.
- Place 30 µL of HBSS in the square opening, over the intact outer egg shell membrane (Figure 3E). With a 30-G syringe needle, make a pinpoint perforation in the outer membrane in this square area (Figure 3F).
- Place the egg in the light source to visualize the air sac. Apply pressure to an eyedropper rubber bulb and place it in the small perforation made in the air sac area (step 3.4). Release pressure in the bulb until you see separation of the two membranes in the operating window area (Figure 3G); repeat this step as many times as you need to achieve complete separation of the membranes in the operating window area.
- Repeat steps 3.1-3.6 for all eggs.
- Using the same drill as in step 3.3, drill the circular operating window being careful not to rupture the outer egg shell membrane (Figure 3H). Clean the egg surface by gently sticking an adhesive tape to remove all loose particles.
- With blunt forceps, remove the egg shell from the drilled area (Figure 3I-J). Next, with the same forceps, remove the outer egg shell membrane (Figure 3K), being careful not to introduce small shell particles inside the egg to minimize contamination.
- Identify the CAM approximately at 1 cm depth from the egg surface. Cover each opened egg temporarily with paraffin wax membrane to avoid contamination (Figure 3L).
- Repeat steps 3.8-3.10 for all the eggs. Place the eggs back in the egg incubator without rotation until the DRGs are ready for grafting.
4. Grafting DRG on the CAM (estimated timing: 40 min, day 8)
- Prepare a 6 cm culture dish with HBSS medium, to wash the DRGs before implantation. Bring the prepared eggs to the cell culture laminar flow cabinet. Remove the paraffin membrane from the egg (Figure 4A).
- With fine sterile forceps, gently grasp one DRG from inside the culture medium. Dip it into the HBSS medium to remove the excess medium that contains the fluorescent dye. Hold the DRG very gently; otherwise, it will stick to the forceps.
- Place the DRG on the CAM, being careful not to puncture the membrane (Figure 4B-C). If necessary, use another pair of forceps to help detach the DRG from the tip of the forceps when placing it on the CAM.
NOTE: Keeping the DRG wet with HBSS medium will also facilitate detachment from the forceps. - Cover the egg with a sterile transparent film dressing. Cover all the windows and punctures made in the egg shell to avoid bacterial contamination (Figure 4D).
- After grafting DRGs in all eggs, incubate the eggs in a humidifying incubator at 38 °C and 54% humidity for 2 days, without rotation.
5. Grafting tumor cells on the CAM (estimated timing: 1 h 30 min, day 10)
- At 48 h before grafting the cells, plate the cells needed in culture plates. Calculate 0.5 to 1 x 10⁶ cells per egg for UM-SCC-1 cells in order to generate three dimensional tumors in the CAM. Be aware that cell number may vary by cell line.
- Aspirate medium and add DMEM culture medium supplemented with 1% Pen/Strep plus 10% FBS and 2.5 µg/mL of green fluorescent dye. Incubate for 1 h at 37 °C in the cell culture incubator. Then, check fluorescence intensity on the microscope, aspirate medium, wash once with 1x PBS, and add 0.25% trypsin for up to 10 min. Neutralize trypsin with DMEM supplemented medium.
- Centrifuge at 250 x g for 4 min to form a cell pellet. Aspirate DMEM medium and re-suspend in HBSS to wash the excess fluorescent dye. Count cells using a hemocytometer.
- Bring the eggs to the cell culture laminar flow cabinet. With scissors and forceps, open the transparent film dressing that covers the egg (Figure 4E-F).
- Centrifuge the calculated number of cells again, aspirate the HBSS medium and re-suspend at a final concentration of 0.5 to 1x10⁶ cells per 5 µL of the same medium (Figure 4G). Prepare the amount needed for the total number of eggs (5 µL of cell suspension per egg).
- Place 5 µL of cell solution onto the CAM, about 2 mm from the DRG (Figure 4H). Keep uniform distances between the DRG and cells. Be very careful not to disturb the egg to minimize spreading of the cells.
NOTE: To start cell implantation, choose eggs on which the CAM surface is visually dry. If the surface is too wet, cells can spread and do not form regular tumors. - Cover the egg with a new film dressing as in step 4.4. Graft the cells in all eggs. Incubate the eggs in a humidifying incubator at 38 °C and 54% humidity for 7 days, without rotation.
6. Harvesting the CAM (estimated timing: 1 h for dozen eggs, day 17)
- Prepare 6-well plates with 4% PFA (paraformaldehyde) pH7.0, one well per egg, 2 mL per well.
- Bring the eggs to a laboratory bench. Using a needle attached to a syringe to perforate the film dressing, drop around 300 µL of PFA over the CAM to slightly stiffen the CAM, thus facilitating the harvesting process. Repeat this for all eggs.
- With a scissor, remove the upper half of the egg shell (where the operating window is located) with the CAM attached to it (Figure 4I). Reduce the size of this half to approximately 3 cm in diameter, keeping the portion of the CAM where DRG and tumor cells were grafted in the center (Figure 4J). Grasp the CAM with fine forceps and detach it from the egg shell while placing it into the PFA. Orient the DRG and cancer cells facing upwards (Figure 4K-L).
NOTE: The 3 cm area should include both the DRG and cells. The DRG is easily seen as a small lump attached on the CAM, however tumor cells are sometimes difficult to identify on gross exam. - Alternatively, with a scissor, widen the operating window removing the egg shell from the top of the egg while keeping the CAM in place; remove approximately 1 cm beyond the operating window (Figure 4M) and identify the DRG and cells on the CAM (Figure 4N-O). With delicate fine forceps, hold the CAM at one of the edges and lift it gently. With sharp delicate scissors, gently cut the CAM to remove a circular area, approximately 3 cm in diameter (Figure 4P), and place the CAM in PFA with DRG and cancer cells facing upwards.
NOTE: Avoid stretching or holding the CAM with forceps in multiple places to minimize tissue damage that may generate microscopy artifacts. - Place each CAM membrane in one well (Figure 4L). Gently grasp the edges of the CAM to spread the tissue open in the PFA or gently shake the plate until the CAM is unfolded, to avoid fold artifacts.
- Euthanize the embryo (day 17) by quick decapitation. Fix the harvested tissues in PFA for 4 h at room temperature. After fixation, replace PFA with 1x PBS and store tissues in PBS at 4 °C until embedding in paraffin for sectioning. Avoid over-fixation that will damage the delicate vasculature of the CAM.
- Using a fluorescence stereomicroscope, photograph the membranes within 2 days after harvesting to avoid losing fluorescent signals.
Results
When optimized, this method has near 100% DRG integration in the CAM. Representative results of DRG integration are shown in Figure 5A-B. The integration of DRG in the CAM is important since it provides viability to the DRG tissue during the experiment. Microscopically, the DRG is seen within the connective tissue of the CAM (H&E stain). Blood vessels are often seen inside the DRG tissue, suggesting that the CAM blood supply is nurturing the grafted tissue. Implanted tumors are also identified on the CAM by H&E; depending on how much invasion is present, tumors might present with none to numerous tumor islands invading the connective tissue (Figure 5C-D). The representative Figure 5E-F shows the harvested CAM on brightfield imaging and merged fluorescence. UM-SCC-1 cells overexpressing Galanin receptor 2 presented increased invasion of the DRG in comparison to control cells (Figure 5G-H). Cancer-DRG interaction is observed as cancer cells presenting directional invasion toward the DRG (Figure 5H).
Data analysis is performed in different ways. The directional invasion of cancer cells toward the DRG is observed as a dichotomous variable and the number of eggs presenting this pattern of invasion is counted in each group. Statistical differences between groups are calculated using a binomial test of proportions. The proximity between cancer cells and DRG, and tumor area are measured using ImageJ6 and differences between groups are assessed using Student`s t test. To assure accuracy with ImageJ analysis, all the images from the same experiment should be taken on equal light and exposure settings. After adjusting image threshold and brightness of all images using same criteria, the analyze particles tool is used to measure tumor area and the linear measurement tool measures tumor-DRG distances. It is important to use constant setup of size of particles analyzed for all images across different groups. In some instances, tumors grow thicker and can be manually measured with a digital caliper, allowing for a volume measurement.
Using sections of paraffin-embedded CAM tissue, H&E stain or immunohistochemistry for epithelial cells (anti-cytokeratin antibody reactive for human species) can be performed, allowing for assessment of invasion within the connective tissue. Invasion is quantified as the number of tumor islands in the connective tissue per egg. Immunofluorescence for collagen IV can be used to highlight the basement membrane. Also, if using GFP-labeled cancer cells, identification of these cells in the tissue sections is facilitated without an immunohistochemistry for cytokeratin. Metastasis and angiogenesis analysis in CAM experiments are discussed elsewhere10,17.
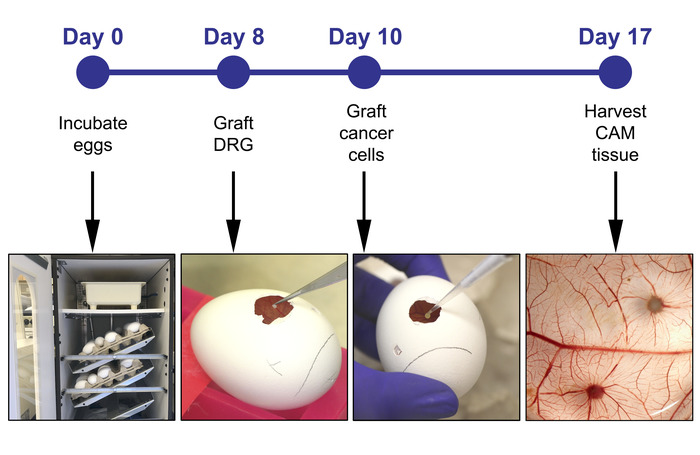
Figure 1: Experiment timeline including the major steps on days 0, 8, 10 and 17. Please click here to view a larger version of this figure.
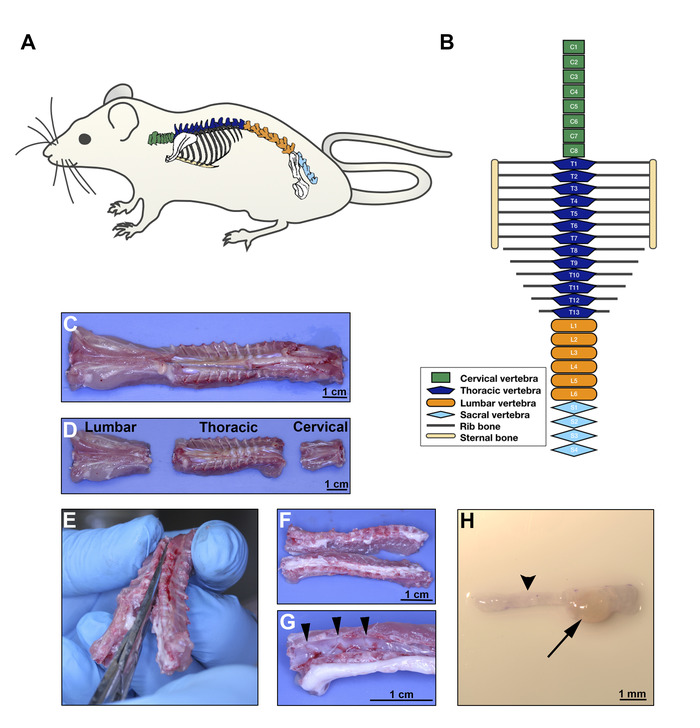
Figure 2: DRG extraction on day 8. A. Rat schematic illustrating the anatomical location of the spine. B. Diagram of the rat vertebrae configuration showing different body regions; green for cervical, dark blue for thoracic, orange for lumbar and light blue for sacral vertebrae. C-D. Ventral aspect of the rat spine after surgical excision; separation of the regions as illustrated in B. E. Dissection of the vertebrae to open the spinal cord canal, separating the vertebral bodies into two lateral sections containing the DRGs. Section should cut through the dorsal and ventral aspect of each vertebral bone at the midline. F. Gross aspect of opened thoracic spine. G. After the spinal cord is displaced, DRGs are easily visible in the vertebral canals (arrow heads pointing 3 DRGs). H. Stereomicroscopic image of one DRG (arrow) with the corresponding axon bundles (arrow head). Scale bars: C, D, F, and G, 1 cm; H, 1 mm. Please click here to view a larger version of this figure.
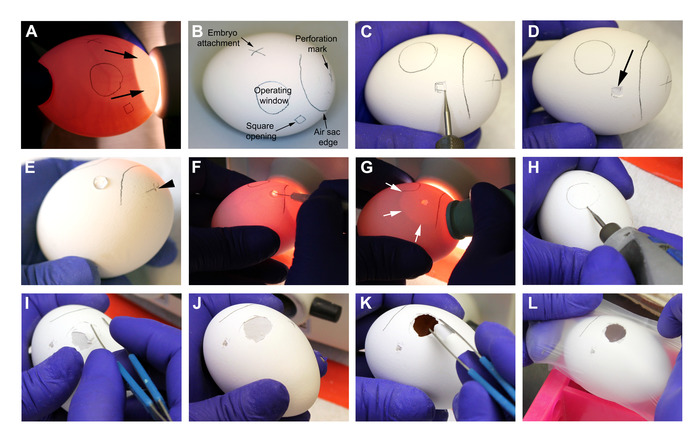
Figure 3: Preparation of the eggs on day 8. A-B. Identification of egg vasculature and markings prior to the procedure. Arrows on A point to the naturally-occurring air sac. C-D. Drilling and opening of the egg shell on the square opening mark. Arrow on D points to the intact outer egg shell membrane after removing the shell with the help of blunt forceps. E. The marked cross on the air sac is perforated with the drill to allow flow of air into the egg (arrow head). 30 µL of HBSS medium is placed onto the outer egg shell membrane on the square opening. F. With a fine syringe needle, the outer egg shell membrane is perforated where the HBSS was previously placed. G. Pressure is applied to a rubber eyedropper bulb while attaching it to the perforation drilled on the air sac. When finger pressure is released, air is vacuumed, generating an artificial air sac (white arrows) that should extend to the operating window. H. The edges of the operating window are drilled in an almost parallel position to the egg shell, to avoid accidental perforation. I-J. Removal of the egg shell with blunt forceps. K. Remove the outer egg shell membrane with blunt forceps, being careful not to introduce particles on the CAM (observed at ̴1 cm below the surface). L. Eggs are covered temporarily with a paraffin wax membrane and put back in the incubator. Please click here to view a larger version of this figure.
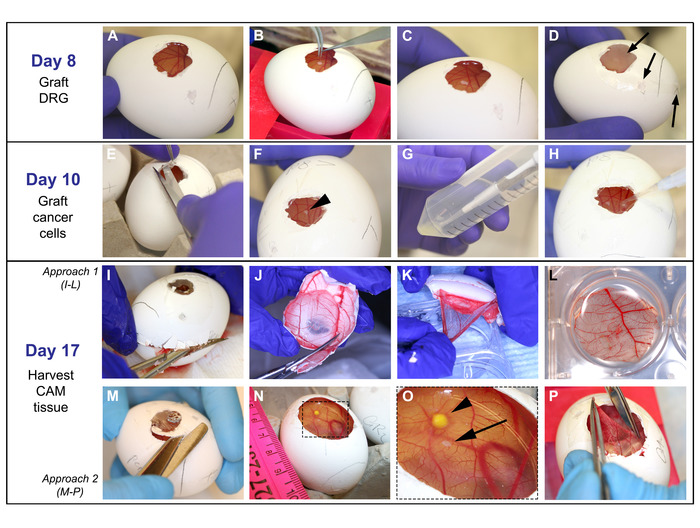
Figure 4: Grafting of DRG, cells, and harvesting of CAM: On day 8: A. CAM easily observed after paraffin wax membrane removal. B-C. With fine forceps, DRG is placed onto the CAM. D. Egg is covered with film dressing and put in the incubator; arrows point to the openings that are covered. On day 10: E-F. Film dressing is removed and DRG is located (arrow head on F). G-H. 5 µL of cell solution is dropped onto the CAM at a ~2 mm distance from the DRG. On day 17: I-L and M-P demonstrate two different approaches used to harvest the CAM. I. Egg shell is opened with a fine scissor starting on the air sac drilled perforation until the upper half of the egg is removed. J. Egg shell containing the CAM is reduced in size to approximately 3 cm. K-L. With fine forceps, CAM is detached from the egg shell and placed in PFA. M-O. Widening of the operating window is performed to visualize the DRG and cancer cells on the CAM. Arrowhead points to the tumor and arrow points to the DRG. P. The CAM is grasped with fine forceps, cut out with a sharp scissor, and placed in PFA as shown in L. Please click here to view a larger version of this figure.
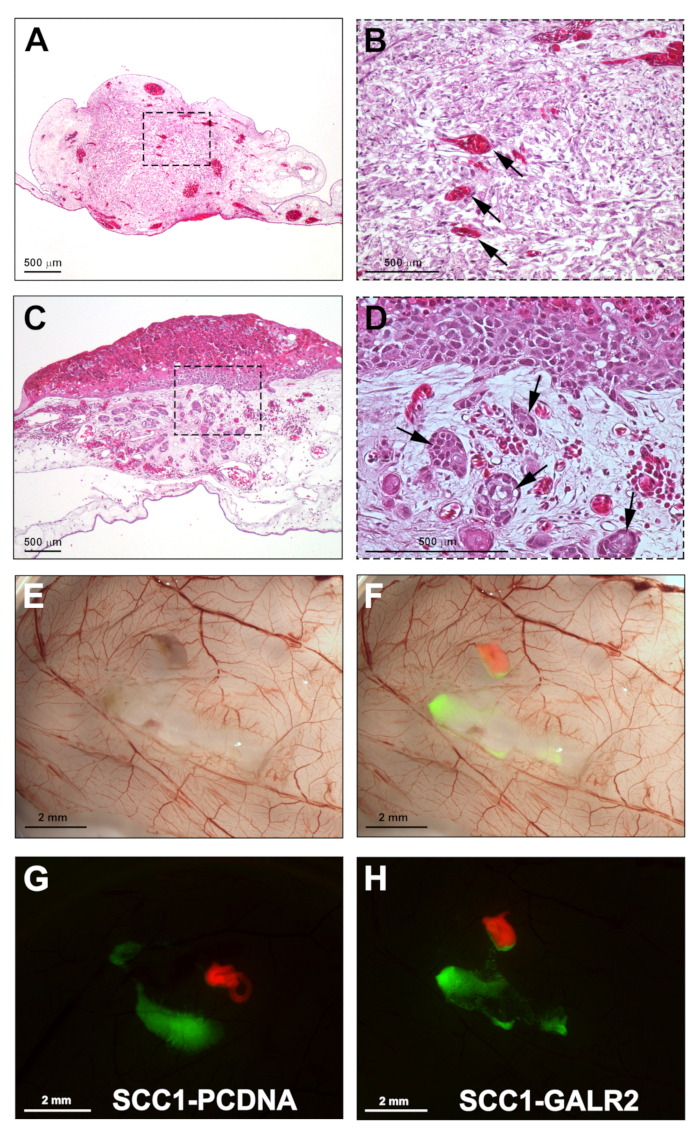
Figure 5: Representative results. A. H&E section showing integration of the DRG in the CAM. B. Higher magnification of A; arrows show CAM blood vessels in the DRG. C. UM-SCC-1 cells grafted onto the CAM and harvested four days after grafting (H&E stain). D. Higher magnification of C showing invasive tumor islands in the CAM connective tissue (arrows). E. Gross stereomicroscopic image of the CAM grafted with UM-SCC-1-GALR2 cells and rat DRG, harvested on day 17. F. Merged fluorescence and brightfield images highlighting the DRG labeled in red and cancer cells labeled in green. G-H. Fluorescence stereomicroscopy of the CAM grafted with DRG and UM-SCC-1-GALR2 versus control cells, illustrating directional invasion of UM-SCC-1-GALR2 cells to the DRG (H). Scale bars: A-D, 500 µm; E-H, 2 mm. Please click here to view a larger version of this figure.
| Step | Problem | Reason | Solution | ||||||
| 3.2.1 | Unable to identify the embryo attachment. | Attachment position is difficult to see while egg is still. | Rotate the egg quickly sideways to be able to see a long vessel attached to the egg membrane. | ||||||
| 3.3 & 3.8 | Perforation of the outer egg shell membrane while drilling. | Wrong positioning of the drill. | Position the drill almost parallel to the egg shell while drilling. If membrane is perforated in step 3.3 , there is no need to perform further perforation with needle as stated in step 3.5. If bleeding happens, discard the egg. | ||||||
| 4.3 | DRG sticks to the forceps. | DRG is dry. | Wet DRG again in HBSS and/or use a fine needle to help detach DRG from forceps. | ||||||
| 5.2 | Cells are not perfectly labeled with fluorescent dye. | Incubation time. Some cells require more time to label. | Keep cells for an additional hour in media with fluorescent dye. | ||||||
| 5.6 | Air bubble on the cell drop. | Using all the fluid in the pipette tip. | Load 1µL more than the desired volume and do not use the final µL of the pipette when implanting cells. This will avoid air bubbles in the cells mix. | ||||||
| 6.3 | Unable to identify DRG or cells when harvesting the CAM. | Small DRG, DRG got displaced, cancer cells spread. | If DRG is not seen, harvest a larger area of the CAM and place into a larger container for fixation. Check DRG and cell position under fluorescence in a stereo microscope, and then trim the CAM to a smaller size for paraffin embedding. | ||||||
Table 1: Troubleshooting table
Discussion
The CAM-DRG in vivo model presented here addresses the deficits of previous models by demonstrating nerve-tumor interaction before physical invasion of the nerve by tumor cells. Most in vivo studies of PNI focus on tumor spread and inhibition of motor function, and depend upon direct injection of tumor cells into sciatic nerves23,24,25. The sciatic nerve injection is an in vivo model of PNI where cancer cells are injected into a mouse or rat sciatic nerve where the tumor subsequently grows. Injection models are useful to show destructive tumor progression and pain resulting from tumor cells within nerves. The sciatic nerve model is also suitable for the study of factors that allow cancer cells to thrive in the nerve but lacks the ability to evaluate the early phase of PNI, because it introduces cells directly into the nerve, bypassing nerve sheaths. In a different approach, surgically implanted orthotopic tumor grafts were used to characterize the importance of adrenergic and cholinergic nerve fibers in promoting prostate cancer progression, thus suggesting a prominent role of nerves in tumor progression26. This model consisted of chemical ablation of murine sympathetic and parasympathetic nerves. The parasympathetic fibers infiltrated tumor tissues, a process related to PNI, but the model was not specifically used to assess physical interactions between the nerve and tumor. The CAM-DRG model allows investigation of interactions between the nerve and cancer during PNI. Furthermore, murine models are expensive and time-consuming when compared to the CAM model. We suggest using the CAM-DRG model for mechanistic studies of PNI.
Some advantages to the CAM-DRG approach include assessment of PNI and other phenotypes, such as tumor growth, metastasis, and angiogenesis. Identification of human DNA on the lower CAM and/or in the liver can be used for detection of metastasis of human cancer cell lines10, a more sensitive experimental approach compared to tissue sectioning and staining, which may not reveal small metastases.
The CAM-DRG method has some limitations, including the short observation time frame. The immune system of the embryo is physiologically active by day 1827, when rejection and an inflammatory process may take place, limiting the experimental time. It is also important to consider the distance when grafting tumor cells close to the DRG; larger DRG-cancer distances might impair the molecular interactions between tumor cells and nerve, or could delay the physical contact between both components of the model. Also, if the embryos are older than stipulated in this protocol, embryo movements might displace the tumor cells. Therefore, it is important to use eggs consistent with day 10 post-fertilization for cell grafting.
Since the immune system is not fully developed before day 1827, the tumor microenvironment in the CAM is similar to that of the immunosuppressed murine models often used for cancer studies. Therefore, this model is not useful to assess the role of immune cells in tumor progression. Another limitation is the restricted availability of reagents for chicken species, such as antibodies, cytokines and primers.
Accurately performing this protocol requires practice; however, it can be done by a laboratory member without need for a specialized core facility. Drilling of the egg shell requires training. Practicing on grocery (non-fertilized) eggs is recommended before attempting this model for the first time. High embryonic survival and success of the model can be achieved if some critical steps to avoid infection are followed: appropriate antibiotic prophylaxis of DRGs in 2% Pen/Strep, working in a laminar flow cabinet, and avoiding dispersion of egg shell particles onto the CAM. It is also crucial to keep stable humidity during the total egg incubation time. We recommend increasing the number of eggs per group until the technique is mastered. The most frequent problems for inexperienced laboratory personnel are egg contamination and inaccurate technique for cell grafting.
DRG harvesting also requires training; practice in harvesting DRGs for in vitro experiments8 before attempting the in vivo model is recommended. The in vitro DRG culture is an opportunity to optimize conditions and improve technique to shorten the duration of DRG extraction. Special attention to harvesting technique is required when grasping the DRG with forceps. The DRG should not be held directly; pressure should be applied underneath it. We recommend the use of magnifying lens to better visualize the DRG during extraction.
Importantly, when performing this model for the first time, all conditions should be optimized for the desired cell line. This model was optimized for rat DRG and the HNC cell line UM-SCC-1. The use of mouse DRG and other cancer cell types may require optimization. With a higher concentration of grafted cells, tumors tend to grow thicker and stiffer, which facilitates tumor measurements. Taking into consideration multiple eggs for each group and an appropriate concentration of cells for each egg, several million cells may be required for each experiment. To facilitate planning, knowledge of the doubling time of the cells should be taken into consideration. For some critical steps in this protocol, a troubleshooting table is provided (Table 1).
Disclosures
The authors declare no competing interests.
Acknowledgements
This work was supported by NIH/NIDCR grants DE027551 and DE022567 (NJD).
Materials
| Name | Company | Catalog Number | Comments |
|---|---|---|---|
| 0.25% Trypsin-EDTA (1x) | Gibco | # 25200-056 | |
| ACE light source | SCHOTT North America, Inc. | Used to transilluminate the eggs | |
| CellTracker Green CMFDA fluorescent dye | Life Technologies | # C7025 | Reconstitute 50µg in 20µL of DMSO and stock at -20oC. Use 1µL of stock solution/mL of culture medium. |
| CellTracker Red CMTPX fluorescent dye | Life Technologies | # C34552 | Reconstitute 50µg in 40µL of DMSO and stock at -20oC. Use 1µL of stock solution/mL of culture medium |
| Cordless rotary tool | DREMEL | # 866 | Used to drill the egg shell |
| DMEM (1x) | Gibco | # 11965-092 | Dulbeecco`s Modified Eagle Medium |
| DMSO | Fisher Bioreagents | # BP231-100 | Dimethyl Sulfoxide |
| Dumont # 5 fine forceps | Fine Science Tools (FST) | # 11254-20 | Used to harvest DRG |
| Egg incubator | GQF Digital Sportsman | # 1502 | Egg incubator equipped with automatic rotator, digital thermostat, temperature and humidity controls |
| Engraving cutter | DREMEL | # 108 | Used to drill the egg shell |
| Extra fine Graefe forceps, curved | Fine Science Tools (FST) | # 11151-10 | Used to graft DRG onto the CAM on day 8 and to harvest CAM tissue on day 17 |
| Extra fine Graefe forceps, straight | Fine Science Tools (FST) | # 11150-10 | Used to graft DRG onto the CAM on day 8 and to harvest CAM tissue on day 17 |
| Fertilized Lohmann White Leghorn eggs | Fertilized eggs at early fertilization days, preferably on first day post-fertilization. Eggs used in this protocol are from Michigan State University Poultry Farm. | ||
| Filter Forceps | EMD Millipore | # XX6200006P | Blunt forceps used to remove the egg shell |
| Fine surgical straight sharp scissor | Fine Science Tools (FST) | #14060-09 | Used to harvest the CAM tissue on day 17 |
| HBSS (1x) | Gibco | # 14025-092 | Hank`s Balanced Salt Solution |
| HI FBS | Gibco | # 10082-147 | Heat-inactivated Fetal Bovine Serum |
| Paraffin wax membrane | Parafilm laboratory film | # PM-996 | Used to temporarily cover the egg openings until DRG grafting on day 8 |
| PBS (1x) pH 7.4 | Gibco | # 10010-023 | Phosphate Buffered Saline |
| Pen/Strep | Gibco | # 15140-122 | 10,000 Units/mL Penicilin, 10,000 µg/mL Streptomycin |
| PFA (paraformaldehyde solution) | Sigma-Aldrich | # P6148-1KG | Dilute in water to make a 4% PFA solution |
| Sprague Dawley rats (females) | Charles River laboratories | Strain code: 001 | 6-7 weeks old (190-210g in weight) |
| Tegaderm Transparent Film Dressing | 3M | # 9505W | Sterile, 6x7cm, used to cover the egg openings during incubation |
References
- Schmitd, L. B., Scanlon, C. S., D'Silva, N. J. Perineural Invasion in Head and Neck Cancer. Journal of dental research. 97 (7), 742-750 (2018).
- Liebig, C., Ayala, G., Wilks, J. A., Berger, D. H., Albo, D. Perineural invasion in cancer: a review of the literature. Cancer. 115 (15), 3379-3391 (2009).
- Schmitd, L. B., et al. Redefining Perineural Invasion: Integration of Biology With Clinical Outcome. Neoplasia (New York, N.Y). 20 (7), 657-667 (2018).
- Chinn, S. B., et al. Impact of perineural invasion in the pathologically N0 neck in oral cavity squamous cell carcinoma. Otolaryngology--head and neck surgery : official journal of American Academy of Otolaryngology-Head and Neck Surgery. 149 (6), 893-899 (2013).
- Tai, S. K., Li, W. Y., Yang, M. H., Chu, P. Y., Wang, Y. F. Perineural invasion in T1 oral squamous cell carcinoma indicates the need for aggressive elective neck dissection. The American journal of surgical pathology. 37 (8), 1164-1172 (2013).
- Scanlon, C. S., et al. Galanin modulates the neural niche to favour perineural invasion in head and neck cancer. Nature communications. 6, 6885(2015).
- Amit, M., et al. Upregulation of RET induces perineurial invasion of pancreatic adenocarcinoma. Oncogene. 36 (23), 3232-3239 (2017).
- Huyett, P., Gilbert, M., Liu, L., Ferris, R. L., Kim, S. A Model for Perineural Invasion in Head and Neck Squamous Cell Carcinoma. Journal of visualized experiments : JoVE. (119), (2017).
- Ayala, G. E., et al. In vitro dorsal root ganglia and human prostate cell line interaction: redefining perineural invasion in prostate cancer. The Prostate. 49 (3), 213-223 (2001).
- Liu, M., et al. The Histone Methyltransferase EZH2 Mediates Tumor Progression on the Chick Chorioallantoic Membrane Assay, a Novel Model of Head and Neck Squamous Cell Carcinoma. Translational oncology. 6 (3), 273-281 (2013).
- Busch, C., Krochmann, J., Drews, U. The chick embryo as an experimental system for melanoma cell invasion. PloS one. 8 (1), e53970(2013).
- Li, M., et al. The In Ovo Chick Chorioallantoic Membrane (CAM) Assay as an Efficient Xenograft Model of Hepatocellular Carcinoma. Journal of visualized experiments : JoVE. (104), (2015).
- Ota, I., Li, X. Y., Hu, Y., Weiss, S. J. Induction of a MT1-MMP and MT2-MMP-dependent basement membrane transmigration program in cancer cells by Snail1. Proceedings of the National Academy of Sciences of the United States of America. 106 (48), 20318-20323 (2009).
- Murphy, J. B. TRANSPLANTABILITY OF TISSUES TO THE EMBRYO OF FOREIGN SPECIES : ITS BEARING ON QUESTIONS OF TISSUE SPECIFICITY AND TUMOR IMMUNITY. The Journal of experimental medicine. 17 (4), 482-493 (1913).
- Ribatti, D., Nico, B., Vacca, A., Presta, M. The gelatin sponge-chorioallantoic membrane assay. Nature. 1 (1), 85-91 (2006).
- Auerbach, R., Arensman, R., Kubai, L., Folkman, J. Tumor-induced angiogenesis: lack of inhibition by irradiation. International journal of cancer. 15 (2), 241-245 (1975).
- Banerjee, R., et al. The G protein-coupled receptor GALR2 promotes angiogenesis in head and neck cancer. Molecular cancer therapeutics. 13 (5), 1323-1333 (2014).
- Ossowski, L., Reich, E. Experimental model for quantitative study of metastasis. Cancer research. 40 (7), 2300-2309 (1980).
- Nowak-Sliwinska, P., Segura, T., Iruela-Arispe, M. L. The chicken chorioallantoic membrane model in biology, medicine and bioengineering. Angiogenesis. 17 (4), 779-804 (2014).
- Moreno-Jimenez, I., et al. The chorioallantoic membrane (CAM) assay for the study of human bone regeneration: a refinement animal model for tissue engineering. Scientific reports. 6, 32168(2016).
- Vu, B. T., et al. Chick chorioallantoic membrane assay as an in vivo model to study the effect of nanoparticle-based anticancer drugs in ovarian cancer. Scientific reports. 8 (1), 8524(2018).
- Sleigh, J. N., Weir, G. A., Schiavo, G. A simple, step-by-step dissection protocol for the rapid isolation of mouse dorsal root ganglia. BMC research notes. 9, 82(2016).
- Cavel, O., et al. Endoneurial macrophages induce perineural invasion of pancreatic cancer cells by secretion of GDNF and activation of RET tyrosine kinase receptor. Cancer research. 72 (22), 5733-5743 (2012).
- Guo, K., et al. Interaction of the sympathetic nerve with pancreatic cancer cells promotes perineural invasion through the activation of STAT3 signaling. Molecular cancer therapeutics. 12 (3), 264-273 (2013).
- Deborde, S., et al. An In Vivo Murine Sciatic Nerve Model of Perineural Invasion. Journal of visualized experiments : JoVE. (134), (2018).
- Magnon, C., et al. Autonomic nerve development contributes to prostate cancer progression. 341 (6142), Science. New York, N.Y. 1236361(2013).
- Ribatti, D. Chick embryo chorioallantoic membrane as a useful tool to study angiogenesis. International review of cell and molecular biology. 270, 181-224 (2008).
Reprints and Permissions
