Here we present a readily applicable protocol to assess the storage stability of extracellular vesicles, a group of naturally occurring nanoparticles produced by cells. The vesicles are loaded with glucuronidase as a model enzyme and stored under different conditions. After storage, their physicochemical parameters and the activity of the encapsulated enzyme are evaluated.
Method Article
Evaluation of the Storage Stability of Extracellular Vesicles
In This Article
Summary
Abstract
Extracellular vesicles (EVs) are promising targets in current research, to be used as drugs, drug-carriers, and biomarkers. For their clinical development, not only their pharmaceutical activity is important but also their production needs to be evaluated. In this context, research focuses on the isolation of EVs, their characterization, and their storage. The present manuscript aims at providing a facile procedure for the assessment of the effect of different storage conditions on EVs, without genetic manipulation or specific functional assays. This makes it possible to quickly get a first impression of the stability of EVs under a given storage condition, and EVs derived from different cell sources can be compared easily. The stability measurement is based on the physicochemical parameters of the EVs (size, particle concentration, and morphology) and the preservation of the activity of their cargo. The latter is assessed by the saponin-mediated encapsulation of the enzyme beta-glucuronidase into the EVs. Glucuronidase acts as a surrogate and allows for an easy quantification via the cleavage of a fluorescent reporter molecule. The present protocol could be a tool for researchers in the search for storage conditions that optimally retain EV properties to advance EV research toward clinical application.
Introduction
EVs are membrane-bound nanoparticles produced by nearly all cell types. For mammalian cells, EVs can be subdivided into two main groups with distinct production pathways1,2. Membrane vesicles, with a size range from roughly 100-1,000 nm, are produced by direct budding from the cell membrane. Exosomes, sized 30-200 nm, are derived from multivesicular bodies formed by inward budding into endosomes that subsequently fuse with the cell membrane to release multiple exosomes at once. The main function of these vesicles is the transport of information between cells3. For this purpose, cargos such as RNA, DNA, and proteins are actively sorted into them. EVs can convey a variety of effects on their targets, with implications for both health and disease state. On one side, they mediate positive effects such as tissue regeneration, antigen presentation, or antibiotic effects, which makes them auspicious targets for their development as therapeutics4,5. On the other side, EVs can promote tumor vascularization6, induce bystander effects in stress responses7, and might play a role in autoimmune diseases8 and inflammatory diseases9. Thus, they might be a key component to a better understanding of many pathological effects. However, the presence of altered EVs in manifold diseases, such as cancer10,11,12 and cardiovascular disorders13, and their easy accessibility in blood and urine makes them ideal biomarkers. Finally, their good biocompatibility14 and their inherent targeting ability make EVs also interesting for drug delivery15. In this manuscript, we describe a protocol for the evaluation of the storage stability of EVs derived from mammalian cells, an important property that is still little investigated.
For the clinical development of EVs, there are still many obstacles to surmount16, including the evaluation of their therapeutic effects, production, purification, and storage17. While -80 °C is widely seen as the gold standard for EV storage18, the required freezers are expensive, and maintaining the required cold chain from the production to the patient can be challenging. Moreover, some reports indicate that storage at -80 °C still not optimally preserves EVs and induces a loss in EV functionality19,20. Other methods, such as freeze-drying21,22 or spray-drying23, have been proposed as potential alternatives to the frozen storage of EVs.
The optimal way of assessing storage stability would be to test the EVs in functional assays or by the evaluation of a specific marker, for instance, their antibacterial activity19. This is possible when the desired effect of the vesicles is known and when one distinct group of EVs is to be studied. If EVs from different cell sources are to be compared (e.g., for drug encapsulation) or if there is no known functional readout, it is no longer possible to assess changes due to storage in a direct manner.
On the other hand, simply evaluating changes in their physicochemical parameters, such as size, particle recovery, and protein concentration, does not always predict changes in EV activity, as has been shown in a recent patent20.
Here, we provide a readily applicable protocol for measuring the storage stability of EVs by assessing their physicochemical parameters combined with the activity of an encapsulated beta-glucuronidase enzyme as a surrogate for the cargo of the EVs. The loading of the enzyme is done by saponin incubation, a mild method established with EVs from different sources21,24,25. Saponin forms transient pores in the EV membrane, which allows enzyme uptake into the vesicle. As enzymes are prone to lose their activity if subjected to unfavorable storage conditions, they are an ideal surrogate for the evaluation of the preservation of functional cargoes of the EVs.
We have demonstrated that the application of this protocol to EVs derived from human mesenchymal stem cells (MSCs), human umbilical vein endothelial cells (HUVECs), and human adenocarcinoma alveolar epithelial cells (A549) indeed result in great differences in storage stability between different cell lines, which should be taken into consideration when choosing the EV source21.
Protocol
1. Cell culture and the production of cell-conditioned medium
- Generally, cultivate cells under the individual conditions required for the respective cell line.
- Cultivate the cells for 24-72 h in serum-free conditions or in medium containing EV-depleted fetal bovine serum (FBS).
NOTE: If EV-depleted FBS is used, employ a method proven to efficiently deplete the serum, to prevent contamination with bovine serum-derived EVs26. - Collect the medium from the flasks. Centrifuge at 300 x g for 10 min to pellet the cells. Carefully collect the cell-conditioned medium (CCM), without disturbing the pelleted cells. Preferably, use the CCM directly, or store it overnight at 4 °C.
NOTE: It is always preferable to use freshly produced CCM. If storage for longer time periods cannot be circumvented, all relevant parameters should be recorded in accordance with MISEV2018 guidelines26, and the potential biases of the results acquired need to be taken into consideration. - Example protocol for HUVECs
- Cultivate HUVEC cells for 120 h in EGM-2 medium containing FBS and other supplements.
- Cultivate HUVEC cells for 48 h in EBM-2 basal medium free of any additional supplements.
- Collect the medium from the flasks and perform the centrifugation step as indicated above (step 1.3). Typically, use 100 mL of medium for one EV-isolation.
2. Ultracentrifugation of CCM
- Immediately before ultracentrifugation (UC), centrifuge the CCM for 15 min at 3,000 x g and 4 °C to remove cell debris and large agglomerates.
- Carefully transfer the supernatant to the UC tubes. If using a fixed angle rotor, mark the orientation of the tubes in the centrifuge to facilitate the retrieval of the EV pellet after the UC. Centrifuge for 2 h at 120,000 x g, with a k-factor of 259.4.
- After UC, carefully discard the supernatant using a serological pipet, to avoid the disturbance of the pelleted EVs.
NOTE: The pellet might be invisible. - Add 200 µL of 0.2 µm-filtered phosphate-buffered saline (PBS) to the first tube and use PBS and the residual supernatant to resuspend the pellet by pipetting up and down. Transfer the resulting EV suspension to the next tube of the respective sample and use it for the resuspension. Proceed this way to resuspend all EVs of the sample in a final volume of approximately 300-350 µL.
- After resuspension, confirm the presence of particles by nanoparticle tracking analysis (NTA). Use the settings optimized for the given EV type, such as the settings below (step 2.5.1).
NOTE: The papers of Gardiner et al.27 and Vestad et al.28 contain valuable information on how to optimize the parameters for measuring EVs.- To reproduce the results described below, use instruments (e.g., NanoSight LM14) equipped with a green laser. Record three videos of 30 s with a screen gain of 1.0 and a camera level of 13. For analysis, use a screen gain of 1.0 and a detection threshold of 5.
- Use the pellet immediately, if possible; otherwise, store it at 4 °C overnight.
3. Glucuronidase encapsulation into EVs
- To the resuspended pellet, add beta-glucuronidase (10 mg/mL in PBS) to a final concentration of 1.5 mg/mL and saponin (10 mg/mL in H2O) to a final concentration of 0.1 mg/mL. Mix well by vortexing for 3 s.
- Incubate for 10 min at room temperature with intermitted mixing by gently flicking the tube. After incubation, directly purify by size-exclusion chromatography (SEC) (see section 5).
NOTE: Do not refreeze glucuronidase samples once thawed, to prevent enzyme degradation due to freezing.
4. Liposome production
- To prepare liposomes for comparison with EVs, dissolve 1,2-dimyristoyl-sn-glycero-3-phosphocholine (DMPC) and 1,2-dipalmitoyl-sn-glycero-3-phosphocholine (DPPC) in a 2:3 molar ration in chloroform to a final concentration of 5 mM. Prepare 1 mL aliquots in high-performance liquid chromatography (HPLC) vials and let them dry overnight to form a lipid film.
CAUTION: Chloroform is toxic and suspected to be cancerogenic. Take proper precautions when handling it. - Rehydrate the lipid-film with 1 mL of PBS containing 1.5 mg/mL glucuronidase. Heat it to 42 °C and vortex for 1 min. Heat the extruder assembly to 42 °C and extrude the lipid suspension 11x through a 200 nm polycarbonate membrane. Directly purify by SEC (see section 5).
5. Purification by SEC
- Prepare the SEC column using the following protocol.
- Use only fresh purified water and freshly prepared buffers. Filter all buffers through a 0.2 µm membrane filter and degas them to prevent the formation of air bubbles in the column.
- For the preparation of an SEC column, use agarose gel filtration-based matrix (e.g., Sepharose Cl-2b) or another SEC medium suitable to separate EVs and liposomes from protein impurities and excess enzyme. First, remove the 20% EtOH solution the medium is stored in, to prevent air bubble formation in the column. To this end, centrifuge the SEC medium at 3,000 x g for 10 min, remove the EtOH, and replace it with degassed water.
- Fill a glass column (with an inner diameter of 10 mm) with the SEC medium to the 15 mL mark.
NOTE: Volumes will differ for columns with different dimensions. Make sure to let the gel settle completely. - Before a run, equilibrate the column with at least two column volumes of PBS. To store the column, first wash it with one column volume of water, followed by at least two column volumes of 20% EtOH. After storage, wash the column first with one column volume of water before equilibrating with PBS.
- Use up to 400 µL of EV or liposome suspension in one separation. Collect fractions of 1 mL. After SEC, either store the purified EVs (see section 7) or subject them to a glucuronidase assay (see section 6).
- Confirm the separation of EVs and liposomes from contaminating proteins and free glucuronidase. To this end, correlate the particle concentrations of the collected fractions with the protein concentration and the glucuronidase activity.
- Assess the particle concentration by NTA (see 2.5)
- Assess the protein content by bicinchoninic acid (BCA) assay or another suitable protein quantification assay. Perform the assay according to the manufacturer’s protocol.
- Assess the glucuronidase activity by glucuronidase assay (see section 6).
- Optionally, assess the EV morphology by transmission electron microscopy (TEM) and scanning electron microscopy (SEM).
- For the preparation of TEM samples, add 10 µL of EV suspension to a TEM grid, incubate for 10 min, and then blot away any excess liquid using a filter paper. Perform the fixation for 10 min with 10 µL of 4% paraformaldehyde and blot away any excess. Wash 3x with water. Stain the vesicles by 20 s incubation with 30 µL of 1% phosphor-tungstic acid hydrate. After blotting away the excess, dry the vesicles overnight. Visualize by TEM.
CAUTION: Phospho-tungstic acid is highly caustic; thus, protect skin and eyes. - For SEM, fix the previously prepared TEM samples onto carbon disks and sputter them with a 50 nm thick gold layer. Visualize by SEM.
- For the preparation of TEM samples, add 10 µL of EV suspension to a TEM grid, incubate for 10 min, and then blot away any excess liquid using a filter paper. Perform the fixation for 10 min with 10 µL of 4% paraformaldehyde and blot away any excess. Wash 3x with water. Stain the vesicles by 20 s incubation with 30 µL of 1% phosphor-tungstic acid hydrate. After blotting away the excess, dry the vesicles overnight. Visualize by TEM.
6. Glucuronidase assay
- To allow a comparison between different samples and storage conditions by correlating particle number and enzyme activity, first measure the particle concentration of the sample by NTA (see step 2.5).
- Prepare a working solution of fluorescein di-β-D-glucuronide by adding 1 µL of the compound (10 mg/mL in H2O) to 199 µL of PBS. Add 25 µL of this solution to 125 µL of purified EVs to get a final concentration of 8.3 µg/mL. Pipet the sample into a black 96-well plate. Measure time point 0 h with a plate reader, using 480 nm as excitation and 516 nm as emission wavelength.
- Cover the plate tightly (e.g., with transparent plastic foil used for PCR plates) to minimize evaporation and incubate in the dark for 18 h at 37 °C. Measure the fluorescein production using the plate reader parameters listed in step 6.2.
7. Storage of EVs and liposomes
NOTE: For all storage purposes, it is advisable to use low-binding tubes to reduce EV loss due to adsorption.
- Follow the parameters in this section to reproduce the representative results given below. Use samples consisting of 400 µL of EV suspension.
- Store at 4 °C or -80 °C or proceed to steps listed below.
- Lyophilize the EVs.
- Add trehalose (40 mg/mL in H2O) up to a final concentration of 4 mg/mL to the purified EVs. Freeze the samples at -80 °C for at least 1 h.
- Lyophilize the samples using the following parameters. For main drying, set the shelf temperature to 15 °C and pressure to 0.180 mbar and leave the samples to dry for 46 h. For final drying, set the shelf temperature to 25 °C and pressure to 0.0035 mbar and leave the samples to dry for 2 h. Store the lyophilized samples at 4 °C.
- To rehydrate the samples, add H2O, equal to the amount of EV suspension present in the beginning (typically, 400 µL). Do not use any buffer for rehydration.
8. Analysis after storage
- To assess the enzyme activity, first remove the free glucuronidase, which may have leaked from the EVs during storage. Achieve this by an additional step of purification that is carried out either by SEC (see step 5) or asymmetric flow field-flow fractionation (AF4) (see step 8.1.2).
NOTE: Please be advised that both methods lead to a dilution of the EV sample; thus, use sufficient EV concentrations before storage to avoid moving below the NTA quantification limit. Expect a 1:10 dilution of the particles due to SEC or AF4.- For SEC purification, follow the protocol described above (see section 5).
- Perform AF4 purification.
- Set up the instrument using a small channel with a 350 µm spacer and a 30 kD molecular weight cut-off cellulose membrane. Place a 0.1 µm pore size filter between the HPLC pump and the AF4 channel. Use freshly prepared 0.1 µm-filtered PBS as the mobile phase to reduce the particle load and noise in the light-scattering detectors.
- Detect proteins using a UV detector set to 280 nm. To detect particles, use multiangle light scattering with the laser set to 658 nm.
- Use the following run method. Pre-focus for 1 min with a focus flow of 1 mL/min; then, inject 300 µL of the sample at a rate of 0.2 mL/min and keep up the focus flow for 10 min. After the injection, elute the sample at 1 mL/min while applying a cross flow that decreases from 2 mL/min to 0.1 mL/min over the course of 8 min. Elute for another 10 min without cross flow. Collect fractions of 1 mL, starting after 12.5 min and continuing until 27 min.
- Perform the glucuronidase assay as described above (see section 6).
- To assess the size and concentration, use the NTA as described above (see step 2.5).
- Optionally, perform TEM and SEM to assess the morphology of the EVs after storage (see 5.3).
Results
Figure 1 displays the storage characteristics of EVs isolated from HUVECs. EVs were isolated by UC, glucuronidase was encapsulated, and after SEC, the purified EVs were evaluated for their physicochemical properties by NTA. A sample of the vesicles was subsequently subjected to AF4 purification and the glucuronidase activity was measured.
The vesicles were then stored for 7 d at 4 °C or -80 °C and at 4 °C in lyophilized form, in the latter case with the addition of 4% trehalose. After storage, the vesicles were again measured by NTA, and after AF4, the remaining glucuronidase activity per particle was assessed.
The working principle of AF4 is based on the combination of laminar flow and an orthogonal crossflow through the porous membrane at the bottom of the AF4 channel, which differentially affects particles according to their size (Figure 2). Larger particles tend to be located closer to the membrane while smaller particles are located further up in the channel. Due to the parabolic flow profile of the laminar flow, particles further away from the membrane travel faster toward the detector, leading to a particle-separation by size. In a typical AF4 experiment, the injected particles are first focused on the membrane, by applying a cross flow without a longitudinal flow through the channel (Figure 2A). After injection and focusing, the elution starts by simultaneously applying a cross flow and a longitudinal flow to fractionate and elute the different subsets of particles (Figure 2B), which, in our case, were EVs and free glucuronidase.
Figure 3 illustrates the separation of nanoparticles (EVs or liposomes) from contaminating proteins and nonencapsulated glucuronidase. The SEC elution profile of liposomes (Figure 3A) purified after their preparation (see section 4 of the protocol) showed the separation of the particles with encapsulated glucuronidase from the free enzyme, detected both through BCA assay and enzyme activity. In the present example, fraction 6 and 7 would be chosen for further experiments as they contained the highest particle concentrations and to prevent possible contaminations with free glucuronidase. AF4 was also successful in separating EVs from free glucuronidase as demonstrated in Figure 3B, with a higher degree of separation than SEC, making contamination of the fractions containing vesicles less probable.
In Figure 4, a control experiment was performed to ensure that the enzyme activity measured for the vesicles was indeed linked to the encapsulation of glucuronidase into EVs and not caused by enzyme aggregates. These aggregates might have been formed due to the incubation of glucuronidase with saponin and lead to false positive results. To verify the fractions where vesicles would elute, purified EVs without encapsulated glucuronidase were subjected to SEC on the same column as the sample just containing saponin and the enzyme.
When glucuronidase was incubated with saponin and subsequently purified by SEC, no enzyme activity was found in the fractions typically containing EVs. While small amounts of particles were found to elute at the same time as EVs (making up <0.1% of the particles recovered from a typical EV pellet), there was no correlating enzyme activity. These results indicate that active enzyme recovered in the fractions containing vesicles was encapsulated in them.
Figure 5 compares the recovery of active enzyme after storage with or without additional AF4 purification to remove nonencapsulated dye. With AF4 purification, there is generally a lower recovery of enzyme per particle, with the highest effect for storage at 4 °C, where recovery drops by two-thirds. Thus, omitting this additional purification step can lead to wrong assumptions about the enzyme stability.
Figure 6 shows the effect of lyophilization without a cryoprotectant on vesicles derived from MSCs, A549 cells, and liposomes, compared with freezing at -80 °C. The particles were imaged by TEM and SEM as described above (see step 5.3 of the protocol). The MSCs and A549 EVs did not exhibit big differences in shape in TEM images, comparing the two storage conditions. In the SEM pictures, however, the lyophilized samples displayed aggregates not found in the -80 °C samples. Liposomes also displayed aggregates in the SEM picture, while in TEM, lyophilization appeared to induce a size increase of liposomes. Lyophilization without cryoprotectants also reduced the recovery of intact glucuronidase after storage (Figure 7). The addition of trehalose as a cryoprotectant increased the recovery of the active enzyme in a dose-dependent manner.
Figure 8 demonstrates the conversion of fluorescein di-β-D-glucuronide to free fluorescein, taking place in the glucuronidase assay. While the educt was nonfluorescent at 516 nm, fluorescein is highly fluorescent at this wavelength. This allowed for a straightforward enzyme activity assay with high sensitivity.
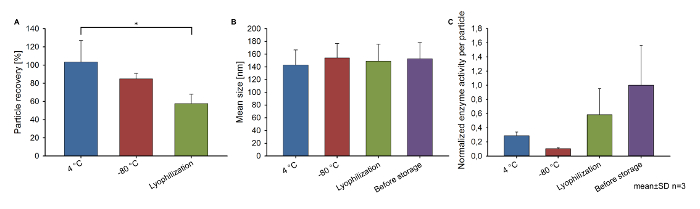
Figure 1: Storage stability of HUVEC EVs. (A) Particle recovery compared to before storage, (B) mean size, and (C) the normalized glucuronidase activity per particle of EVs isolated from HUVECs. Vesicles were stored for 7 d at 4 °C and -80 °C and at 4 °C after lyophilization with 4% trehalose. The mean size and particle recovery were measured by NTA; the glucuronidase activity per particle was calculated combining NTA data and the results of the glucuronidase assay and normalized to before storage. Mean ± SD, n = 3, *p < 0.05 (one-way ANOVA followed by Tukey’s post hoc test). Modified from Frank et al.21. Please click here to view a larger version of this figure.
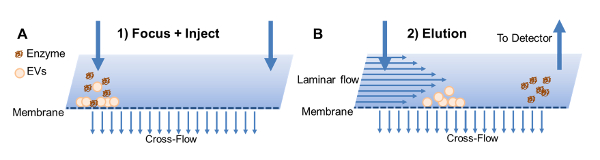
Figure 2: Working principle of the AF4. (A) EVs and free glucuronidase are focused after injection by applying a cross flow. (B) Afterward, EVs and free enzyme are eluted separately by combining the flow through the channel with a cross flow. Modified from Frank et al.21. Please click here to view a larger version of this figure.
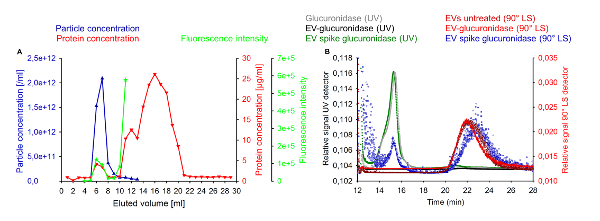
Figure 3: Separation of EVs and liposomes from free glucuronidase. (A) Representative SEC separation of glucuronidase-loaded liposomes, free glucuronidase, and protein contaminants. The graph displays the particle concentration (red), protein concentration (blue), and glucuronidase activity (green). (B) Demonstration of the separation of EVs from free glucuronidase. Untreated EVs, EVs spiked with 0.05 mg/mL glucuronidase, free glucuronidase (0.5 mg/mL), and EVs loaded with glucuronidase and purified by SEC (EV glucuronidase) were injected and analyzed by UV at 280 nm and 90° light scattering. Free enzyme eluted separately from EVs. Modified from Frank et al.21. Please click here to view a larger version of this figure.
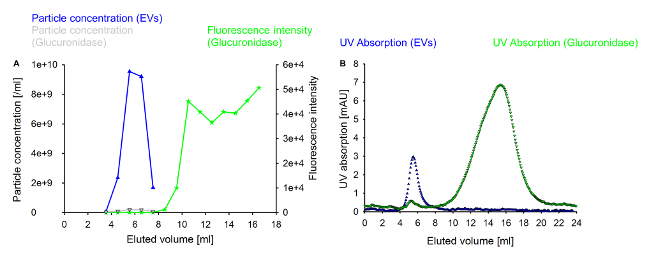
Figure 4: Control experiments for the purification of EVs from free glucuronidase. 400 µL of native EVs or 400 µL of 1.5 mg/mL glucuronidase in PBS incubated for 10 min with 0.1 mg/mL saponin were purified by SEC. (A) Particle concentrations of the collected fractions of vesicles and glucuronidase, respectively, and the enzyme activity of the purified glucuronidase. (B) UV absorption at 280 nm measured in the same experiment. The first small peak for glucuronidase corresponds with the grey line in panel A. Please click here to view a larger version of this figure.
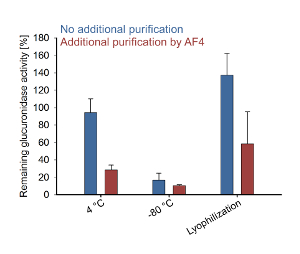
Figure 5: The effect of additional purification steps after EV storage. Remaining glucuronidase activity per particle compared to d0 with or without an additional AF4 purification step after storage. HUVEC EVs were stored for 7 d at 4 °C or -80 °C and lyophilized with 4% trehalose. Please click here to view a larger version of this figure.
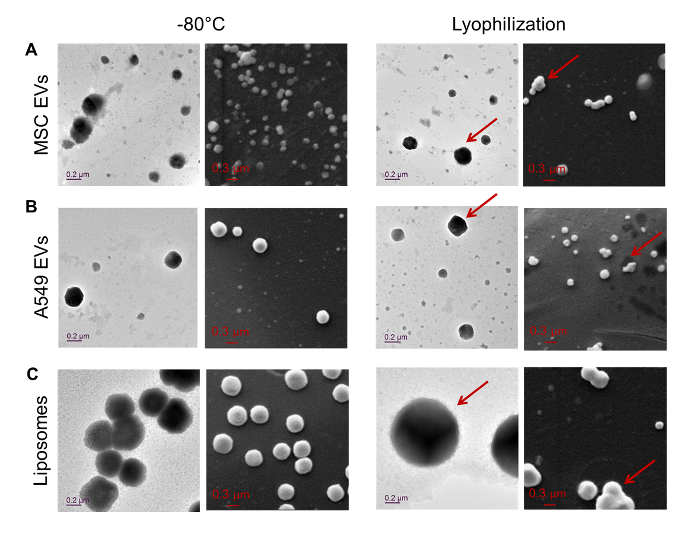
Figure 6: TEM and SEM pictures of EVs. TEM and SEM pictures of EVs from (A) MSCs and (B) A549 cells and (C) liposomes. Samples were stored for 14 d at -80 °C or lyophilized without the addition of trehalose. Arrows indicate the presence of morphologically altered particles in the TEM pictures and aggregates in the SEM pictures. Modified from Frank et al.21. Please click here to view a larger version of this figure.
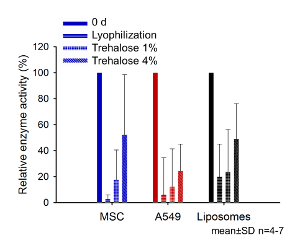
Figure 7: The effect of trehalose on enzyme recovery after lyophilization. Comparison of the enzyme activity after lyophilization for 14 days, with 0%, 1%, and 4% trehalose with the sample before storage (0 days). Modified from Frank et al.21. Please click here to view a larger version of this figure.
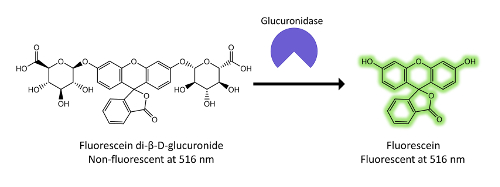
Figure 8: The enzymatic cleavage of fluorescein di-β-D-glucuronide by glucuronidase. In the scheme, the reaction underlying the detection of glucuronidase is explained. Nonfluorescent fluorescein di-β-D-glucuronide is cleaved by glucuronidase. Through the removal of the sugar residues, fluorescein regains its fluorescent properties. The fluorescence measured after the incubation period correlates with the amount of active enzyme present and is the readout of the glucuronidase assay. Please click here to view a larger version of this figure.
Discussion
In this manuscript, we present a comprehensive protocol to study the stability of EVs under different storage conditions. With the combination of encapsulated glucuronidase as a functional readout and the evaluation of the physicochemical parameters of the EVs, the protocol allows for a straightforward storage stability evaluation of EVs and the comparison of EVs from different cell lines. SEM and TEM as complementary methods allow an insight into changes of the EVs on the single-particle level. The results presented here showed a tendency of the EVs and liposomes to aggregate due to lyophilization without a cryoprotectant (Figure 6). However, this was only observed in the SEM experiments. While EM imaging was not conducted with samples that were preserved with trehalose, the literature suggests that this cryoprotectant might indeed reduce the aggregation of EVs29. It is also possible to assess, if a given storage condition differentially affects EV size, the recovery rate and encapsulated molecules. Such an effect is exemplified by the results obtained for HUVEC EVs (Figure 1). While the particle recovery for 4 °C and -80 °C was better than for the lyophilized samples, the recovery of active encapsulated glucuronidase was best for the lyophilized samples. Lyophilization of EVs could be the more favorable storage condition, for instance, when analyzing EV biomarkers, where the focus is more on obtaining and preserving intact cargo rather than on intact vesicles.
In their recent paper on the lyophilization of EVs22, Charoenviriyakul et al. followed a comparable approach. Regarding the physicochemical parameters, they focused on the polydispersity index (PDI) and the zeta potential, as changes in zeta potential can correlate with reduced colloidal stability. However, the zeta potential cannot solely explain observed changes in stability30, which was also reflected in their results. They also compared the protein and RNA content of stored EVs by polyacrylamide gel electrophoresis. This technique can very well indicate substantial changes in the protein or RNA content of the vesicles. However, it requires much larger amounts of material than the method presented here. To assess the effect of storage on the EV cargo, Charoenviriyakul et al. heterologously expressed an enzyme and DNA species each in their EV producer cell line and monitored their activity and integrity in the EVs. However, such heterologous expression is not suitable if EVs from different sources are to be compared, as it requires a substantial amount of time for each new cell line, while the simple saponin-mediated encapsulation can be readily applied.
It is crucial to remove any nonencapsulated enzyme, as shown in Figure 3. EV-encapsulated glucuronidase reacts much slower with its substrate than free enzyme in solution, leading to an overestimation of the encapsulation efficiency. Clean separation is especially important for the analysis after storage, as the storage conditions might affect the activity of free glucuronidase in the sample differently and might lead to leakage from damaged EVs. This was apparent in our experiments (Figure 5), as the application of AF4 before the glucuronidase assay managed to remove dye not encapsulated in the vesicles. Thus, it made it possible to get clear results on the effect of the storage methods discussed here, while without AF4, the activity loss due to storage would have been underestimated.
Another important consideration is the isolation and characterization of the EVs to be tested for their stability. Although the described technique enables the comparison of EVs from different sources, this is only possible if all of them are prepared by the same isolation method so the results are not distorted18,31,32. In this context, cell culture conditions need to be taken into consideration also, as they can impact the quantity and bioactivity of the isolated EVs33. To obtain results that can be compared to other published results, it is advisable to consult the recently updated "Minimal information for studies of extracellular vesicles" that contains guidelines for the harmonization of EV research26.
In the protocol presented here, we used SEC or AF4 for removing the free enzyme after storage. Other methods could be applied, such as gradient ultracentrifugation, UC, or ultrafiltration34. Compared to centrifugal methods, SEC and AF4 are less time-consuming (e.g., roughly 1.5 h for SEC including column equilibration versus up to 16 h or more for gradient UC) and they can completely separate free proteins from the EVs in comparison to normal UC, where there always remains residual supernatant with the pellet. Moreover, SEC15 and AF435 are mild methods, which induce less shear stress on the EVs. In comparison, the forces imposed upon EVs during UC might lead to alterations of the particles, such as aggregation and alterations in size34,36.
A disadvantage of SEC and AF4 is the dilution of the samples. Thus, it is required to isolate sufficient amounts of EVs to maintain the concentrations required for NTA measurements after multiple purification steps. EV fractions may be concentrated using centrifugal filters but, depending on the filter material and the protocol, there could be a loss of vesicles37.
The limitation of the protocol discussed here is that it only monitors the enzyme activity of exogenously encapsulated glucuronidase, neither taking into account encapsulated RNA and DNA nor the EV surface proteins that might be important for functionality18. For the research of new EV therapeutics, this technique cannot replace assays on functionality but compliment them and give an indication about vesicle stability. It could be of great use if, for example, EVs derived from biofluids are to be stored for later analysis of their vesicle content.
In the future, the scope of this protocol could be expanded to also include EVs derived from other organisms, for instance, bacterial outer membrane vesicles. Another interesting next step would be to test the encapsulation of nucleic acids by saponin incubation and to also look into the stability of DNA or RNA cargos.
In conclusion, this procedure offers a simple method for the assessment of the storage stability of EVs from various mammalian cell sources by integrating both a physicochemical and a functional readout. This detailed protocol will allow EV researchers a straightforward determination of suitable storage conditions for their vesicles.
Disclosures
The authors have nothing to disclose.
Acknowledgements
The NanoMatFutur Junior Research program from the Federal Ministry of Education and Research, Germany (grant number 13XP5029A) supported this work. Maximilian Richter was supported by Studienstiftung des Deutschen Volkes (German Academic Scholarship Foundation) through a Ph.D. fellowship.
Materials
| Name | Company | Catalog Number | Comments |
|---|---|---|---|
| 1,2 dimyristoyl-sn glycero-3-phospho-choline (DMPC) | Sigma-Aldrich | P2663-25MG | |
| 1,2-dipalmitoyl-sn-glycero-3-phospho-choline (DPPC) | Sigma-Aldrich | P4329-25MG | |
| 225 cm² cell culture flasks | Corning | 431082 | Used with 25 ml of medium |
| 30 kDa regenerated cellulose membrane | Wyatt Technology Europe | 1854 | |
| 350 µm spacer | Wyatt Technology Europe | ||
| Automated fraction collector | Thermo Fisher Scientific | ||
| Beta-glucuronidase | Sigma-Aldrich | G7646-100KU | |
| Chloroform | Fisher scientific | C/4966/17 | |
| Column oven | Hitachi High-Technologies Europe | ||
| D-(+)-Trehalose dihydrate | Sigma-Aldrich | T9531-10G | |
| DAWN HELEOS II, Multi-angle light scattering detector | Wyatt Technology Europe | ||
| Durapore Membrane filter, PVDF, 0,1 µm, 47 mm | Merck | VVLP04700 | Used for the preparation of buffers for AF4 |
| EBM-2 | Lonza Verviers, S.p.r. | CC-3156 | Endothelial Cell Growth basal medium, used for the serum free culture of HUVEC cells |
| Eclipse dualtec | Wyatt Technology Europe | ||
| EGM-2 | Lonza Verviers, S.p.r. | CC-3162 | Endothelial Cell Growth medium, used for the normal culture of HUVEC cells |
| ELISA Plate Sealers | R&D Systems | DY992 | used for sealing of 96-well plates for the glucuronidase assay |
| Ethanol | Fisher scientific | E/0665DF/17 | |
| Extruder Set With Holder/Heating Block | Avanti Polar Lipids | 610000-1EA | |
| Filter support | Avanti Polar Lipids | 610014-1EA | used for liposome preparation |
| Fluorescein di-β-D-glucoronide | Thermo Fisher Scientific | F2915 | |
| Gibco PBS-tablets+CA10:F36 | Thermo Fisher Scientific | 18912014 | |
| Hettich Universal 320 R | Andreas Hettich GmbH & Co.KG | Used for pelleting cells at 300 g | |
| Hettich Rotina 420 R | Andreas Hettich GmbH & Co.KG | Used for pelleting larger debris at 3000 g | |
| HUVEC cells | Lonza Verviers, S.p.r. | C2517A | |
| Kimble FlexColumn 1X30CM | Kimble | 420401-1030 | |
| Lyophilizer ALPHA 2-4 LSC | Christ | ||
| Microcentrifuge Tubes, Polypropylene | VWR international | 525-0255 | the tubes used for all EV-handling, found to be more favorable than comparable products from other suppliers regarding particle recovery |
| Nanosight LM14 equipped with a green laser | Malvern Pananalytical | ||
| Nanosight-software version 3.1 | Malvern Pananalytical | ||
| Nucleopore 200 nm track-etch polycarbonate membranes | Whatman/GE Healthcare | 110406 | used for liposome preparation |
| PEEK Inline filter holder | Wyatt Technology Europe | ||
| Phosphotungstic acid hydrate | Sigma-Aldrich | 79690-25G | |
| Polycarbonate bottles for ultracentrifugation | Beckman Coulter | 355622 | |
| QuantiPro BCA Assay Kit | Sigma-Aldrich | QPBCA-1KT | |
| Saponin | Sigma-Aldrich | 47036 | |
| Scanning electron microscopy Zeiss EVO HD 15 | Carl Zeiss AG | ||
| Sepharose Cl-2b | GE Healthcare | 17014001 | |
| SEM copper grids with carbon film | Plano | S160-4 | |
| Small AF4 channel | Wyatt Technology Europe | ||
| Sputter-coater Q150R ES | Quorum Technologies | ||
| Transmission electron microscopy JEOL JEM 2011 | Oxford Instruments | ||
| Type 45 Ti ultracentrifugation rotor | Beckman Coulter | 339160 | |
| Ultimate 3000 Dionex autosampler | Thermo Fisher Scientific | ||
| Ultimate 3000 Dionex isocratic pump | Thermo Fisher Scientific | ||
| Ultimate 3000 Dionex online vacuum degasser | Thermo Fisher Scientific | ||
| Ultracentrifuge OptimaTM L-90 K | Beckman Coulter | ||
| UV detector | Thermo Fisher Scientific | ||
| Whatman 0.2 µm pore size mixed cellulose filter | Whatman/GE Healthcare | 10401712 | Used for the filtration of all buffers used with the EVs and in SEC |
References
- Stremersch, S., De Smedt, S. C., Raemdonck, K. Therapeutic and diagnostic applications of extracellular vesicles. Journal of Controlled Release. 244, Part B 167-183 (2016).
- Fuhrmann, G., Herrmann, I. K., Stevens, M. M. Cell-derived vesicles for drug therapy and diagnostics: Opportunities and challenges. Nano Today. 10 (3), 397-409 (2015).
- Goes, A., Fuhrmann, G. Biogenic and Biomimetic Carriers as Versatile Transporters To Treat Infections. ACS Infectious Diseases. 4 (6), 881-892 (2018).
- György, B., Hung, M. E., Breakefield, X. O., Leonard, J. N. Therapeutic Applications of Extracellular Vesicles: Clinical Promise and Open Questions. Annual Review of Pharmacology and Toxicology. 55, 439-464 (2015).
- Schulz, E., et al. Biocompatible bacteria-derived vesicles show inherent antimicrobial activity. Journal of Controlled Release. 290, 46-55 (2018).
- Feng, Q., et al. A class of extracellular vesicles from breast cancer cells activates VEGF receptors and tumour angiogenesis. Nature Communications. 8, 14450(2017).
- Bewicke-Copley, F., et al. Extracellular vesicles released following heat stress induce bystander effect in unstressed populations. Journal of Extracellular Vesicles. 6, 1340746(2017).
- Xu, Y., et al. Macrophages transfer antigens to dendritic cells by releasing exosomes containing dead-cell-associated antigens partially through a ceramide-dependent pathway to enhance CD4(+) T-cell responses. Immunology. 149 (2), 157-171 (2016).
- Buzas, E. I., György, B., Nagy, G., Falus, A., Gay, S. Emerging role of extracellular vesicles in inflammatory diseases. Nature Reviews Rheumatology. 10, 356(2014).
- Rajappa, P., et al. Malignant Astrocytic Tumor Progression Potentiated by JAK-mediated Recruitment of Myeloid Cells. Clinical Cancer Research: An Official Journal of the American Association for Cancer Research. 23 (12), 3109-3119 (2017).
- Umezu, T., et al. Exosomal miR-135b shed from hypoxic multiple myeloma cells enhances angiogenesis by targeting factor-inhibiting HIF-1. Blood. 124 (25), 3748-3757 (2014).
- Costa-Silva, B., et al. Pancreatic cancer exosomes initiate pre-metastatic niche formation in the liver. Nature Cell Biology. 17 (6), 816-826 (2015).
- Boulanger, C. M., Loyer, X., Rautou, P. -E., Amabile, N. Extracellular vesicles in coronary artery disease. Nature Reviews Cardiology. 14, 259(2017).
- Zhu, X., et al. Comprehensive toxicity and immunogenicity studies reveal minimal effects in mice following sustained dosing of extracellular vesicles derived from HEK293T cells. Journal of Extracellular Vesicles. 6 (1), 1324730(2017).
- Vader, P., Mol, E. A., Pasterkamp, G., Schiffelers, R. M. Extracellular vesicles for drug delivery. Advanced Drug Delivery Reviews. 106, Part A 148-156 (2016).
- Ingato, D., Lee, J. U., Sim, S. J., Kwon, Y. J. Good things come in small packages: Overcoming challenges to harness extracellular vesicles for therapeutic delivery. Journal of Controlled Release. 241, 174-185 (2016).
- Gimona, M., Pachler, K., Laner-Plamberger, S., Schallmoser, K., Rohde, E. Manufacturing of Human Extracellular Vesicle-Based Therapeutics for Clinical Use. International Journal of Molecular Sciences. 18 (6), 1190(2017).
- Jeyaram, A., Jay, S. M. Preservation and Storage Stability of Extracellular Vesicles for Therapeutic Applications. The AAPS Journal. 20 (1), 1(2017).
- Lőrincz, ÁM., et al. Effect of storage on physical and functional properties of extracellular vesicles derived from neutrophilic granulocytes. Journal of Extracellular Vesicles. 3, 25465(2014).
- Processes for producing stable exosome formulations. US patent. , Beverly Hills, CA. WO/2016/090183 (2016).
- Frank, J., et al. Extracellular vesicles protect glucuronidase model enzymes during freeze-drying. Scientific Reports. 8 (1), 12377(2018).
- Charoenviriyakul, C., Takahashi, Y., Nishikawa, M., Takakura, Y. Preservation of exosomes at room temperature using lyophilization. International Journal of Pharmaceutics. 553 (1), 1-7 (2018).
- Kusuma, G. D., et al. To Protect and to Preserve: Novel Preservation Strategies for Extracellular Vesicles. Frontiers in Pharmacology. 9 (1199), (2018).
- Haney, M. J., et al. Exosomes as drug delivery vehicles for Parkinson's disease therapy. Journal of Controlled Release. 207, 18-30 (2015).
- Fuhrmann, G., Serio, A., Mazo, M., Nair, R., Stevens, M. M. Active loading into extracellular vesicles significantly improves the cellular uptake and photodynamic effect of porphyrins. Journal of Controlled Release. 205, 35-44 (2015).
- Théry, C., et al. Minimal information for studies of extracellular vesicles 2018 (MISEV2018): a position statement of the International Society for Extracellular Vesicles and update of the MISEV2014 guidelines. Journal of Extracellular Vesicles. 7 (1), 1535750(2018).
- Gardiner, C., Ferreira, Y. J., Dragovic, R. A., Redman, C. W. G., Sargent, I. L. Extracellular vesicle sizing and enumeration by nanoparticle tracking analysis. Journal of Extracellular Vesicles. 2 (1), 19671(2013).
- Vestad, B., et al. Size and concentration analyses of extracellular vesicles by nanoparticle tracking analysis: a variation study. Journal of Extracellular Vesicles. 6 (1), 1344087(2017).
- Bosch, S., et al. Trehalose prevents aggregation of exosomes and cryodamage. Scientific Reports. 6, 36162(2016).
- Bhattacharjee, S. DLS and zeta potential - What they are and what they are not. Journal of Controlled Release. 235, 337-351 (2016).
- Van Deun, J., et al. The impact of disparate isolation methods for extracellular vesicles on downstream RNA profiling. Journal of Extracellular Vesicles. 3 (1), 24858(2014).
- Taylor, D. D., Shah, S. Methods of isolating extracellular vesicles impact down-stream analyses of their cargoes. Methods. 87, 3-10 (2015).
- Patel, D. B., et al. Impact of cell culture parameters on production and vascularization bioactivity of mesenchymal stem cell-derived extracellular vesicles. Bioengineering & Translational Medicine. 2 (2), 170-179 (2017).
- Gardiner, C., et al. Techniques used for the isolation and characterization of extracellular vesicles: results of a worldwide survey. Journal of Extracellular Vesicles. 5 (1), 32945(2016).
- Zhang, H., et al. Identification of distinct nanoparticles and subsets of extracellular vesicles by asymmetric flow field-flow fractionation. Nature Cell Biology. 20 (3), 332-343 (2018).
- Linares, R., Tan, S., Gounou, C., Arraud, N., Brisson, A. R. High-speed centrifugation induces aggregation of extracellular vesicles. Journal of Extracellular Vesicles. 4 (1), 29509(2015).
- Lobb, R. J., et al. Optimized exosome isolation protocol for cell culture supernatant and human plasma. Journal of Extracellular Vesicles. 4, 27031(2015).
Reprints and Permissions
