Here, we describe a simple confocal imaging method to visualize the in situ localization of cells secreting the cytokine Interferon gamma in murine secondary lymphoid organs. This protocol can be extended for the visualization of other cytokines in diverse tissues.
Method Article
Imaging of In Situ Interferon Gamma Production in the Mouse Spleen following Listeria monocytogenes Infection
In This Article
Summary
Abstract
Cytokines are small proteins secreted by cells, mediating cell-cell communications that are crucial for effective immune responses. One characteristic of cytokines is their pleiotropism, as they are produced by and can affect a multitude of cell types. As such, it is important to understand not only which cells are producing cytokines, but also in which environment they do so, in order to define more specific therapeutics. Here, we describe a method to visualize cytokine production in situ following bacterial infection. This technique relies on imaging cytokine-producing cells in their native environment by confocal microscopy. To do so, tissue sections are stained for markers of multiple cell types together with a cytokine stain. Key to this method, cytokine secretion is blocked directly in vivo before harvesting the tissue of interest, allowing for detection of the cytokine that accumulated inside the producing cells. The advantages of this method are multiple. First, the microenvironment in which cytokines are produced is preserved, which could ultimately inform on the signals required for cytokine production and the cells affected by those cytokines. In addition, this method gives an indication of the location of the cytokine production in vivo, as it does not rely on artificial in vitro re-stimulation of the producing cells. However, it is not possible to simultaneously analyze cytokine downstream signaling in cells that receive the cytokine. Similarly, the cytokine signals observed correspond only to the time-window during which cytokine secretion was blocked. While we describe the visualization of the cytokine Interferon (IFN) gamma in the spleen following mouse infection by the intracellular bacteria Listeria monocytogenes, this method could potentially be adapted to the visualization of any cytokine in most organs.
Introduction
Orchestrating an efficient immune response against a pathogen requires complex integration of signals displayed by a variety of immune cells that are often dispersed among the organism. In order to communicate, these cells produce small soluble proteins with multiple biological functions that act as immunomodulators named cytokines. Cytokines control cell recruitment, activation and proliferation and hence are known to be key players in the promotion of immune responses1. Effective immune responses require cytokines to be released in a very organized spatiotemporal pattern connecting specific cells to induce specific signals. Therefore, it is crucial to study cytokine production and its signaling in situ, taking into account the microenvironment in which cytokines are produced.
Listeria monocytogenes (L. monocytogenes) is a Gram-positive intracellular bacterium used as a prime model to study immune responses to intracellular pathogens in mice. One cytokine, IFN gamma (IFNγ) is produced rapidly, within 24 h following L. monocytogenes infection. It is necessary for pathogen clearance, as mice knocked out for IFNγ are highly susceptible to L. monocytogenes infection2. IFNγ is pleiotropic and produced by multiple cells following infection3. While IFNγ produced by natural killer (NK) cells is required for direct anti-bacterial activity4, IFNγ from other sources have been shown to have other functions. Indeed, we and others recently found that IFNγ produced by CD8+ T cells has a specific function in directly regulating T cell differentiation5,6,7. As such, understanding which cells produce IFNγ (and in which microenvironment) is crucial to dissect its function.
The most common technique to study cytokine production relies on intracellular cytokine staining analyzed by flow cytometry. This method allows the simultaneous detection of multiple cytokines combined with cell surface markers within a single sample, providing an extremely useful tool to study cytokine production. However, using the aforementioned technique implies losing any spatial information. In addition, cytokine detection often relies on in vitro re-stimulation to enable cytokine detection. As such, the capacity of a given cell to produce a cytokine is analyzed, and it does not necessarily correlate with actual cytokine secretion in situ. Other methods use reporter mice for which fluorescent protein expression correlates with cytokine transcription and allows for visualization on a single-cell level8. Although this method can track cytokine transcription in situ, there are a limited number of cytokine-reporter mice available. In addition, transcription, translation and secretion can sometimes be unlinked, and fluorescent proteins have a different half-life than the cytokine they report, making this method sometimes not adequate for in situ cytokine visualization.
Here, we describe a method to visualize in situ cytokine production by confocal microscopy at single cell resolution. This technique enables the visualization of the cellular source and surrounding niche within the tissue. This protocol specifically describes the visualization of IFNγ production in the spleen of L. monocytogenes infected mice, focusing here on IFNγ production by NK cells and antigen specific CD8+ T cells. However, it can be extended and adapted to the characterization of any cytokine production in the context of other situations where cytokines are produced such as infection, inflammation or autoimmune diseases, as long the targeted cytokine can be retained in cells by intracellular protein transport inhibitor.
Protocol
All experiments involving mice were in agreement with the UK Scientific Procedures Act of 1986.
1. Adoptive Transfer of Antigenic-specific CD8+ T Cells in Mice
- Isolate ovalbumin (OVA)-specific CD8+ T cells (OTI) expressing green fluorescent protein (OTI-GFP) or red fluorescent protein (OTI-RFP) from lymph node suspension of T-cell receptor transgenic mice9,10 using a mouse CD8+ T cell isolation kit as per manufacture instructions. Prepare the cell suspension by smashing lymph nodes using a syringe plunger, as previously described11.
- Transfer OTI-GFP or OTI-RFP cells (3 x 10⁶ cells) into C57BL/6 wild type mice recipients by intravenous injection as described by Cahalan, et al.12. Use mice that are typically 6–12 week of age.
NOTE: This step is optional and only required for tracking antigen-specific CD8+ T cells.
2. Listeria monocytogenes Infection
- Expand L. monocytogenes genetically modified to express OVA (LM-OVA)13 to an exponential phase of growth in broth heart infusion at 37 °C under gentle agitation until the OD600 reaches 0.08–0.1, as previously described in reference14.
- Inject 100 µL (maximum volume = 200 µL) of 0.1–0.5 LD50 LM-OVA diluted in phosphate-buffered saline (PBS) by intravenous injection using a 29 G insulin syringe, into C57BL/6 wild type mice recipients bearing OTI-GFP or OTI-RFP cells when indicated.
NOTE: In our hands, 0.1 x LD50 LM-OVA corresponds to 2 x 10⁴ colony forming units (CFU). L. monocytogenes genetically modified to express OVA is used to activate the previously transferred OTI CD8+ T cells, but other strains of L. monocytogenes can be used.
3. Treatment with Brefeldin A (BFA) to Block Cytokine Secretion
- Inject 250 µg of BFA in 200 µL of PBS intraperitoneally 6 h before mouse sacrifice using a 29 G insulin syringe.
NOTE: Lyophilized BFA is first resuspended in dimethyl sulfoxide (DMSO) to prepare stock of 25 mg/mL concentration. The BFA is then diluted in PBS at room temperature (RT) to avoid crystallization prior to injection. Inhibition of cytokine secretion induces accumulation of IFNγ in cells. This is crucial for cytokine detection.
4. Harvesting the Spleen
- Euthanize the mice using rising concentration of CO2 followed by cervical dislocation.
NOTE: Follow the local institution guidelines for humane euthanasia of mice. - Cleanse the abdomen with 70% ethanol, make an incision with scissors to make a 1–2 cm cut through the skin on the left flank of the mouse, where the spleen is located. Carefully make an incision in the peritoneum to expose the spleen and take it out with tweezers. Harvest the spleen, being careful not to squeeze it with forceps or cut it to avoid disrupting the spleen architecture.
5. Fixation of the Spleen with Paraformaldehyde (PFA)
- Prepare the fixative solution by mixing 3.75 mL of PBS and 3.75 mL of 0.2 M L-lysine. Add 21 mg of sodium m-periodate and mix well. Then add 2.5 mL of 4% PFA and 20 µL of 12 N NaOH.
NOTE: Use the fixative solution on the same day and discard the excess. Do not store it. This fixation step is important if the sample contains fluorescent proteins such as GFP. Do not use PFA containing traces of methanol, as it denatures fluorescent proteins.
CAUTION: PFA is toxic and must be handled with caution. - Submerge the spleen in the fixative and fix for a minimum of 4 h, typically 16–20 h at 4°C under gentle agitation.
- Discard the fixative solution and add 5 mL of PBS for 5 min at RT under gentle agitation.
- Replace the PBS with 5 mL of fresh PBS incubate for 1 h at 4 °C under gentle agitation.
- Replace the PBS with 5 mL of 30% sucrose, incubate for 12–24 h.
NOTE: This method helps maintain the tissue morphology. After incubation with sucrose solution, the organ should sink at the bottom of the well.
6. Freezing and Sectioning
- Put dry ice in a large receptacle and place a smaller receptacle inside containing around 50 mL of pure methanol and a few pieces of dry ice.
- Gently dry the spleen on a lint-free wipe.
- Place the spleen inside a base mold containing a drop of optimum cutting temperature (OCT) compound at the bottom. Be careful not to produce any bubbles. Add OCT over the spleen.
- With forceps, deposit the base mold on the surface of the methanol, making sure that it does not touch the OCT. Freezing the tissue as rapidly as possible to minimize artifacts.
- When it is frozen, proceed with sectioning.
NOTE: Frozen spleen can be kept at -80 °C for several months. - Section the tissue using a cryomicrotome.
- Set the chamber temperature on the cryostat should to -21 °C. Cut sections of the desired thickness (usually around 10 µm). This protocol works with thicknesses up to 30 µm.
- Collect sections onto glass microscope slides (see the Table of Materials) and inspect visually.
NOTE: Sections can be kept at -80 °C for several months.
7. Immunofluorescent Staining
- Allow the section to come to RT.
- Draw a circle with a liquid blocker (e.g., PAP pen) around the tissue section. Draw outside the OCT or it will not stick.
- Once it has dried, rehydrate the sample by placing PBS on the tissue section for 5 min.
NOTE: The volume put on the section depends on the size of the section. We typically use 100–300 µL. Do not let the sections dry once they are rehydrated. - Rinse with PBS at least twice to ensure that the section is well adhered to the slide.
- Add blocking solution to the section to decrease non-specific binding of antibodies.
- Prepare blocking solution as follow: PBS with 0.1% Triton X100, 2% fetal calf serum (FCS), 2.5 µg/mL Fc receptor blocker (anti-mouse CD16/32). Then add 2–5% normal serum of the species of each secondary antibody of the staining panel.
NOTE: If the antibodies are directly conjugated/biotinylated, add 5% normal serum of the species of each primary antibody. If a primary antibody and one of the secondary antibodies are from the same species (e.g., primary antibody raised in rabbit and secondary rabbit anti-rat), do not use the normal serum species as it will increase the background signal. - Gently remove the PBS from the section by aspiration and add 100 µL of the blocking solution per sample section. Incubate in a covered wet chamber for a minimum of 1 h at RT.
- Prepare blocking solution as follow: PBS with 0.1% Triton X100, 2% fetal calf serum (FCS), 2.5 µg/mL Fc receptor blocker (anti-mouse CD16/32). Then add 2–5% normal serum of the species of each secondary antibody of the staining panel.
- Stain with primary antibodies.
- Dilute the primary antibodies at the optimal concentration in the blocking solution. The general starting point antibody concentration is 5 µg/mL, but it should be optimized for each antibody and tissue.
NOTE: If the antibodies are directly conjugated, centrifuge the antibody mix at 17.135 x g (13.500 rpm) for 15 min at 4 °C before using it. Fluorophores can precipitate. This step will pellet the precipitates and thereby prevent non-specific deposition of the precipitated antibodies on the slide. - Replace the blocking solution with the primary antibody mix for each sample.
- Incubate for 4 h at RT or overnight (OVN) at 4 °C in a covered wet chamber.
- Dilute the primary antibodies at the optimal concentration in the blocking solution. The general starting point antibody concentration is 5 µg/mL, but it should be optimized for each antibody and tissue.
- Perform washing.
- Prepare Wash Buffer by adding 2% FCS to PBS.
- Wash 4 times with wash buffer: one quick (without incubation), one for 10 min and two for 5 min. Then perform a final wash with PBS for 5 min.
- Staining with secondary antibodies.
- Dilute the secondary antibodies of interest at the optimal concentration in the blocking solution. Centrifuge the mix, as described for the primary antibodies.
- Remove the final wash solution. Add the secondary antibody mix on top of the section and incubate for 1–4 h at RT in a covered wet chamber.
- Wash 4 times with wash buffer: one quick (without incubation), one for 10 min and two for 5 min. Then perform a final wash with PBS for 5 min.
- Remove the final wash solution. Allow the PBS to evaporate but do not over-dry the section. Place a drop of the mounting medium on top of the sample and carefully place the cover glass on top of it. The mounting medium must recover the whole section. Let it polymerase OVN at RT protected from light.
NOTE: Draw a circle around the section on the reverse side of the slide before applying the mounting medium. Once the mounting medium is applied, the tissue might become difficult to see. - Store the slides in the dark at 4 °C until ready to image.
8. Imaging and Analysis
- Perform imaging of the staining with a confocal microscope.
NOTE: In this protocol, an inverted spectral laser scanning microscope was used (see the Table of Materials), together with the objectives 10x/NA 0.40 or 60x/NA 1.4 (for analysis of cytokine sub-cellular localization). Wavelengths of excitation and emission are displayed for each fluorophore and fluorescent protein in the Table of Materials. - Perform analysis and quantification as required using image processing software (e.g., Imaris or Fiji).
Results
IFNγ produced within the first 24 h after Listeria monocytogenes infection is critical to control the spread of this pathogen. Using this protocol, we can visualize not only which cells are producing IFNγ but also whether they are located in a specific microenvironment. To help us delineate the architecture of the spleen, we labeled cells known to have particular location within the spleen. The marker F4/80 labels all macrophages and highlights the red pulp. The marker B220 labels B cells and highlights B cell follicles surrounding the T cell zone. The marker CD169 labels marginal zone macrophages, surrounding the white pulp (Figure 1). Most OTI cells, whether they express IFNγ or not, are present in the white pulp and as such, all images are those of the white pulp, unless indicated.
One critical step in this protocol is the use of BFA to inhibit cytokine secretion. Indeed, the detection of IFNγ by NK cells was greatly impaired when mice were not treated with BFA (Figure 2). Using our protocol, we could find that at least two cell types produce IFNγ 24 h after infection—NK cells and antigen-specific CD8+ T cells (Figure 3)—similarly to what has been found previously by flow cytometry3.
In situ imaging of IFNγ producing cells revealed that IFNγ production is not spread throughout the spleen, but concentrated into discreet areas (Figure 4). Indeed, we found that T cells were activated throughout the spleen (highlighted by T cell clustering), and this did not necessarily correlate with IFNγ production. One likely explanation is that IFNγ production is restricted to the location of the infected cells15,16, and T cell activation—represented by clustering—can be supported by both infected (IFNγ positive) and non-infected (IFNγ negative) antigen-presenting cells. Other stains will be required to pinpoint the exact location and get an indication of the mechanism restricting IFNγ production to this area and its relationship to antigen transfer. Interestingly, we found that activated, clustered, antigen-specific T cells are located throughout the white pulp of the spleen but they produce IFNγ only in regions where NK cells are coexisting with them (Figure 5). As such, the presence of NK cells delineates a specific microenvironment in the white pulp, in which clustered T cells produce IFNγ as opposed to clustered T cells in the other part of the white pulp. This suggests that T cell activation is not sufficient to dictate IFNγ production at this time point.
Another interesting feature highlighted by our protocol is the different sub-cellular localization of IFNγ in NK versus CD8+ T cells5. As shown in Figure 6, while IFNγ localization in NK cells is diffused in the cytosol, CD8+ T cells often recruit IFNγ towards another T cell.
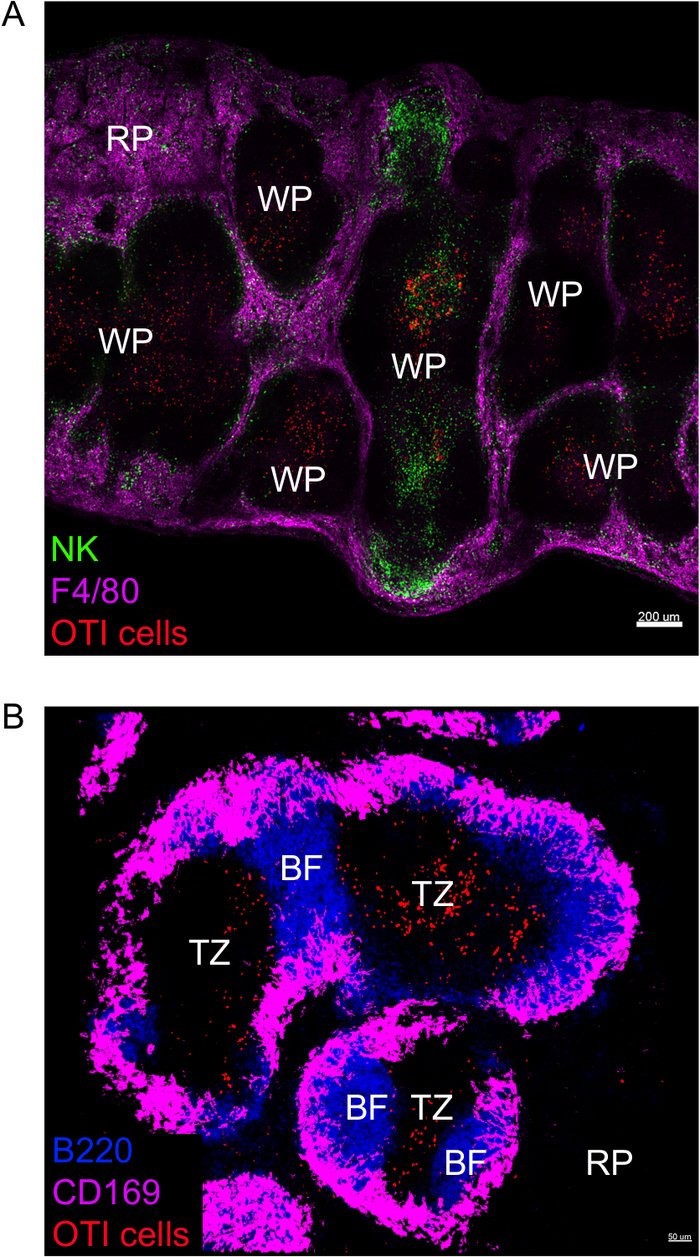
Figure 1: Markers highlighting the spleen architecture. Mice were infected with 2 x 10⁴ CFU LM-OVA and euthanized 24 h post infection. Spleen was explanted and processed as described in the protocol. (A) Sections were stained for NK cells (anti-NCR1 followed by anti-goat IgG-FITC; green), OTI-RFP cells (red) and macrophages (anti-F4/80-APC; magenta). RP = Red Pulp; WP = White Pulp. Scale bar = 200 µm. (B) Sections were stained for B cells (anti-B220-Pacific Blue; Blue), OTI-GFP cells (GFP signal shown in red) and marginal zone macrophages (anti-CD169-Alexa647; magenta). RP = Red Pulp; BF = B cell follicle; TZ = T cell zone. Scale bar = 50 µm. This is a representative image of 3 independent experiments (N = 4). Please click here to view a larger version of this figure.

Figure 2: BFA treatment allows for the detection of intracellular IFNγ in situ. Nγ production is restricted to specific areas in the sple Mice were infected with 2 x 10⁴ CFU LM-OVA and treated with BFA (A) or left untreated (B) after 18 h. Mice were euthanized 24 h post infection. Spleen was explanted and processed as described in the protocol. Sections were stained for NK cells (anti-NCR1 followed by anti-goat IgG-FITC; green), OTI-RFP cells (red) and IFNγ (anti-IFNγ-BV421; cyan). Scale bar = 5 µm. This is a representative image of NK cell-rich areas from 3 independent experiments (N = 3). Please click here to view a larger version of this figure.
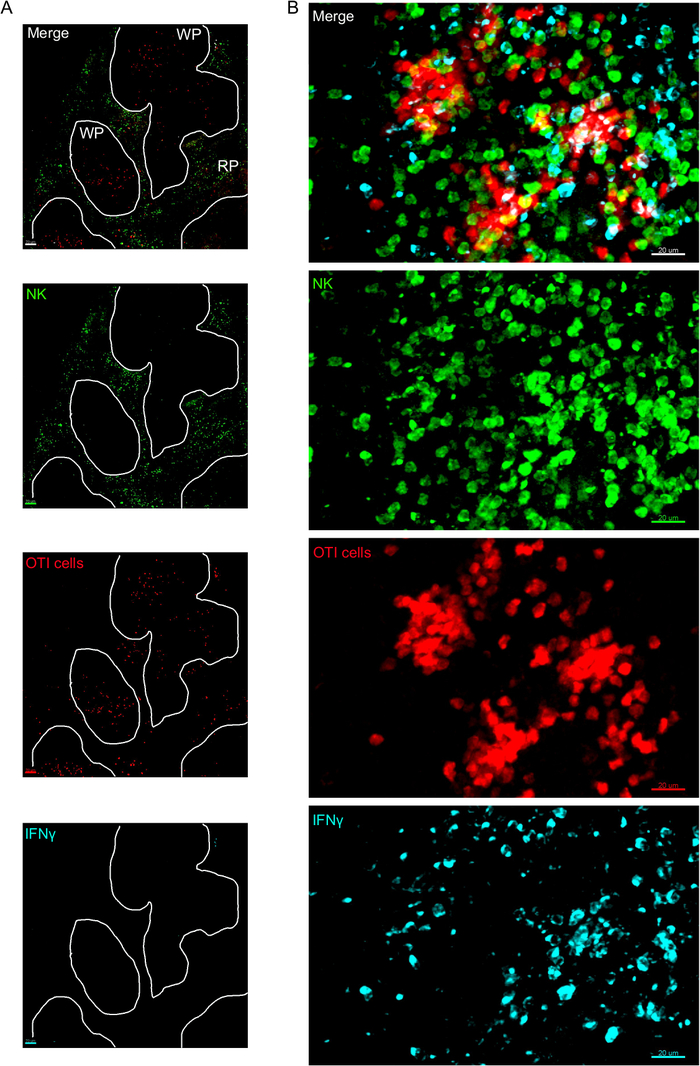
Figure 3: IFNγ producing cells in the spleen. Mice were infected with 2 x 10⁴ CFU LM-OVA when indicated and treated with BFA after 18 h. Mice were euthanized 24 h post infection. Spleen was explanted and processed as described in the protocol. Sections were stained for NK cells (anti-NCR1 followed by anti-goat IgG-FITC; green), OTI-RFP cells (red) and IFNγ (anti-IFNγ-BV421; cyan). (A) Representative image of a spleen from an un-infected naïve mouse to demonstrate absence of IFNγ non-specific staining. White lines delineate the white pulp. WP = White pulp; RP = Red pulp. (B) Representative image of the white pulp from the spleen of a mouse infected by LM-OVA, showing invasion of NK cells to the white pulp and production of IFNγ by NK cells, OTI cells and non-labelled cells. Images are representative from 4 independent experiments (N = 4). Scale bars = 70 µm (A); and 20 µm (B). Please click here to view a larger version of this figure.
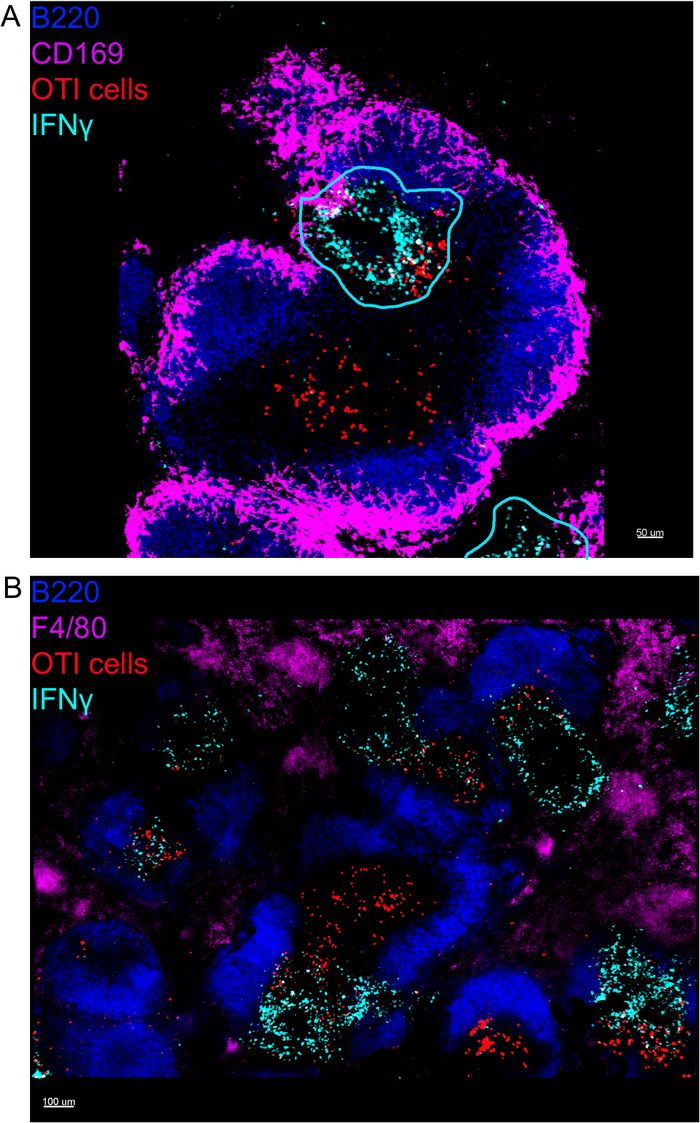
Figure 4: IFNγ production is restricted to specific areas in the spleen following LM-OVA infection. Mice were infected with 2 x 10⁴ CFU LM-OVA and treated with BFA after 18 h. Mice were euthanized 24 h post infection. Spleen was explanted and processed as described in the protocol. All sections were stained for B cells (B220-Pacific Blue Ab, Blue) and IFNγ (anti-IFNγ-biotin followed by streptavidin-PE; cyan). OTI-GFP cells (GFP signal shown in red). Cyan lines correspond to areas of high IFNγ production. Those are representative images of 4 independent experiments (N = 4). (A) Sections were stained for marginal zone macrophages (anti-CD169-Alexa 647, magenta). Scale bar = 50 µm. (B) Sections were stained for all macrophages (F4/80). Scale bar = 100 µm. Please click here to view a larger version of this figure.
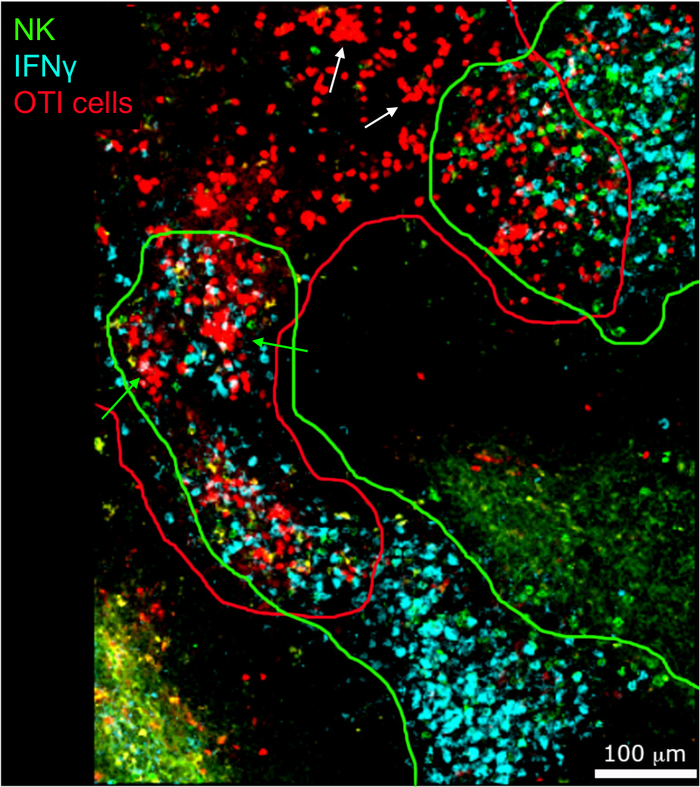
Figure 5: IFNγ production by activated OTI cells occurs in a specific microenvironment. Mice were infected with 2 x 10⁴ CFU LM-OVA and treated with BFA after 18 h. Mice were euthanized 24 h post infection. Spleens were explanted and processed as described in the protocol. Sections were stained for NK cells (anti-NCR1 followed by anti-goat IgG-FITC; green), OTI-RFP cells (red) and IFNγ (anti-IFNγ-BV421; cyan). Green and red lines highlight NK and OTI cell zones, respectively. White arrow indicate examples of T cell clusters not producing IFNγ. Green arrows examples of T cell clusters producing IFNγ. Scale bar = 100 µm. This is a representative image of four independent experiments (N = 4). Please click here to view a larger version of this figure.
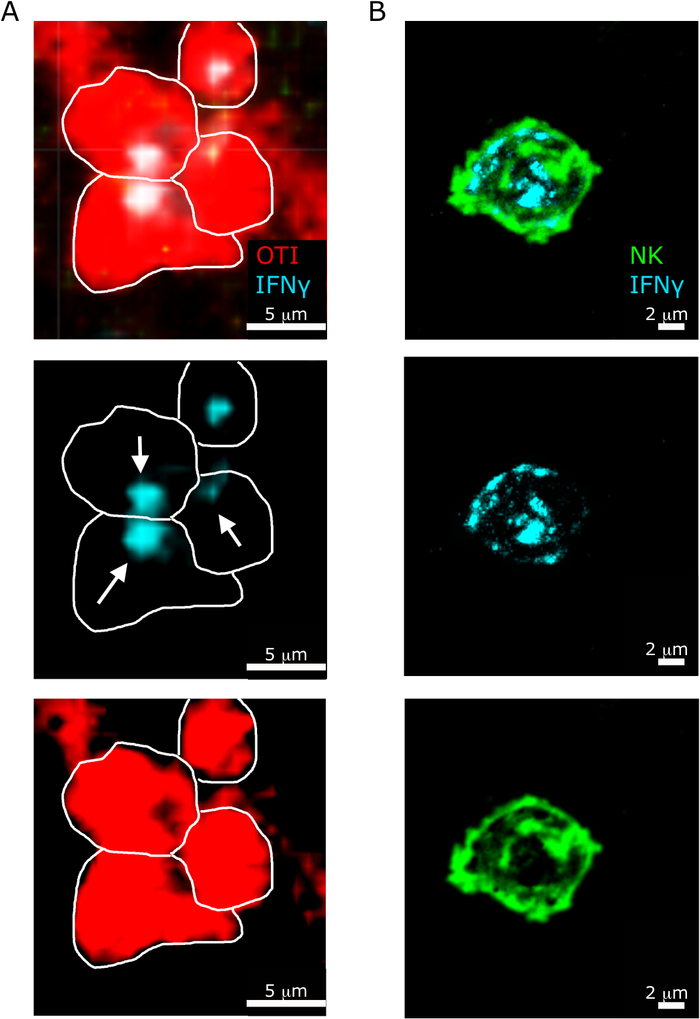
Figure 6: Sub-cellular localization of IFNγ in NK cells and T cells. Mice were infected with 2 x 10⁴ CFU LM-OVA and treated with BFA after 18 h. Mice were euthanized 24 h post infection. Spleen was explanted and processed as described in the protocol. All sections were stained for IFNγ (anti-IFNγ-BV421; cyan). White lines delineate cell edges and white arrows shows directionality of secretion. This is a representative image of two independent experiments (N = 5). (A)- OTI-RFP cells are shown in red. Scale bar = 5 µm. (B) Sections were stained for NK cells (anti-NCR1 followed by anti-goat IgG-FITC; green. Scale bar = 2 µm. Please click here to view a larger version of this figure.
Discussion
In this manuscript, we present a method to visualize IFNγ production in the spleen following L. monocytogenes infection in mice. This protocol is simple and can be adapted to other tissues and cytokine triggers, but the following aspects have to be considered. Cells often rapidly secrete the cytokines they produce, and cytokines are rapidly picked up by neighboring cells. It is as such difficult to detect cytokines in situ. A common method to rapidly re-initiate cytokine production is to re-stimulate the cells ex vivo followed by cytokine detection in the media by enzyme-linked immunosorbent assay. In this context, any information about the spatial localization of the cytokine-producing cells is lost. In addition, cytokine production following re-stimulation does not necessarily reflect whether cytokines are actually produced and secreted in vivo, but rather indicates the capacity of a given cell population to produce cytokines. Therefore, both methods will provide different information and one should consider which information is most valuable for their experiment.
In order to detect intracellular cytokines, our method uses an intracellular protein transport inhibitor to trap cytokines inside cells and increase signal detection. However, it is important to note that these inhibitors affect the normal transportation of proteins from the endothelial reticulum (RE) to the Golgi apparatus and to the secretory vesicle impairing their release, which could cause toxicity. As a consequence, BFA, or other inhibitor, should be used for a short period of time, typically no more than a few hours. Hence, it is important to find the right balance between the inhibitor dose and time of treatment in order to optimize the level of cytokines trapped inside the cell without causing serious cytotoxic effects. These variables can differ between cytokines and the route of administration for the BFA. In our infection model, the BFA was administrated intraperitoneally in order to provide a rapid systemic dispersion, but it can also be delivered intravenously.
The most commonly used intracellular protein transport inhibitors are BFA, used here, and monensin (MN). These inhibitors are often used indistinctly to accumulate and study cytokine production but they have slight differences in their mechanisms of action. MN inhibits transportation of proteins within the Golgi apparatus hence accumulating proteins in the Golgi17 while BFA prevents coatomer protein complex-I recruitment, inhibiting the retrograde movement of proteins to the endoplasmic reticulum (ER) and thereby promoting accumulation of cytokines in the ER18. As such, choosing the best intracellular protein transport inhibitor will depend on different factors, such as the cytokine to be detected. For example, it has been shown in lipopolysaccharide-induced intracellular staining of monocytes that BFA is more efficient to measure the cytokines IL-1β, IL-6 and TNF than MN19.
This protocol involves the visualization of the cytokine in situ by confocal microscopy and therefore there are only a limited number of markers than can be used to study the cytokine- producing cells and their microenvironment. It is also necessary to consider that protein transport inhibitors such as BFA or MN disturb the normal expression of several proteins and hence their use when studying the simultaneous expression of certain activation cell surface markers has to be approached carefully. For example, BFA but not MN blocks the expression of CD69 in murine lymphocytes20. Despite this limitation, confocal imaging enables sub-cellular localization of cytokines, as well as the direction of the cytokine secretion within the cell. The data generated using this protocol suggest that NK cells tend to secrete IFN-y in a diffuse pattern while CD8+ T cells seem to direct the IFNγ secretion towards other CD8+ T cells that are in direct interaction with them5.
To conclude, this protocol is suitable to visualize a variety of cytokines in situ and identify producing cells and their microenvironment following many triggers such as infection or autoimmunity. The information obtained is instrumental to understand the importance of the in vivo spatial orchestration of different cell types and the cytokine they produce, necessary for an efficient immune response.
Disclosures
The authors have nothing to disclose.
Acknowledgements
We thank the Kennedy Institute Imaging Facility personnel for technical assistance with imaging. This work was supported by grants from the Kennedy Trust (to A.G.), and Biotechnology and Biological Sciences Research Council (BB/R015651/1 to A.G.).
Materials
| Name | Company | Catalog Number | Comments |
|---|---|---|---|
| Brefeldin A | Cambridge bioscience | CAY11861 | |
| Paraformaldehyde | Agar scientific | R1018 | |
| L-Lysin dihydrochloride | Sigma lifescience | L5751 | |
| Sodium meta-periodate | Thermo Scientific | 20504 | |
| D(+)-saccharose | VWR Chemicals | 27480.294 | |
| Precision wipes paper Kimtech science | Kimberly-Clark Professional | 75512 | |
| O.C.T. compound, mounting medium for cryotomy | VWR Chemicals | 361603E | |
| Fc block, purified anti-mouse CD16/32, clone 93 | Biolegend | 101302 | Antibody clone and Concentration used: 2.5 mg/ml |
| Microscope slides - Superfrost Plus | VWR Chemicals | 631-0108 | |
| anti-CD169 - AF647 | Biolegend | 142407 | Antibody clone and Concentration used: clone 3D6.112 1.6 mg/ml Excitation wavelength: 650 Emission wavelength: 65 |
| anti-F4/80 - APC | Biolegend | 123115 | Antibody clone and Concentration used: clone BM8 2.5 mg/ml Excitation wavelength: 650 Emission wavelength: 660 |
| anti-B220 - PB | Biolegend | 103230 | Antibody clone and Concentration used: clone RA3-6B2 1.6 mg/mL Excitation wavelength: 410 Emission wavelength: 455 |
| anti-IFNg - biotin | Biolegend | 505804 | Antibody clone and Concentration used: clone XMG1.2 5 mg/mL |
| anti-IFNg - BV421 | Biolegend | 505829 | Antibody clone and Concentration used: clone XMG1.2 5 mg/mL Excitation wavelength: 405 Emission wavelength: 436 |
| anti-Nkp46/NCRI | R&D Systems | AF2225 | Antibody clone and Concentration used: goat 2.5 mg/mL |
| anti-goat IgG-FITC | Novusbio | NPp 1-74814 | Antibody clone and Concentration used: 1 mg/mL Excitation wavelength: 490 Emission wavelength: 525 |
| Streptavidin - PE | Biolegend | 405203 | Antibody clone and Concentration used: 2.5 mg/mL Excitation wavelength: 565 Emission wavelength: 578 |
| Streptavidin - FITC | Biolegend | 405201 | Antibody clone and Concentration used: 2.5 mg/mlL Excitation wavelength: 490 Emission wavelength: 525 |
| Fluoromount G | SouthernBiotech | 0100-01 | |
| Cover glasses 22 mm x 40 mm | Menzel-Glazer | 12352128 | |
| Liquid blocker super PAP PEN mini | Axxora | CAC-DAI-PAP-S-M | |
| Imaris - Microscopy Image Analysis Software | Bitplane | ||
| Confocal microscope - Olympus FV1200 Laser scanning microscope | Olympus | ||
| Cryostat - CM 1900 UV | Leica | ||
| Base mould disposable | Fisher Scientific UK Ltd | 11670990 | |
| PBS 1x | Life Technologies Ltd | 20012068 | |
| BHI Broth | VWR Brand | 303415ZA | |
| GFP | Excitation wavelength: 484 Emission wavelength: 507 | ||
| RFP | Excitation wavelength: 558 Emission wavelength: 583 | ||
| Insulin syringe, with needle, 29 G | VWR International | BDAM324824 | |
| C57BL/6 wild type mice | Charles River |
References
- Iwasaki, A., Medzhitov, R. Control of adaptive immunity by the innate immune system. Nature Immunology. 16 (4), 343-353 (2015).
- Harty, J. T., Bevan, M. J. Specific immunity to Listeria monocytogenes in the absence of IFN gamma. Immunity. 3 (1), 109-117 (1995).
- Kubota, K., Kadoya, Y. Innate IFN-gamma-producing cells in the spleen of mice early after Listeria monocytogenes infection: importance of microenvironment of the cells involved in the production of innate IFN-gamma. Frontiers in Immunology. 2 (26), (2011).
- Dunn, P. L., North, R. J. Early gamma interferon production by natural killer cells is important in defense against murine listeriosis. Infection and Immunity. 59 (9), 2892-2900 (1991).
- Krummel, M. F., et al. Paracrine costimulation of IFN-gamma signaling by integrins modulates CD8+ T cell differentiation. Proceedings of the National Academy of Sciences of the United States of America. 115 (45), 11585-11590 (2018).
- Curtsinger, J. M., Agarwal, P., Lins, D. C., Mescher, M. F. Autocrine IFN-gamma promotes naive CD8+ T cell differentiation and synergizes with IFN-alpha to stimulate strong function. Journal of Immunology. 189 (2), 659-668 (2012).
- Hosking, M. P., Flynn, C. T., Whitton, J. L. Antigen-specific naive CD8++ T cells produce a single pulse of IFN-gamma in vivo within hours of infection, but without antiviral effect. Journal of Immunology. 193 (4), 1873-1885 (2014).
- Croxford, A. L., Buch, T. Cytokine reporter mice in immunological research: perspectives and lessons learned. Immunology. 132 (1), 1-8 (2011).
- Gerard, A., et al. Secondary T cell-T cell synaptic interactions drive the differentiation of protective CD8++ T cells. Nature Immunology. 14 (4), 356-363 (2013).
- Engelhardt, J. J., et al. Marginating dendritic cells of the tumor microenvironment cross-present tumor antigens and stably engage tumor-specific T cells. Cancer Cell. 21 (3), 402-417 (2012).
- Matheu, M. P., Cahalan, M. D. Isolation of CD4+ T cells from mouse lymph nodes using Miltenyi MACS purification. Journal of Visualized Experiments. (9), 409(2007).
- Matheu, M. P., Parker, I., Cahalan, M. D. Dissection and 2-photon imaging of peripheral lymph nodes in mice. Journal of Visualized Experiments. (7), 265(2007).
- Pope, C., et al. Organ-specific regulation of the CD8+ T cell response to Listeria monocytogenes infection. Journal of Immunology. 166 (5), 3402-3409 (2001).
- Jones, G. S., D'Orazio, S. E. Listeria monocytogenes: cultivation and laboratory maintenance. Current Protocols in Microbiology. 31, 1-7 (2013).
- Kang, S. J., Liang, H. E., Reizis, B., Locksley, R. M. Regulation of hierarchical clustering and activation of innate immune cells by dendritic cells. Immunity. 29 (5), 819-833 (2008).
- Chang, S. R., et al. Characterization of early gamma interferon (IFN-gamma) expression during murine listeriosis: identification of NK1.1+ CD11c+ cells as the primary IFN-gamma-expressing cells. Infection and Immunity. 75 (3), 1167-1176 (2007).
- Mollenhauer, H. H., Morre, D. J., Rowe, L. D. Alteration of intracellular traffic by monensin; mechanism, specificity and relationship to toxicity. Biochimica et Biophysica Acta. 1031 (2), 225-246 (1990).
- Helms, J. B., Rothman, J. E. Inhibition by brefeldin A of a Golgi membrane enzyme that catalyses exchange of guanine nucleotide bound to ARF. Nature. 360 (6402), 352-354 (1992).
- Schuerwegh, A. J., Stevens, W. J., Bridts, C. H., De Clerck, L. S. Evaluation of monensin and brefeldin A for flow cytometric determination of interleukin-1 beta, interleukin-6, and tumor necrosis factor-alpha in monocytes. Cytometry. 46 (3), 172-176 (2001).
- Nylander, S., Kalies, I. Brefeldin A, but not monensin, completely blocks CD69 expression on mouse lymphocytes: efficacy of inhibitors of protein secretion in protocols for intracellular cytokine staining by flow cytometry. Journal of Immunology Methods. 224 (1-2), 69-76 (1999).
Reprints and Permissions
