The goal of this protocol is to isolate mononuclear cells that reside in the lamina propria of the colon by enzymatic digestion of the tissue using collagenase. This protocol allows for the efficient isolation of mononuclear cells resulting in a single cell suspension which in turn can be used for robust immunophenotyping.
Method Article
Isolation of Lamina Propria Mononuclear Cells from Murine Colon Using Collagenase E
In This Article
Summary
Abstract
The intestine is the home to the largest number of immune cells in the body. The small and large intestinal immune systems police exposure to exogenous antigens and modulate responses to potent microbially derived immune stimuli. For this reason, the intestine is a major target site of immune dysregulation and inflammation in many diseases including but, not limited to inflammatory bowel diseases such as Crohn’s disease and ulcerative colitis, graft-versus-host disease (GVHD) after bone marrow transplantation (BMT), and many allergic and infectious conditions. Murine models of gastrointestinal inflammation and colitis are heavily used to study GI complications and to pre-clinically optimize strategies for prevention and treatment. Data gleaned from these models via isolation and phenotypic analysis of immune cells from the intestine is critical to further immune understanding that can be applied to ameliorate gastrointestinal and systemic inflammatory disorders. This report describes a highly effective protocol for the isolation of mononuclear cells (MNC) from the colon using a mixed silica-based density gradient interface. This method reproducibly isolates a significant number of viable leukocytes while minimizing contaminating debris, allowing subsequent immune phenotyping by flow cytometry or other methods.
Introduction
Though the gastrointestinal (GI) tract is primarily dedicated to the processing and reabsorption of nutrients from food, the GI tract also maintains central roles in the integrity of the vascular, lymphatic, and nervous systems and of numerous other organs through its mucosal and submucosal immune system1. The GI immune system has an influential role in both gastrointestinal and systemic health due to its constant exposure to foreign antigens from food, commensal bacteria, or invading pathogens1,2. Thus, the GI immune system must maintain a delicate balance in which it tolerates non-pathogenic antigens while responding appropriately to pathogenic antigens1,2. When the balance of tolerance and defense is disrupted, localized or systemic immune dysregulation and inflammation can occur resulting in a myriad of diseases1,2,3.
The intestine harbors at least 70% of all lymphoid cells in the body4. Most primary immunologic interactions involve at least one of three immune stations in the intestine: 1) Peyer’s Patches, 2) Intraepithelial lymphocytes (IEL) and 3) lamina propria lymphocytes (LPL). Each of these is comprised of a complex interconnected network of immune cells that rapidly respond to normal immune challenges in the gut5. Restricted to the stroma above the muscularis mucosae, the loosely structured lamina propria is the connective tissue of the gut mucosa and includes scaffolding for the villus, the vasculature, lymphatic drainage, and mucosal nervous system, as well as many innate and adaptive immune subsets6,7,8,9. LPL are comprised of CD4+ and CD8+ T cells in an approximate ratio of 2:1, plasma cells and myeloid lineage cells including, dendritic cells, mast cells, eosinophils and macrophages6.
There is a growing interest in understanding the immune dysregulation and inflammation of the gut as it pertains to various disease states. Such conditions as Crohn’s disease and ulcerative colitis all manifest varying levels of colonic inflammation10,11,12. Additionally, patients with malignant or non-malignant disorders of the marrow or immune system who undergo an allogeneic bone marrow transplantation (allo-BMT) can develop various forms of colitis including 1) direct toxicity from conditioning regimens before BMT, 2) infections caused by immunosuppression after BMT and 3) graft-versus-host disease (GVHD) driven by donor-type T cells reacting to donor allo-antigens in the tissues after BMT13,14,15. All these post-BMT complications result in significant alterations in the immune milieu of the intestines16,17,18. The proposed method allows a dependable assessment of immune cell accumulation in the mouse colon and, when applied to murine recipients after BMT, facilitates an efficient assay of both donor and recipient immune cells involved in transplant tolerance19,20. Additional causes of gut inflammation include malignancies, food allergies, or disruption of the gut microbiome. This protocol allows access of gut mononuclear cells from the colon and, with modifications, to leukocytes of the small intestine in any of these preclinical murine models.
A PubMed search using the search terms “intestine AND immune cell AND isolation” reveals over 200 publications describing methods for small intestine digestion to extract immune cells. However, a similar literature search for colon yields no well-delineated protocols specifying isolation of immune cells from the colon. This may be because the colon has more muscular and interstitial layers, rendering it more difficult to completely digest than the small intestine. Unlike existing protocols, this protocol specifically uses Collagenase E from Clostridium histolyticum without other bacterial collagenases (Collagenase D/ Collagenase I). We demonstrate that, using this protocol, digestion of the colonic tissue can be achieved while preserving the quality of isolated gut mononuclear immune cells (MNC) without the addition of anti-clumping reagents such as sodium versenate (EDTA), Dispase II, and deoxyribonuclease I (DNAse I)21,22,23. This protocol is optimized to allow reproducible robust extraction of viable MNC from the murine colon for further directed studies and should lend itself to the study of immunology of the colon or (with modifications) the small intestine24,25.
Protocol
All studies were conducted under rodent research protocols reviewed and approved by the Institutional Animal Care and Use Committee (IACUC) of the University of Miami Miller School of Medicine, which meets the veterinary standards set by the American Association for Laboratory Animal Science (AALAS).
1. Preparation of Solutions
- As described in Table 1, prepare the Colon Buffer, Silica-Based Density Separation Media 100%, Silica-Based Density Separation Media 66%, Silica-based Density Separation Media 44%, Collagenase E Digestion Buffer, and FACS Buffer.
- Prepare Colon Buffer the day prior to the procedure and store overnight at 4 °C.
- Prepare 100% Silica-Based Density Separation Media the day prior to the procedure and stored overnight at 4 °C, placing at room temperature the morning of the procedure to thaw.
- Prepare 66% and 44% Silica-Based Separation Media in the morning of the isolation, using room temperature 100% Silica-Based Density Separation Media and Colon Buffer.
- Measure the appropriate amount of Clostridium histolyticum-derived Collagenase E and store at -20 °C overnight prior to the procedure. The following morning, dissolve in the appropriate volume of Colon Buffer to derive Collagenase Digestion Buffer. For all incubations with Collagenase Digestion Buffer on day of the procedure, pre-warm the solutions to 37 °C.
- For the entire of the protocol steps, keep one centrifuge at 20 °C and the rotation speed of 859 x g, with brakes inactivated (0 deceleration) for gradient centrifugation. Set another to 4 °C and rotation speed of 859 x g, with the standard deceleration, for wash steps.
2. Harvesting the Colon
- Euthanize the mouse via CO2 asphyxiation followed by AALAC-approved confirmatory method.
- Place the mouse in a supine position and spray the fur with 70% ethanol. Using large tissue scissors, make a vertical midline incision and expose the intact peritoneum.
- Using fine dissection scissors, open the peritoneum. Use forceps to move the small bowel to one side and expose the descending colon. Slightly pull upward on the descending colon to maximally expose the rectal portion of the colon. Cut the distal rectum deep in the pelvis and dissect and remove the entire colon as one unit, from the distal rectum to cecal cap.
- Transfer the colon in 20 mL chilled Colon Buffer in a 50 mL polypropylene tube.
3. Cleaning the Colon
- Place the colon on a moistened paper towel and extract the solid stool by applying mild pressure to the bowel wall with the blunt end of scissors or forceps.
- Place the colon in a Petri dish and flush the gut with 10 mL of chilled Colon Buffer using a 10 mL syringe with 18 G blunt fill needle.
- Transfer the colon to a Colon Buffer moistened paper towel and remove the mesentery and fat with the sharp end of scissors.
- Place the colon in a Petri dish filled with 5-10 mL chilled Colon Buffer agitating manually to wash remaining colonic contents. Repeat 2-3 times.
- Cut the colon longitudinally from its more muscular rectal end to the proximal colon (generating a single rectangular open colon piece) in a Petri dish filled with fresh chilled Colon Buffer. Discard existing media and refill with clean chilled Colon Buffer.
- Wash the intestine 3 times by vigorously swirling it in the Petri dish and replacing the 5-10 mL of chilled Colon Buffer after with each wash.
- Place the rectangular colon tissue on a paper towel moistened with Colon Buffer and cut it by slicing it horizontally and then into small fragments (3 mm x 3 mm sections).
- Collect the colon fragments carefully using fine forceps into 20 mL chilled Colon Buffer in a 50 mL polypropylene conical tube.
- Wash the colon fragments 3 times, each wash in 20 mL Colon Buffer, by vigorously swirling the tube for 30 s. Between each agitation, allow the tissue fragments to settle to the bottom of the tube. Decant or vacuum aspirate the supernatant while preventing tissue fragment loss in the aspiration process between each wash.
NOTE: There is no need to change the tube after each wash.
4. Collagenase Digestion 1
- Add 20 mL of the Collagenase Digestion Buffer to the washed colon fragments in the 50 mL polypropylene conical tube.
- Place the closed 50 mL tube at 37 °C in an incubated orbital shaker with the rotation rate set at 2 x g for 60 min. Ensure the tissue fragments are in constant motion during agitation; if necessary, increase the rotation rate incrementally to ensure that no tissue fragments settle to the tube bottom.
5. Prepare Silica-based Separation Media Gradients
- Prepare 66% and 44% Silica-based Density Separation Media, using 100% Silica-based Density Separation Media at 20 °C (room temperature) and Colon Buffer.
- Pour 5 mL of 66% Silica-based Density Separation Media into each of 3 separate 15 mL polypropylene tubes. Prepare 3 tubes per colon. This forms the higher density base of the gradient isolation procedure, onto which lower density separation media will be layered to create the separation gradient.
- Store at 20 °C until use.
6. Collection of Supernatant from Digestion 1
- Collect only the supernatant using a 25 mL serological pipette and filter the supernatant through a 40 μm pore filtration fabric cell strainer placed into a clean 50 mL polypropylene conical tube, after Collagenase Digestion 1 is completed. Be careful not to aspirate any existing tissue fragments.
NOTE: Retain any remaining visible tissue fragments in the tube. These will undergo second collagenase digestion (step 8).
7. Quenching Collagenase Digestion Buffer
- Fill the 50 mL polypropylene tube completely with chilled Colon Buffer.
NOTE: Collagenase is active at 37 °C; hence chilled buffer inactivates this enzyme. - Centrifuge the tube at 4 °C at 800 x g for 5 min.
- Discard the supernatant via vacuum aspiration. Wash cells with 25 mL of fresh Colon Buffer and centrifuge at 800 x g for 5 min.
- Resuspend the pellet in less than 1 mL of fresh chilled Colon Buffer.
- Place the 50 mL polypropylene conical tube on ice.
8. Collagenase Digestion 2
- Repeat step 4 (Digestion 1) with the remaining tissue fragments retained from step 6.1.
9. Tissue Disaggregation Following Digestion 2
- Flush the tissue fragments vigorously back and forth between the tube and a 10 mL syringe through an 18 G blunt-end needle.
- Repeat this flush for a minimum of 7-8 complete passages, continuing until no gross tissue fragments or debris are visible.
10. Filter Cells
- Pass the tissue disaggregation suspension through a 40 μm-pore filtration fabric cell strainer into a clean 50 mL polypropylene tube.
- Wash the filtration fabric cell strainer with 10 mL chilled Colon Buffer to recover any cells ensnared in the filter.
11. Quenching Collagenase Digestion
- Fill the 50 mL polypropylene conical tube to the rim with chilled Colon Buffer.
NOTE: The temperature of Colon Buffer is critical to ensure quenching of collagenase activity. - Spin at 4 °C and 800 x g for 5 min.
- Discard the supernatant via vacuum aspiration.
- Wash by resuspending in 25 mL of fresh chilled Colon Buffer, followed by centrifugation at 4 °C, 800 x g for 5 min.
- Discard the supernatant via vacuum aspiration.
- Pool the resuspended pellet from Collagenase Digestion 1 (step 7) to its corresponding tube from step 11.4.
- Repeat Step 11.4 (wash and centrifugation).
12. Silica-based Density Separation Media Gradient Separation
NOTE: Perform steps 12-18 as quickly as possible, to ensure rapid quenching of collagenase activity.
- Following step 11.7, resuspend each pellet in 24 mL total of 44% Silica-based Density Separation Media per colon.
- Slowly layer 8 mL of the media from step 12.1 onto each of three tubes prepared at step 5.2 (containing 66% Silica-based Density Separation Media), using a 10 mL serological pipette. Maintain a steady and slow flow of the 44% Density Separation Media while layering the gradient in order to avoid disruption of the interface.
- Carefully balance all tubes within the centrifuge buckets using a weigh scale or a balance.
- Spin the tubes 20 min at 859 x g in a centrifuge without brake at 20 °C. Allow the rotors to come to complete rest before removing tubes, taking care not to disrupt the cells at the gradient interface.
13. Collect Mononuclear Cells from the Gradient Interface
- Visualize the gradient interface (near the 5 mL mark), where typically a 1-2 mm thick white band (containing MNC) is present.
NOTE: One may or may not see a white band. However, MNC will be at this interface and should cloud the clarity of the gradient interface. - Vacuum aspirate and discard the top 7 mL of the top gradient to allow easier pipette access to the interface.
- Using continuous manual suction and steady rotating wrist motion, collect the interface layer of cells into a clean 50 mL polypropylene conical tube. Collect until the interface between the 2 gradients is clear and refractile (clear of cells).
- Fill the collection tube with 50 mL of chilled FACS Buffer. Spin at 4 °C, 800 x g for 5 min.
- Aspirate the supernatant via vacuum aspiration and resuspend the pellet in 1 mL of FACS Buffer.
- Count the cells on a hemocytometer at a 1:2 dilution using appropriate dead cell exclusion methods.
- Proceed to FACS staining or other assays with freshly isolated colonic MNC.
Results
When working with murine colon disease models, it is helpful to be able to both quantify and qualitatively assess, among the MNC of the colon, multiple immune cell subsets involved in the inflammatory process. The single-cell suspension of MNC obtained through the application of this protocol facilitates such phenotypic characterization in a robust and reproducible manner. As a proof of principle for the application of this isolation method under diverse experimental settings, we retrieved colonic MNC using this method and performed multi-parameter flow cytometry on cells isolated from mice with (Figure 1 and Figure 2, allogeneic BMT) and without (Figure 2A, syngeneic BMT) significant immune-mediated colonic injury following BMT.
Flow cytometry and data analyses were performed to compare the fractions of apoptotic and necrotic dead lymphocytes when using either Collagenase E or D for the isolation, with or without DNase 1 treatment. The gating strategy used during flow cytometry is provided in Figure 1A. Following Annexin V (apoptosis marker) and fixable Live/Dead Blue dye (necrosis marker) staining on single-cell suspensions following each isolation, Collagenase E without DNAse showed a significantly higher percentage of Annexin Vneg Live/Dead Blueneg live cells (median 43.3%, range 26.5%-59.9% ,n = 3) after isolation when compared to Collagenase D without DNAse (median 8.7%,range 3.6%-10.2%, n = 3), even when compared to Collagenase E + DNAse (median 8.18%, range 4.7%-20.4%, n = 3) or Collagenase D + DNAse (median 15.10%,range 9.9%-21.4%, n = 3). In addition, we identified Annexin VnegLive/Dead Blue+ necrotic cells at a median percentage of 41.0% in the Collagenase E group (range 37.1%-58.8%, n = 3) versus 90.0% in the Collagenase D group (range 69.7%-95.5%, n = 3), 75.9% in the Collagenase E + DNAse group, and 80.3% in the Collagenase D + DNAse group, respectively (range 65.7%-79.5%, range 54.9%-89.9%, n = 3). Representative FACS plots from n =1 animal in each group is shown Figure 1B).
As further proof of principle of the consistency and yield of viable MNC using this procedure in diseased mice, multi-parametric flow cytometry was applied to the MNC isolated from CD45.2 BALB/c recipient mice on day 7 after receiving BMT of either allogeneic (CD45.1 C57BL/6 donor) or syngeneic (CD45.1 BALB/c donor) BMT models. Using absolute MNC numbers multiplied by percentage gated immune subsets obtained by flow cytometry analyses, mean absolute numbers of donor CD4+ and CD8+ T cells extracted from the BMT recipient’s colon could be calculated and compared (n = 4 per group, Figure 2A). Since it can be important to identify and/or quantitate rare immune cell populations in such mouse models, we assessed rare subsets including donor derived (CD45.1+) Foxp3+ T regulatory cells (Treg) in both syngeneic and allogeneic BMT models. The gating strategy to reach donor Treg cells (CD4+CD25+FoxP3+) from the antibody-stained single cell suspension is shown (sequence of gates delineated by a red arrow; Figure 2B). Using this method, even rare subsets such as donor derived colonic Treg infiltrating recipient mouse colon after BMT could be analyzed (Figure 2C, representative plot; n = 1).
Figure 3 shows an extended application of this method in historic data from our group using the presented protocol to compare accumulation of GVHD-inducing CD8+ versus CD4+ donor-derived T cells in the colon of BALB/c mice either protected or not protected from GVHD by the pre-BMT treatment preparative (conditioning) regimen20. The tested preparative regimens included 800 cGy/myeloablative total body irradiation (TBI800) or non-myeloablative TBI (400TBI), as well as nonmyeloablative conditioning using total lymphoid irradiation (TLI) in which irradiation was delivered to the lymph nodes, thymus, and spleen with shielding of the skull, lungs, limbs, pelvis and tail. All conditioning was combined with anti-thymocyte serum (ATS), an immunomodulating agent. As early as day 6 after BMT, this colonic MNC isolation protocol resulted in robust flow cytometric analyses as compared to identical analyses on more lymphocyte enriched GVHD target organs such as spleen and mesenteric lymph nodes (MLN) (Figure 3A)20. Reproducible isolation of colonic MNC across BMT recipients (n = 7-10 per treatment group) allowed for a robust statistical comparison of absolute numbers of donor CD8+ effector T cells between different pre-transplant conditioning treatment groups (Figure 3B), yielding important data on immune phenotypes that led to key studies revealing the innate immune mechanisms of GVHD protection from TLI as opposed to TBI pre-BMT conditioning.20
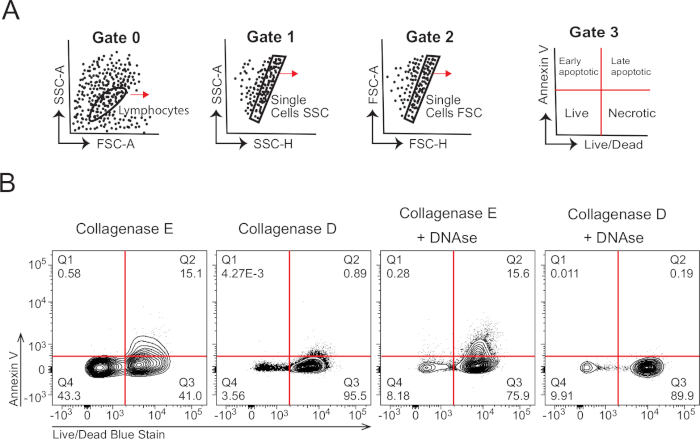
Figure 1: Flow cytometric analysis of colonic MNC at Day 7 after BMT in allogeneic mouse model systems when isolated with Collagenase E and D with and without DNAse 1. Wild-type (WT) (CD45.2+) BALB/c (H2Kd+) mice received BMT from CD45 congenic (CD45.1+) C57BL/6 donor mice (allogeneic BMT, n = 3 per group). WT (CD45.2+) BALB/c recipient mice were administered 800cGy TBI (BALB/c) 1 day before BMT. At day 7 after BMT, single-cell suspensions of recipient colon were prepared following the methods of this manuscript with the use of Collagenase E (100 U/mL), Collagenase E (100 U/mL) with DNAse 1 (500 μg/mL), Collagenase D (500 μg/mL), or Collagenase D (500μg/mL) with DNAse 1 (500μg/mL) (n = 3 per group). Cells were stained with Live/dead-UV450 (Live/Dead Blue), Annexin V-APC, H-2Kd-PE, CD45.1-BV605, CD3-FITC, CD4-BV711, CD8-APC-Cy7, FoxP3-Pacific Blue, and CD11b-PE-Cy7 antibodies. (A) Gating strategy for FACS analyses. Gate 0, forward scatter (FSC-A) and side scatter (SSC-A) on the single-cell suspension of MNC used to identify leukocytes; Gate 1, exclusion of non-single cells using SSC-A; Gate 2, exclusion of non-single cells using FSC-A; Gate 3, identification of Annexin V-positive (apoptotic) and fixable viability dye Live/Dead-UV450+Annexin V-negative (necrotic) cell subsets. (B) Representative FACS plots of Annexin V and fixable viability dye staining of gated leukocytes among MNC for the 4 experimental groups. N =1 representative mouse per group in groups: Collagenase E (100 U/mL), Collagenase E (100 U/mL) + DNAse 1 (500 μg/mL), Collagenase D (500 μg/mL), and Collagenase D (500 μg/mL) + DNAse 1(500 μg/mL). Please click here to view a larger version of this figure.
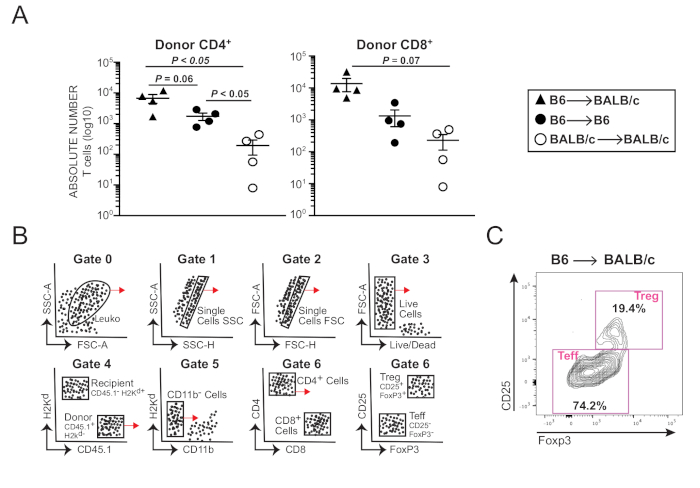
Figure 2: Flow cytometric characterization of colonic MNC at Day 7 after BMT in allogeneic and syngeneic mouse model systems. WT (CD45.2+) C57BL/6 (H2Kd-neg) and BALB/c (H2Kd+) mice received BMT from CD45-congenic (CD45.1+) C57BL/6 and BALB/c donor mice (syngeneic or allogeneic BMT, n = 4 per experimental group). C57BL/6 and BALB/c recipient mice received preparative conditioning regimens of 950cGy (C57BL/6) and 800cGy (BALB/c) myeloablative TBI, delivered one day before BMT. At day 7 after BMT, single-cell suspensions of recipient colonic MNC were prepared following the methods of this manuscript. Cells were stained with Live-dead-BV510, H-2Kd-PE, CD45.1-BV605, CD4-FITC, CD8-APC-Cy7, CD25-PacificBlue, FoxP3-AF647, and CD11b-PE-Cy7 antibodies, N = 4 mice per group. (A) Mean ± SEM absolute number (log 10) CD45.1+ H-2kd-neg or CD45.1+ H-2kd+ (donor-type, in each case) CD11bnegCD4+ and CD8+ T cells isolated from recipient colon at day 7 after conditioning and CD45.1 C57BL/6 (donor) → CD45.2 BALB/c (recipient) BMT. N = 4 per group. (B) Gating strategy for FACS analyses. Gate 0, forward scatter (FSC-A) and side scatter (SSC-A) on the single-cell suspension of MNC used to identify leukocytes; Gate 1, exclusion of non-single cells using SSC-A; Gate 2, exclusion of non-single cells using FSC-A; Gate 3, live cell selection Gate 4, separation of hematopoietic cells of BMT donor versus BMT recipient origin; Gate 5, selection of donor non-myeloid lineage cells; Gate 6, selective gating of CD4+ T cells; Gate 7, separate gating of CD4+CD25+FoxP3+ T regulatory (Treg) cells. The red arrow denotes drill-down gating strategy. (C) Representative FACS plots of CD25 and FoxP3 staining using the gating strategy in (B) at day 7 after conditioning and BMT in the colon of a BALB/c recipient of allogeneic BMT (C57BL/6 →BALB/c). Percentage of cells in each gate is given within the gate. WT = wild type; TBI = total body irradiation; BM = 10 x 106 CD45.1+ congenic C57BL/6 or BALB/c donor bone marrow cells; Teff = T effector cells; Treg = Foxp3+ T regulatory cells. Please click here to view a larger version of this figure.
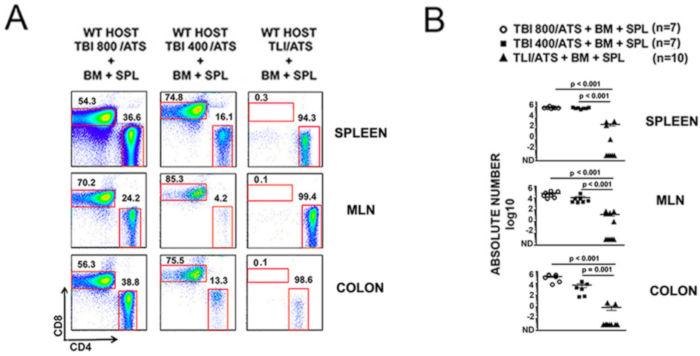
Figure 3: Non-myeloablative TLI/ATS but not TBI/ATS conditioning decreases donor TCRαβ+CD8+ effector T cell accumulation. (A) Representative FACS plots of CD4 and CD8 staining of gated H-2Kb+TCRαβ+ cells from donor H-2Kb+ C57BL/6 mice in spleen (top row), mesenteric lymph node (MLN) (middle row), and colon (bottom row) of recipients at day 6 after conditioning and transplantation. Percentage of cells in each gate is given above the gate. (B) Mean ± SEM absolute number (log 10) H-2Kb+TCRαβ+CD8+ cells in spleen (top panel), MLN (middle panel), and colon (bottom panel) of recipients at day 6 after conditioning and BMT. WT = wild-type; TBI = total body irradiation; TLI =: total lymphoid irradiation; ATS = anti-thymocyte serum; BM = 50 x 106 WT C57BL/6 donor bone marrow cells; SPL = 60 x 106 WT C57BL/6 donor spleen cells; TBI800, TBI400 = cGy doses of myeloablative (TBI800) or non-myeloablative (TBI400) TBI. *This figure has been modified from van der Merwe et al.20.Copyright 2013. The American Association of Immunologists, Inc. Please click here to view a larger version of this figure.
| Solution | Formula |
| Colon Buffer | 500 mL RPMI + 10mM HEPES + 10% FBS (heat-inactivated at 56oC for 60 minutes, pH adjusted to 7.3) |
| Silica-Based Density Gradient Media 100% (per colon) | 22.5 mL of Silica-Based Density Gradient Media + 2.5 mL of 10x PBS. |
| Silica-Based Density Gradient Media 66% (per colon) | 10.72 mL Silica-Based Density Gradient Media 100% + 5.28 mL Colon Buffer |
| Silica-Based Density Gradient Media 44% (per colon) | 11 mL Silica-Based Density Gradient Media 100% + 14 mL Colon Buffer |
| Collagenase Digestion Buffer (per colon) | 100 U/mL of Collagenase E from Clostridium histolyticum, dissolved in 40 mL Colon Buffer |
| FACS Buffer | 500 mL 1x PBS + 5 g BSA + 1 mm EDTA + 0.2 g Sodium Azide |
Table 1: Solution Preparation Table.
Discussion
This visual protocol describes well-tolerated methods for the isolation of colonic mononuclear cells including lamina propria lymphocytes (LPL). Given that this protocol was optimized in evaluating severe post-transplant mouse colitis models where inflammatory cytokines and tissue injury lend themselves to poor viability of recovered MNC, we anticipate that these methods can be translated to other applications requiring phenotypic analysis of colonic MNC. These include but, are not limited to assessing colon inflammation in mouse models of inflammatory bowel disease, studies of immune responses of colitis-targeted treatments, and colitis produced by infectious pathogens. Additionally, our data using isolations in healthy (syngeneic BMT) mice indicate that the isolation procedure does not require significant inflammatory infiltrate to allow immune cell detection in the MNC isolates. Indeed, similar data have been obtained using untreated healthy (non-BMT) mice (data not shown).
Several key steps of this protocol differentiate it from other published methods and contribute to high yield and viability. For instance, optimization of Clostridium histolyticum-derived collagenase E activity (100 U/mL final activity level) allows consistent calculations for different lots of enzyme over long-range experiments26. There are 28 different members in the collagen family, together constituting nearly 30% of all proteins in the mammalian body27. In addition, different tissues have distinct distributions of collagen subtypes, each requiring unique collagenases for digestion28. Collagenase from C. histolyticum includes 6 different proteins classified into two classes29,30. The specific type of collagenase used can alter the viability and overall quality of the cells isolated from the colon31. Previous studies have demonstrated that collagenase type C-2139 (Collagenase E) allows a high yield of lymphocytes among MNC isolated from the small intestine25. However, these protocols did not address digestion of colon, a much more muscular organ with significantly more complex collagen composition than the small intestine.
Adequacy and dependability of enzymatic tissue degradation is an established factor influencing overall cell yield and viability by minimizing the need for recurrent mechanical disruption (which induces increased mechanical trauma to the tissue). Due to adequate enzymatic digestion of the interstitial and mucosal collagen using a collagenase E-specific protocol (as compared to collagenase D-mediated digestion protocols in standard use), this protocol minimizes the amount of mechanical manipulation of the tissue fragments required to disrupt the interstitium and release immune cell subsets into suspension. This further enhances the viability of isolated MNC for subsequent assays. As demonstrated in the data (Figure 1B), this eliminates the need for DNAse and other chemical or mechanical anti-clumping maneuvers beyond standard filtration of a single cell suspension through a strainer. Other reports outlining the isolation of intestinal lymphoid cells have used dithiothreitol (DTT) and EDTA as mucolytic agents to enhance both yield and viability of the isolated mononuclear leukocytes24.
Another unique aspect of this protocol which improves cell yield is the application of a fine-tuned silica-based density separation media gradient. Other digestion methods papers published to date do not use such a density separation gradient21,31. However, in the authors’ experience and those of collaborators utilizing this protocol to isolate functionally active lymphoid cells, density gradient purification improves both the viability and the purity of MNC recovered following digestion19,20,32.
Though not a focus of this manuscript, worthy of mention for those working with intestinal inflammation models in mice is that the methods in this manuscript can be modified to allow similar high-quality isolation of viable MNC from the small intestine. The modification of the primary colonic protocol required to achieve this is the use of a single 90-min digestion (rather than two 60-min digestions), with all other steps (including enzyme activity level and quench steps) identical to those shown. This modification typically yields a range of 0.8-4 x 10⁶ MNC per small intestine without or 1.5-2.5 x 10⁶ MNC with the inclusion of the terminal ileum including the leukocyte-rich cecal cap. Therefore, one novelty of this protocol is that applying the primary protocol to the colon and the modified protocol to the small intestine, one could isolate MNC with high reproducibility and good viability from both small intestine and colon of individual experimental animals in the same experiment.
In summary, the protocol described allows efficient and reproducible isolation of mononuclear cells from the colon or, with modifications, the small intestine. With 2 proficient operators working together, as many as 10 separate colons can be processed and analyzed on a single day, and single-cell suspensions can be ready for subsequent phenotypic and functional analysis within 6-8 h from tissue harvest. Application of this protocol may prove valuable for other research aims needing immune assessment of colonic inflammation, allowing other investigators to characterize the immune system of the mouse colon in a rigorous and reproducible manner.
Disclosures
The authors declare no competing financial interests.
Acknowledgements
This work was supported by grants #1K08HL088260 and #1R01HL133462-01A1 (NHLBI) (A.B.P., H.N., S.J.), and the Batchelor Foundation for Pediatric Research (D.M., H.N., S.J., A.A.H., A.B.P.). C57BL/6 and BALB/c mice used in this study were either bred in our facility or provided by Jackson Labs or Taconic.
Materials
| Name | Company | Catalog Number | Comments |
|---|---|---|---|
| 60 mm Petri DIsh | Thermo Scientific | 150288 | |
| 1x PBS | Corning | 21-040-CV | |
| 10x PBS | Lonza BioWhittaker | BW17-517Q | |
| 10 mL Disposable Serological Pipette | Corning | 4100 | |
| 10 mL Syringe | Becton Dickinson | 302995 | |
| 15 mL Non-Sterile Conical Tubes | TruLine | TR2002 | |
| 18 G Blunt Needle | Becton Dickinson | 305180 | |
| 25 mL Disposable Serological Pipette | Corning | 4250 | |
| 40 μm pore size Cell Strainer | Corning | 352340 | |
| 50 mL Falcon Tube | Corning | 21008-951 | |
| Bovine Serum Albumin (BSA) | Sigma | A4503-1KG | |
| Fixation Buffer | Biolegend | 420801 | |
| E. coli Collagenase E from Clostridium histolyticum | Sigma | C2139 | |
| EDTA, 0.5 M Sterile Solution | Amresco | E177-500ML | |
| Fetal Bovine Serum | Thermo /Fisher Scientific -HyCLone | SV30014.03 | |
| HEPES | GE Healthcare-HyClone | SH30237.01 | |
| Percoll | GE Healthcare-Life Sciences | 1708901 | |
| RPMI Medium | Corning | 17-105-CV | |
| Sodium Azide | VWR Life Science Amresco | 97064-646 | |
| Trypan Blue | Lonza BioWhittaker | 17-942E |
References
- Schneeman, B. Gastrointestinal physiology and functions. British Journal of Nutrition. 88, S159-S163 (2002).
- Arranz, E., Pena, A. S., Bernardo, D. Mediators of inflammation and immune responses in the human gastrointestinal tract. Mediators of inflammation. 2013, 1-3 (2013).
- Blumberg, R. S. Inflammation in the intestinal tract: pathogenesis and treatment. Digestive diseases. 27 (4), 455-464 (2009).
- Pabst, R., Russell, M. W., Brandtzaeg, P. Tissue Distribution of Lymphocytes and Plasma Cells and the Role of the Gut. Trends in Immunology. 29 (5), 206-208 (2008).
- Reibig, S., Hackenbrunch, C., Hovelmeyer, N. Isolation of T Cells from the Gut. T-Helper Cells: Methods and Protocols, Methods in Molecular Biology. Waisman, A., Becher, B. , Humana Press. New York, NY. 21-25 (2014).
- Mowat, A. M., Agace, W. W. Regional Specialization within the Intestinal Immune System. Nature Reviews Immunology. 14 (10), 667-685 (2014).
- Brandtzaeg, P., Kiyono, H., Pabst, R., Russell, M. W. Terminology: Nomenclature of mucosa-associated lymphoid tissue. Mucosal Immunology. 1 (1), 31-37 (2008).
- Schieferdecker, H. L., Ullrich, R., Hirseland, H., Zeitz, M. T cell differentiation antigens on lymphocytes in the human intestinal lamina propria. Journal of Immunology. 148 (8), 2816-2822 (1992).
- Mowat, A. M., Viney, J. L. The anatomical basis of intestinal immunity. Immunological Reviews. 156, 145-166 (1997).
- Ford, A. C., Lacy, B. E., Talley, N. J. Irritable Bowel Syndrome. The New England Journal of Medicine. 376 (26), 2566-2578 (2017).
- Harb, W. J. Crohn's Disease of the Colon, Rectum, and Anus. Surgical Clinics of North America. 95 (6), 1195-1210 (2015).
- Ungaro, R., Mehandru, S., Allen, P. B., Pyrin-Biroulet, L., Colombel, J. F. Ulcerative Colitis. The Lancet. 389 (10080), 1756-1770 (2017).
- Mohty, B., Mohty, M. Long-term complications and side effects after allogeneic hematopoietic stem cell transplantation: an update. Blood cancer journal. 1 (4), 1-5 (2011).
- Hatzimichael, E., Tuthill, M. Hematopoietic stem cell transplantation. Stem cells and cloning: advances and applications. 3, 105-117 (2010).
- Hernandez-Margo, P. M., et al. Colonic Complications Following Human Bone Marrow Transplantation. Journal of Coloproctology. 35 (1), 46-52 (2015).
- Del Campo, L., Leon, N. G., Palacios, D. C., Lagana, C., Tagarro, D. Abdominal Complications Following Hematopoietic Stem Cell Transplantation. Radio Graphics. 34 (2), 396-412 (2014).
- Lee, J., Lim, G., Im, S., Chung, N., Hahn, S. Gastrointestinal Complications Following Hematopoietic Stem Cell Transplantation in Children. Korean Journal of Radiology. 9 (5), 449-457 (2008).
- Takatsuka, H., Iwasaki, T., Okamoto, T., Kakishita, E. Intestinal Graft-Versus-Host Disease: Mechanisms and Management. Drugs. 63 (1), 1-15 (2003).
- Shuyu, E., et al. Bidirectional immune tolerance in nonmyeloablative MHC-mismatched BMT for murine β-thalassemia. Blood. 129 (22), 3017-3030 (2017).
- van der Merwe, M., et al. Recipient myeloid-derived immunomodulatory cells induce PD-1 ligand-dependent donor CD4+Foxp3+ regulatory T cell proliferation and donor-recipient immune tolerance after murine nonmyeloablative bone marrow transplantation. Journal of Immunology. 191 (11), 5764-5776 (2013).
- Couter, C. J., Surana, N. K. Isolation and Flow Cytometric Characterization of Murine Small Intestinal Lymphocytes. Journal of Visualized Experiments. (111), e54114(2016).
- Qiu, Z., Sheridan, B. S. Isolating Lymphocytes from the Mouse Small Intestinal Immune System. Journal of Visualized Experiments. (132), e57281(2018).
- Weigmann, B. Isolation and subsequent analysis of murine lamina propria mononuclear cells from colonic tissue. Nature Protocols. 2, 2307-2311 (2007).
- Bull, D. M., Bookman, M. A. Isolation and functional characterization of human intestinal mucosal lymphoid cells. Journal of Clinical Investigation. 59 (5), 966-974 (1977).
- Davies, M. D., Parrott, D. M. Preparation and purification of lymphocytes from the epithelium and lamina propria of murine small intestine. Gut. 22, 481-488 (1981).
- Carrasco, A., et al. Comparison of Lymphocyte Isolation Methods for Endoscopic Biopsy Specimens from the Colonic Mucosa. Journal of Immunological Methods. 389 (1-2), 29-37 (2013).
- Zhang, Y., Ran, L., Li, C., Chen, X. Diversity, Structures, and Collagen-Degrading Mechanisms of Bacterial Collagenolytic Proteases. Applied and Environmental Microbiology. 81 (18), 6098-6107 (2015).
- Harrington, D. J. Bacterial collagenases and collagen-degrading enzymes and their potential role in human disease. Infection and immunity. 64 (6), 1885-1891 (1996).
- Duarte, A. S., Correia, A., Esteves, A. C. Bacterial collagenases - A review. Critical Reviews in Microbiology. 42 (1), 106-126 (2014).
- Autengruber, A., et al. Impact of Enzymatic Tissue Disintegration on the Level of Surface Molecule Expression and Immune Cell Function. European Journal of Microbiology and Immunology. 2 (2), 112-120 (2012).
- Goodyear, A. W., Kumar, A., Dow, S., Ryan, E. P. Optimization of Murine Small Intestine Leukocyte Isolation for Global Immune Phenotype Analysis. Journal of Immunological Methods. 405, 97-108 (2014).
- van der Heijden, P. j, Stok, W. Improved Procedure for the Isolation of Functionally Active Lymphoid Cells from the Murine Intestine. Journal of Immunological Methods. 3 (2), 161-167 (1987).
Reprints and Permissions
