Parasponia andersonii is a fast-growing tropical tree that belongs to the Cannabis family (Cannabaceae) and can form nitrogen-fixing root nodules in association with the rhizobium. Here, we describe a detailed protocol for reverse genetic analyses in P. andersonii based on Agrobacterium tumefaciens-mediated stable transformation and CRISPR/Cas9-based genome editing.
Method Article
Transforming, Genome Editing and Phenotyping the Nitrogen-fixing Tropical Cannabaceae Tree Parasponia andersonii
In This Article
Summary
Abstract
Parasponia andersonii is a fast-growing tropical tree that belongs to the Cannabis family (Cannabaceae). Together with 4 additional species, it forms the only known non-legume lineage able to establish a nitrogen-fixing nodule symbiosis with rhizobium. Comparative studies between legumes and P. andersonii could provide valuable insight into the genetic networks underlying root nodule formation. To facilitate comparative studies, we recently sequenced the P. andersonii genome and established Agrobacterium tumefaciens-mediated stable transformation and CRISPR/Cas9-based genome editing. Here, we provide a detailed description of the transformation and genome editing procedures developed for P. andersonii. In addition, we describe procedures for the seed germination and characterization of symbiotic phenotypes. Using this protocol, stable transgenic mutant lines can be generated in a period of 2-3 months. Vegetative in vitro propagation of T0 transgenic lines allows phenotyping experiments to be initiated at 4 months after A. tumefaciens co-cultivation. Therefore, this protocol takes only marginally longer than the transient Agrobacterium rhizogenes-based root transformation method available for P. andersonii, though offers several clear advantages. Together, the procedures described here permit P. andersonii to be used as a research model for studies aimed at understanding symbiotic associations as well as potentially other aspects of the biology of this tropical tree.
Introduction
Parasponia andersonii is a tropical tree belonging to the Cannabis family (Cannabaceae) and is native to Papua New Guinea and several Pacific Islands1,2,3. Together with 4 additional Parasponia species, it represents the only non-legume lineage that can establish a nitrogen-fixing nodule symbiosis with rhizobia. This symbiosis is well studied in the legume (Fabaceae) models Medicago truncatula and Lotus japonicus, which has resulted in acquiring detailed knowledge of the molecular genetic nature of nodule formation and functioning4. Additionally, it was demonstrated that the root nodule symbiosis in legumes is founded on the much older, and widespread arbuscular mycorrhizal symbiosis5. Phylogenomic comparisons suggest that the nitrogen-fixing nodule symbioses of legumes, Parasponia, as well as, the so-called actinorhizal plant species that host diazotrophic Frankia bacteria, have a shared evolutionary origin6,7,8. To determine whether the genes identified to be involved in the legume nodule formation are the part of a conserved genetic basis, studies on non-legume species are essential. To this end, we propose to use P. andersonii as a comparative research model, alongside legumes, to identify the core genetic networks underlying root nodule formation and functioning.
P. andersonii is a pioneer that can be found on the slopes of volcanic hills. It can meet growth speeds of 45 cm per month and reach lengths of up to 10 meters9. P. andersonii trees are wind-pollinated, which is facilitated by the formation of separate male and female flowers3,10. We recently sequenced and annotated the diploid genome (2n = 20; 560 Mb/1C) of P. andersonii, and assembled draft genome sequences of 2 additional Parasponia species; P. rigida and P. rugosa6. This revealed ~35,000 P. andersonii gene models that can be clustered in >20,000 orthogroups together with genes from M. truncatula, soybean (Glycine max), Arabidopsis thaliana, woodland strawberry (Fragaria vesca), Trema orientalis, black cotton poplar (Populus trichocarpa) and eucalypt (Eucalyptus grandis)6. Additionally, transcriptome comparisons between M. truncatula and P. andersonii identified a set of 290 putative orthologues that display a nodule-enhanced expression pattern in both species6. This provides an excellent resource for comparative studies.
To study the gene function in P. andersonii roots and nodules, a protocol for Agrobacterium rhizogenes-mediated root transformation has been established11. Using this protocol, compound plants bearing transgenic roots can be generated in a relatively short time frame. This method is, also, widely applied in the legume-symbiosis research12,13,14. However, the disadvantage of this method is that only roots are transformed and that each transgenic root represents an independent transformation event, resulting in substantial variation. Also, the transformation is transient and transgenic lines cannot be maintained. This makes A. rhizogenes-based root transformation less suited for CRISPR/Cas9-mediated genome editing. Additionally, A. rhizogenes transfers its root inducing locus (rol) genes to the plant genome, which once expressed interfere with hormone homeostasis15. This makes studying the role of plant hormones in A. rhizogenes-transformed roots challenging. To overcome these limitations, we recently developed a protocol for Agrobacterium tumefaciens-based transformation and CRISPR/Cas9-mediated mutagenesis of P. andersonii10.
Here, we provide a detailed description of the A. tumefaciens-based transformation procedure and reverse genetics pipeline developed for P. andersonii. Additionally, we provide protocols for the downstream handling of transgenic plantlets, including assays to study symbiotic interactions. Using the protocol described here, multiple transgenic lines can be generated in a 2-3 months period. In combination with CRISPR/Cas9-mediated mutagenesis, this allows efficient generation of knockout mutant lines. These mutant lines can be vegetatively propagated in vitro10,16,17, which allows sufficient material to be generated to start phenotypic characterization at 4 months after the transformation procedure has been initiated10. Together, this set of procedures should allow any lab to adopt P. andersonii as a research model for studies aimed at understanding rhizobial and mycorrhizal associations, as well as potentially other aspects of the biology of this tropical tree.
Protocol
1. Grow P. andersonii Trees in the Greenhouse
- Germinate P. andersonii WU1 seeds18.
- Use fresh Parasponia berries or soak dried berries in water for 2 h to rehydrate. Squash berries on a piece of tissue paper or rub against the inside of a tea sieve to remove the seeds.
- Disinfect seeds using commercial bleach (~4% hypochlorite) for 15-20 min and subsequently wash the seeds 6 times using sterilized water.
- Transfer the seeds to sterile 200 μL PCR tubes. Fill the tubes with sterilized water, such that the seeds are completely submerged. Incubate the tubes for 10 days in a thermocycler running the following program: 30 cycles (7 °C for 4 h, 28 °C for 4 h). Do not use a heated lid, as this might kill the seeds.
- Prepare SH-0 plates (see Table 1). Transfer the seeds to SH-0 plates and incubate at 28 °C, 16 h:8 h day:night. Close plates with 2 layers of elastic sealing foil to prevent drying during incubation at 28 °C.
- After seedlings have developed their first set of true leaves (~3-4 weeks after incubation at 28 °C), transfer seedlings to pots filled with commercial potting soil and cover the seedlings with a translucent plastic cup to prevent desiccation. Place pots in a 28 °C climate room or greenhouse, ~85% RH, under a 16 h:8 h day:night regime.
- After 1 week, remove the translucent plastic cup. Water the pots regularly and when trees grow bigger supplement with fertilizer to sustain growth.
2. Cloning of Constructs for CRISPR/Cas9-mediated Mutagenesis of P. andersonii
NOTE: Standard binary transformation vectors can be used for the stable transformation of P. andersonii. Here, as an example, is a procedure to generate constructs for CRISPR/Cas9-mediated mutagenesis using modular cloning (e.g., Golden Gate)19.
- Identify guide RNA target sequences for the gene(s) of interest, using bioinformatics software featuring a built-in CRISPR design tool. Choose guide RNA sequences located at the 5’-end of the coding sequence of the target gene to increase the chance of obtaining full knockouts. Make sure to check for off-target effects by searching against the P. andersonii genome6.
NOTE: Use 2 sgRNAs per target gene, preferably 200-300 bp apart. This may generate deletions that can be identified by PCR and subsequently by agarose gel electrophoresis. - Generate level 1 Golden Gate constructs containing the sgRNA sequences.
- Design primers to amplify each individual sgRNA by inserting the 20 bp guide sequence at the position of N(20) in the following primer sequence: 5’-TGTGGTCTCAATTGN(20) GTTTTAGAGCTAGAAATAGCAAG-3’.
NOTE: If the guide sequence equals GN(19), remove the G at the 5’ end of the guide sequence before inserting in the primer sequence. - PCR amplify sgRNAs from pICH86966::AtU6p::sgRNA_PDS20 using the forward primers designed at step 2.2.1 and the universal reverse primer: 5’-TGTGGTCTCAAGCGTAATGCCAACTTTGTAC-3’. Use a high-fidelity heat-stable DNA polymerase and the following PCR conditions: 98 °C for 30 s; 30 cycles (98 °C for 10 s; 53 °C for 20 s; 72 °C for 10 s); 72 °C for 7 min. Successful PCR reactions yield a 165 bp amplicon.
- Column-purify the PCR amplicon using a commercial PCR purification kit. Subsequently, set up Golden Gate reactions to clone sgRNAs behind the Arabidopsis thaliana AtU6p small RNA promoter: 10 ng of the sgRNA PCR amplicon, 150 ng of pICSL01009::AtU6p20, 60 ng of the appropriate level 1 acceptor vector, 2 µL of T4 ligase buffer, 2 µL 0.1% of bovine serum albumin (BSA), 0.5 µL of BsaI, 0.5 µL of T4 ligase, fill to 20 µL with ultra-pure water. Ensure that all sgRNAs are cloned in the same orientation to prevent hairpin formation.
- Incubate reactions in a thermocycler running the following program: 37 °C for 20 s; 26 cycles (37 °C for 3 min; 16 °C for 4 min); 50 °C for 5 min; 80 °C for 5 min. Transform Golden Gate reactions to Escherichia coli and plate on LB medium21 containing ampicillin (50 mg/L), X-Gal (200 mg/L) and IPTG (1 mM).
NOTE: Prepare stock solutions of IPTG and X-Gal in ultra-pure water and dimethylformamide, respectively. Filter sterilize the ampicillin and IPTG stock solutions and store all stocks at -20 °C. Wear gloves when handling dimethylformamide. - Select white colonies and isolate plasmids using a commercial plasmid isolation kit. Sequence verify isolated plasmids before continuing with Golden Gate level 2 assembly.
- Design primers to amplify each individual sgRNA by inserting the 20 bp guide sequence at the position of N(20) in the following primer sequence: 5’-TGTGGTCTCAATTGN(20) GTTTTAGAGCTAGAAATAGCAAG-3’.
- Assemble level 2 Golden Gate constructs for the stable transformation.
- Perform a Golden Gate reaction using the level 1 AtU6p::sgRNA constructs (generated under section 2.2) as well as pICH47802::NPTII, pICH47742::35Spro::ΩNLS-aCas9::35Ster, the level 2 acceptor pICSL4723 and the appropriate end-linker (see Engler et al.22). Perform reactions as following: use ~100 fmol of each donor vector and ~20 fmol of the acceptor vector and add 2 µL of T4 ligase buffer, 2 µL of 0.1% BSA, 0.5 µL of BpiI, 0.5 µL of T4 ligase, fill to 20 µL with ultra-pure water.
NOTE: The level 1 plasmids pICH47802::NPTII, pICH47742::35Spro::ΩNLS-aCas9::35Ster need to be cloned first (see Supplemental File 1), as is described for sgRNAs under section 2.220,22,23. - Incubate reactions as under step 2.2.4 and transform into E. coli. Plate on LB medium containing kanamycin. Next day, select white colonies and isolate plasmids. Determine the correct plasmid assembly by restriction-digestion analysis.
- Perform a Golden Gate reaction using the level 1 AtU6p::sgRNA constructs (generated under section 2.2) as well as pICH47802::NPTII, pICH47742::35Spro::ΩNLS-aCas9::35Ster, the level 2 acceptor pICSL4723 and the appropriate end-linker (see Engler et al.22). Perform reactions as following: use ~100 fmol of each donor vector and ~20 fmol of the acceptor vector and add 2 µL of T4 ligase buffer, 2 µL of 0.1% BSA, 0.5 µL of BpiI, 0.5 µL of T4 ligase, fill to 20 µL with ultra-pure water.
- Transform level 2 constructs to Agrobacterium tumefaciens strain AGL124.
3. Stable Transformation of P. andersonii
- Inoculate 2 LB plates containing the appropriate antibiotics with A. tumefaciens strain AGL1 transformed with the construct of interest. Incubate plates at 28 °C for 2 days.
- Harvest young branches from greenhouse-grown trees. Use about 5 branches of 5-8 cm in length for each transformation. Ensure to only use healthy non-infected branches. Remove the leaves by cutting them as such that ~1 cm2 of leaf tissue is left at the end of each petiole. Discard the leaves.
- Disinfect tissue for 15 min using 1:1-diluted commercial bleach (~2% hypochlorite after dilution) containing a few drops of polysorbate 20. Then, rinse the tissue 6 times with autoclaved water.
NOTE: This step, as well as, the following steps need to be conducted inside a laminar down-flow cabinet to keep tissue sterile. - Re-suspend the A. tumefaciens cells from 1-2 plates in 25 mL of infiltration medium (see Table 1) containing acetosyringone (20 mg/L) and a non-ionic surfactant (0.001% v/v) to reach an optical density (OD600) of ~5.
NOTE: Prepare the acetosyringone stock solution in 70% ethanol and store at -20 °C. The non-ionic surfactant needs to be filter-sterilized before adding to the infiltration medium. - Cut both the stem and petiole tissue in pieces of ~1 cm in length inside the A. tumefaciens suspension, thereby creating fresh wounds at both sides. Leave tissue pieces in the A. tumefaciens suspension for 10-30 min.
- Prepare the rooting medium (see Table 1) and add acetosyringone (20 mg/L) after autoclaving. Dry tissue pieces on a sterile piece of filter paper and place it on the medium (~10 explants/plate). Incubate plates in dark at 21 °C for 2 days.
NOTE: Allow the medium to cool down to ~60 °C prior to adding acetosyringone. - After 2 days, inspect plates for fungal or obvious bacterial contamination (bacteria other than A. tumefaciens). Contaminated plates need to be discarded.
- Prepare liquid SH-10 medium (see Table 1). After autoclaving, add polysorbate 20 (0.01%, v/v). Transfer tissue pieces to 10 mL of SH-10 containing polysorbate 20. During a period of at least 10 min, gently agitate every 2-3 min to wash the tissue.
- Wash two additional times with fresh SH-10 containing polysorbate 20. These times, a 2-3 min incubation time per washing step is enough.
- Prepare the rooting medium (see Table 1). After autoclaving, add cefotaxime (300 mg/L) and kanamycin (50 mg/L) and pour plates. For the secondary transformations (transformations of transgenic kanamycin-resistant lines), apply hygromycin (15 mg/L) selection.
- Dry tissue pieces on sterile pieces of filter paper. Afterwards, transfer tissue pieces to the plates prepared in step 3.9.
- Incubate plates for 7 days at 28 °C, 16 h:8 h day:night. Every 2 days check plates for fungal or bacterial contamination and excessive growth of A. tumefaciens. In case of contamination, transfer non-infected pieces to a fresh plate.
- After 7 days, transfer tissue pieces to propagation medium (see Table 1) containing cefotaxime (300 mg/L) and kanamycin (50 mg/L). Incubate plates at 28 °C, 16 h:8 h day:night. Refresh plates once a week until transgenic shoots develop. Ensure to only transfer non-infected tissue pieces to fresh plates. Discard the pieces that are overgrown by A. tumefaciens.
- Once putatively-transgenic shoots are ≥1 cm in length, cut shoots and culture them independently in the propagation medium containing cefotaxime (300 mg/L) and kanamycin (50 mg/L). To ensure that shoots represent independent transformants, take only a single shoot from each side of an explant.
- Vegetatively propagate putatively-transgenic shoots as described under step 5.2.
4. Genotyping of Putatively-transgenic Shoots
- Design primers spanning the sgRNA recognition site(s). To allow PCR amplicon sequencing, choose primers 150-250 bp away from the sgRNA recognition site(s).
- Cut a leaf tip (~5 mm) from each transgenic shoot to be genotyped. Also, harvest a wild-type control sample.
- Perform 50 µL PCR reactions using the primers designed at step 4.1 and a commercial kit to directly amplify DNA from plant samples. Alternatively, PCR reactions can be performed on purified DNA using a high-fidelity polymerase.
- Separate PCR amplicons on a 1.5-2% agarose gel.
- Analyze the results from gel electrophoresis. Check for samples producing multiple bands (more than 1 allele) and PCR amplicons with sizes different from wild type, which indicates the presence of medium-sized indels.
- Sequence PCR amplicons to identify the exact mutations. For samples producing a single PCR amplicon, PCR products can be sequenced directly. Samples that produce more than 1 band after gel electrophoresis or that appear to be heterozygous after direct sequencing of the PCR amplicon, need to be cloned into a blunt-end cloning vector first. Subsequently, sequence multiple clones for each sample to identify all possible alleles present in the sample.
- Align sequencing results to the gene of interest and inspect the alignment to check for mutations near the sgRNA target site(s). Subsequently, check whether these mutations create frameshifts. Discard lines with > 2 alleles, and lines containing in-frame mutations.
- Select several lines for further analysis.
- Propagate selected lines as described under step 5.2.
- When lines have developed several new shoots, take new samples from ≥3 leaf tips and repeat steps 4.3-4.7. Determine whether the mutations present in each of the samples originating from the same line as well as the original PCR sample are identical. Lines that yield the same mutations in all samples are homogeneously mutated and can be used for further experimentation. Discard lines that do not yield the same results as these lines are chimeric.
5. Preparation of Rooted P. andersonii Plantlets for Experimentation
- Initiate a new tissue culture line of P. andersonii.
- Harvest axillary buds, young adventitious shoots or leaf tissue from healthy trees. Alternatively, seedlings can be used as a starting material.
- Disinfect tissue using 1:1-diluted commercial bleach (~2% hypochlorite after dilution) containing a few drops of polysorbate 20 for 15 min. Afterwards, rinse tissue 6 times using autoclaved water.
NOTE: This step, as well as, the following steps need to be conducted inside a laminar downflow or laminar crossflow cabinet to keep tissue sterile. - Transfer tissue to propagation medium (see Table 1). Close plates with 2 layers of elastic sealing foil and incubate plates at 28 °C, 16 h:8 h day:night.
- Inspect plates every few days during the first 2 weeks to ensure that tissue is free from fungal or bacterial contamination.
- Propagate tissue by placing ~10 shoots on a fresh plate of propagation medium and close the plate with 2 layers of elastic sealing foil. Incubate plates at 28 °C, 16 h:8 h day:night. Repeat this step every 4 weeks.
- When shoots are >1 cm in length, cut shoots at their base and place them on the rooting medium (see Table 1). About 10 shoots can be placed on a single rooting plate. Position shoots upright by inserting the basal tip of the shoot into the medium. Roots appear at 10-14 days after incubation of the plates at 28 °C, 16 h:8 h day:night.
NOTE: Do not root all shoots but keep part for tissue culture propagation (see step 5.2).
6. Nodulation of P. andersonii Plantlets in Pots
- Prepare rhizobium inoculum.
- Inoculate 10 mL of liquid YEM medium (see Table 2) from a single colony of Mesorhizobium plurifarium BOR26 and incubate at 28 °C for 2 days.
NOTE: M. plurifarium BOR2 is preferred as it efficiently nodulates P. andersonii. However, other rhizobium strains can also be used for nodulation of P. andersonii (e.g. Bradyrhizobium elkanii WUR325, Rhizobium tropici CIAT89926,27 or Bradyrhizobium sp. Kelud2A4). - Use the 10 mL culture to inoculate a larger volume of liquid YEM medium. The volume of this culture is dependent on the number of pots that need to be inoculated.
- Prepare liquid EKM medium (see Tables 3, Table 4). Centrifuge the bacterial culture for 10 min at 3,500 x g to harvest the cells. Subsequently, re-suspend the bacterial pellet in liquid EKM (use approximately the same volume as the original YEM culture) and determine the optical density (OD600).
- Inoculate 10 mL of liquid YEM medium (see Table 2) from a single colony of Mesorhizobium plurifarium BOR26 and incubate at 28 °C for 2 days.
- For ~20 pots, prepare 3 L of liquid EKM medium and inoculate with the rhizobial suspension prepared at step 6.1.3. to reach OD600 = 0.025.
- Mix 3 L of EKM containing rhizobia with 1,250 g of perlite. Subsequently, add 210 g of this mixture to sterile translucent polypropylene pots. Alternatively, instead of perlite, use sand as a substrate for nodulation assays.
- Plant 1-3 P. andersonii plantlets in each pot. Also, prepare several pots containing P. andersonii plantlets transformed with the CRISPR-control construct (see Supplementary Table 1). Weigh several pots to be able to determine water loss during the experiment. Cover the bottom of each pot to shield the roots from light exposure.
- Incubate pots in a climatized growth room (28 °C, 16 h:8 h day:night) for 4-6 weeks. Once a week, weigh several pots to determine water loss. If water loss exceeds 10 mL, supplement with ultra-pure water to compensate for the loss.
- After 4-6 weeks, clean the roots from perlite and determine nodule numbers using a binocular to examine the nodulation efficiency.
7. Nodulation of P. andersonii Plantlets on Plates
- Prepare cellophane membranes28.
- Cut the cellophane membrane to fit into a square 12 cm x 12 cm Petri dish. Cut the membranes a bit shorter at the top to allow space for the shoots to grow.
- To increase the permeability of cellophane membranes, boil the membranes in EDTA solution (1 g/L) for 20 min. Afterwards, rinse at least 6x with demineralized water to remove the EDTA.
NOTE: As the dry membrane tend to wrinkle when in contact with water, submerge the dry membranes one by one into the solution. - Arrange the membranes horizontally in a thin layer of water in a round glass plate. Sterilize the membranes by autoclaving twice.
- Place 1 autoclaved cellophane membrane on a square 12 x 12 cm Petri dish containing agar-solidified EKM medium (see Table 3, Table 4). Place two 3-week old rooted P. andersonii plantlets (see section 5) or 4-week old seedlings (see section 1.1) on the top of the membrane. Ensure to only pick plantlets or seedlings with roots that have white root tips, indicating that these roots are still growing.
- Gently cover the roots with a second cellophane membrane, creating a sandwich layer. Seal the plate with 3 layers of elastic sealing foil. Wrap the bottom half of the plates with aluminum foil, to cover the roots from light exposure.
- Incubate the plates in a climatized growth room (28 °C, 16 h:8 h day:night) for 3-4 weeks. Mark the position of the root tips to follow the root growth over time.
- If the EKM plates start to dry out due to prolonged incubation, transfer the plants to fresh EKM plates a few days ahead of bacterial inoculation.
- Prepare the bacterial inoculum as described at step 6.1.
- Remove the top cellophane membrane and apply 1 mL of rhizobium culture (OD600 = 0.025) to the roots. Subsequently, place a new cellophane membrane on the inoculated roots. Wrap the outside of the plate using aluminum foil to cover the roots from light exposure.
- After 4 weeks, examine nodule numbers using a binocular to determine the nodulation efficiency.
8. Nodulation of P. andersonii Seedlings in Pouches
- Germinate P. andersonii seeds as described in section 1.1. After the cotyledons have fully emerged (~12 days on SH-0 plates at 28 °C), transfer the seedlings to pouches.
- To prepare the pouches, tear the folded section of the paper wick and add 7 mL of modified EKM medium (see Table 3, Table 4).
- Insert 1 or 2 seedlings by placing the roots in between both sheets of paper that form the paper wick and the front plastic sheet of the pouch.
- Shield the roots from light exposure, by folding aluminum foil around the pouch. Suspend the pouches in a plastic box covered with a translucent lid to maintain high humidity. Place the box in a climatized growth room (28 °C, 16 h:8 h day:night).
- Compensate for water evaporation by adding sterile ultra-pure water, as such that the paper wick remains humid (avoid standing water at the bottom of the pouch). After the first week, this generally requires adding 2-3 ml every 4 days.
- Prepare the bacterial inoculum as described at step 6.1.
- After seedlings have been grown for 10-12 days in pouches, inoculate the root system with 500 µL of rhizobium culture (OD600 = 0.025).
- Follow the nodule formation through time. Four weeks post inoculation, nodules can be counted and harvested to determine nodulation efficiency.
9. Nodule Cytoarchitecture Analysis
- Collect 10-15 nodules in a 2 mL tube containing fixative (5% glutaraldehyde in 0.1 M phosphate buffer, pH 7.2). Apply vacuum for ½-1 h and incubate overnight at 4 °C. During this period, the samples sink to the bottom of the tube.
NOTE: The fixative solution can be stored at 4 °C for ~2-4 weeks prior usage. Make sure to wear gloves when working with tissue fixative. - Wash the nodules 2x with 0.1 M phosphate buffer, pH 7.2. Apply 10 min intervals between each washing step.
- Dehydrate the samples by subsequently incubating in 30%, 50%, 70%, and 100% ethanol. To ensure that all water is removed from the samples, repeat the 100% ethanol step 3x. Apply 10 min intervals between each dehydration step.
- Prepare polymerization mixture I (PM-I) by adding 1 pack of Hardener I to 2.5 mL of PEG400 mixed with 100 mL of HEMA (2-hydroxyethyl methacrylate)-based resin solution. Stir the solution for ~15 min to completely dissolve the Hardener I. Subsequently, store PM-I at -20 °C.
- Remove the ethanol from step 9.3. and infiltrate the samples in the following order: PM-I:100% ethanol (1:3, v/v), PM-I:100% ethanol (1:1, v/v), and PM-I:100% ethanol (3:1, v/v). Incubate the samples in each solution at RT for ½-1 h or until the samples sink to the bottom.
- Incubate samples overnight at 4 °C in 100% PM-I solution.
- Prepare polymerization mixture II by mixing PM-I and Hardener II in a 15:1 (v/v) ratio. Fill the plastic mold with the polymerization solution, orient the samples horizontally at the bottom of the mold, and cover with a piece of elastic sealing foil. Avoid the formation of air bubbles.
NOTE: As the solution starts to polymerize upon exposure to RT, try to orient the samples as quickly as possible in the plastic holder. Polymerization is completed after overnight incubation at RT, or 1 h at 37 °C. - Remove the elastic sealing foil cover from step 9.7 and place a holder to the polymerized samples. To mount the holder to the samples, dissolve 10 mL of methyl methacrylate-based resin powder in 5 mL of methyl methacrylate-based resin solution. Quickly add the solution to the hole in the top of the holder.
NOTE: Perform the polymerization step in the fume hood (~30 min at RT). - Microtome section samples to a thickness of 4-5 µm. Place a microscope slide on a 58 °C hot plate and add a large drop of water to each slide. Place the sections on the top of the water. Once the water has evaporated, the sections will adhere to the slide.
- Stain slides by immersing in 0.05 % (w/v) toluidine blue for 2 min. Subsequently, rinse slides 3x with ultra-pure water. Slides can be observed using a bright-field microscope.
10. Mycorrhization of P. andersonii Plantlets
- Prepare Rhizophagus irregularis spores’ inoculum
- Prepare a stack of polyester woven filters with the following sizes (top to bottom): 210 µm, 120 µm, and 36 µm mesh size.
- Pipette the required amount of a commercial spore suspension onto the stack of polyester filters. Rinse the filters 3x with 100 mL of autoclaved demineralized water. The spores are retained on the surface of the 36 µm filter.
NOTE: Prepare the spore suspension in the laminar crossflow cabinet to prevent contamination. - Disassemble the polyester stack and keep the 36 µm filter only. Repeat the washing step with autoclaved demineralized water for at least 6x.
- Place the filter on a Petri dish and re-suspend the spores in autoclaved demineralized water. Use a volume of water equal to the volume of the spore suspension used in step 10.1.2. Transfer the spore suspension to a sterile tube by pipetting.
- Place 5 drops of 20 µL of the spore suspension on a glass slide and count the number of spores using a bright-field microscope. Convert spore counts into a ratio of spores/mL and dilute the spore suspension until it reaches 250 spores/mL. Store the spore suspension at 4 °C.
- Perform mycorrhization assay. To this end, add 800 g of autoclaved sand supplemented with 70 mL of ½-Hoagland medium to sterile translucent polypropylene pots (see Tables 5-6). Mix sand and medium directly in the pot by shaking vigorously.
- Place one P. andersonii plantlet in each pot, and pipette 1 mL of the spore suspension directly onto the root of the P. andersonii plantlet. Ensure to include several pots containing P. andersonii plantlets transformed with a CRISPR-control construct (see Supplementary Table 1).
- Incubate pots in a climatized growth room (28 °C, 16 h:8 h day:night) for 6 weeks.
- Take out the plants from the pots and wash the roots with running water to remove as much sand as possible.
- Cut roots in 1 cm long pieces and boil the root pieces in 10% KOH (w/v) for 20 min at 90 °C. Subsequently, place the boiled roots on a cell strainer with a 100 µm mesh size and rinse 3x with 50 mL of water.
- Stain roots with 0.05% (w/v) trypan blue in lactoglycerol (300 mL of lactic acid; 300 mL of glycerol; and 400 mL of demineralized water) for 5 min at 90 °C in a water bath or heating block. Subsequently, transfer roots to 30% glycerol. The root samples can be stored at RT.
- Place 15-25 root fragments on a single microscope slide. Add 30% glycerol and cover with a cover glass and press until root pieces become flat. Observe the root fragments using a bright-field microscope and score the mycorrhizal colonization.
NOTE: A method to score mycorrhization is described according to Trouvelot et al.29. This method uses several classes (%F, %M, and %A), which allows rapid estimation of the level of mycorrhizal colonization of each root fragment and abundance of arbuscules.
Results
P. andersonii trees can be grown in a conditioned greenhouse at 28 °C and ~85% relative humidity (Figure 1A). Under these conditions, trees start flowering at 6-9 months after planting. Female P. andersonii flowers produce berries that each contains a single seed. During maturation, the berries change color; first from green to white and subsequently from white to brown (Figure 1B). Seeds extracted from the ripened brown berries, germinate well after a 10-day temperature cycle and a 7-day incubation on SH-0 plates (Figure 1C). Germinated seeds continue to develop into young seedlings that can be used for experimentation after ~4 weeks (Figure 1D).
We have previously shown that petioles and segments of young P. andersonii stems can be efficiently transformed using A. tumefaciens strain AGL110. At the start of the transformation procedure, the tissue explants are co-cultivated with A. tumefaciens for 2 days at 21 °C (Figure 2A). Prolonged co-cultivation results in the over-colonization of the tissue explants by A. tumefaciens and should, therefore, be prevented (Figure 2B). After the co-cultivation period, tissue explants are transferred to selective media, which promotes outgrowth of transformed tissue. Two to three weeks later, small green micro-calli are generally observed along the original wound surface (Figure 2C). These calli should continue to grow and develop 1 or more putatively-transformed shoots at 6-8 weeks after the transformation procedure has been initiated (Figure 2D). At this stage, transformation efficiencies typically range from ~10-30% for transformations initiated with tissue explants taken from mature and partly woody branches (Table 7). If transformations are initiated with explants taken from the young and rapidly-growing tips of branches that are not yet bearing flowers, transformation efficiencies of ~65-75% can be achieved (Table 7). Occasionally, whitish calli are formed on the side of an explant that is not in contact with the medium and, therefore, do not experience kanamycin selection. These calli are often not transgenic and any shoots formed from these calli will generally bleach and die after direct contact with kanamycin-containing medium (Figure 2E). In case the transformation rate is low and/or the starting material was suboptimal, tissue pieces might turn brown (Figure 2F) and suffer from over-proliferation by A. tumefaciens (Figure 2G). To prevent A. tumefaciens from spreading and overgrowing nearby explants, regular refreshment of the medium is required, and severely infected explants need to be removed. Once individual transgenic shoots are placed in the propagation medium, over-proliferation by A. tumefaciens is generally not occurring anymore (Figure 2H). Transgenic shoots can be multiplied through in vitro propagation, which will give rise to tens of shoots in a period of one month (Figure 3A-B). These shoots can be placed on rooting medium, which should induce root formation after ~2 weeks (Figure 3C-D). Rooted plantlets can be subsequently used for experimentation.
To create knockout mutant lines, we make use of CRISPR/Cas9-mediated mutagenesis. To this end, we make use of a binary vector containing the kanamycin resistance gene NPTII, a Cas9-encoding sequence driven by the CaMV35S promoter and 2 sgRNAs per target gene that are expressed from the AtU6p small RNA promoter20. A graphical representation of the construct used for CRISPR/Cas9-mediated mutagenesis of P. andersonii is provided in Figure 4A. Using this method, genome editing is observed in ~40% of putatively-transformed shoots10. To identify mutant lines, putatively-transformed shoots are genotyped for mutations at the sgRNA target site(s) using primers spanning the targeted region. An example of the expected results is given in Figure 4. As can be seen from the photo taken after gel electrophoresis, several samples produce a PCR amplicon with similar size to the wild type (Figure 4B). These plants may contain small indels that cannot be visualized by agarose gel electrophoresis or remain unedited by the Cas9 enzyme. Additionally, several samples yield bands that are different in size from the wild type (e.g., lines 2, 4, 7 and 8 in Figure 4B). In these lines, 1 (lines 4, 7 and 8) or both (line 2) alleles contain larger indels that can be easily visualized. The exact nature of the mutations at the target site(s) is revealed after PCR amplicon sequencing. As can be seen from Figure 4C, both small indels of 1-4 bp, as well as, larger deletions can be obtained after CRISPR/Cas9 mutagenesis. In Figure 4C, the sequence of line 1 is identical to that of the wild type, indicating that this line escaped editing and, therefore, should be discarded. Among the lines that contain mutations, heterozygous, homozygous and bi-allelic mutants can be identified (Figure 4C). However, heterozygous mutants are generally rare10. Homozygous or bi-allelic knockout mutants can be propagated vegetatively to obtain sufficient material for phenotypic analysis. As phenotypic analysis is performed in the T0 generation, it is important to check whether mutant lines might be chimeric. To this end, genotyping needs to be repeated on at least 3 different samples taken from each mutant line. If the genotyping results are identical to each other and the original genotyping sample (e.g., line 8 in Figure 4D), the line is homogeneously mutated and can be used for further analysis. However, if the genotyping results differ between independent samples (e.g., line 4 in Figure 4D), the mutant line is chimeric and needs to be discarded.
Inoculation of P. andersonii with M. plurifarium BOR2 results in the formation of root nodules (Figure 5). As can be seen in Figure 5A, these nodules are distributed along the root system. Nodules of P. andersonii are light brown in color but can be easily discriminated from the root tissue based on their shape (Figure 5B). Inoculation experiments in pots and subsequent growth for 4-6 weeks typically result in the formation of ~10-30 nodules (Figure 6A). A similar number of nodules is formed after inoculation of EKM plate-grown P. andersonii plantlets at 4 weeks after inoculation (Figure 6A). In pouches, P. andersonii seedlings typically form ~5-15 nodules at 5 weeks post inoculation (Figure 5C-D, 6A). To analyze the nodule cytoarchitecture, nodules can be sectioned and observed using bright-field microscopy. Figure 6B shows an example of a longitudinal section through the middle of a P. andersonii nodule. This section shows the central vascular bundle of a P. andersonii nodule, which is flanked by nodule lobes containing infected cells (Figure 6B).
P. andersonii plantlets can also be mycorrhized. After 6 weeks of inoculation with R. irregularis, mycorrhizal colonization frequency typically reaches > 80% (Figure 6C). At this time point, generally ~30% of the cells contain arbuscules (Figure 6C). A representative image of a P. andersonii root segment containing arbuscles is shown in Figure 6D.
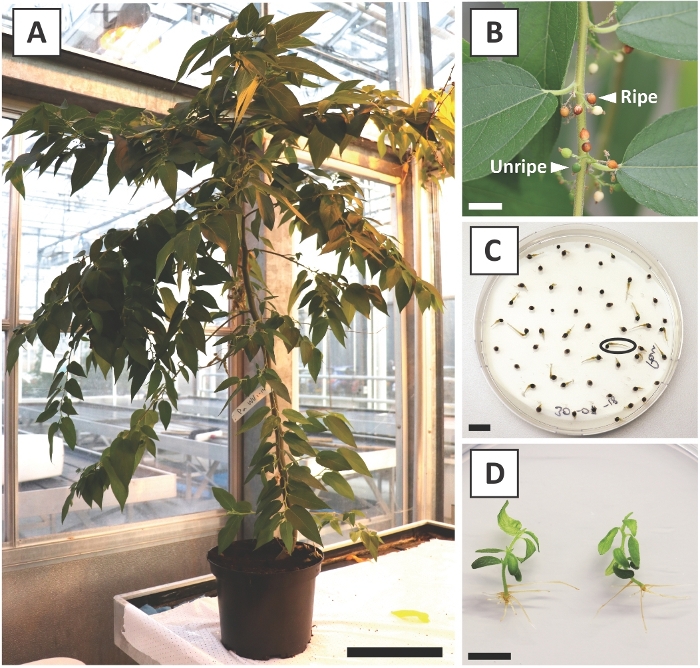
Figure 1: Representative images of a P. andersonii tree, seeds and seedlings. (A) Six-month old P. andersonii tree grown in potting soil in a greenhouse conditioned at 28 °C. (B) Representative image depicting P. andersonii berries at various stages of maturation. Young P. andersonii berries (unripe) will change color from green to white and finally to brown (ripe) upon ripening. (C) P. andersonii seeds incubated on SH-0 medium for 1 week. A black circle indicates a germinated seedling. (D) Four-week old P. andersonii seedlings grown in SH-0 medium. Scale bars are equal to 25 cm in (A) and 1 cm in (B-D). Please click here to view a larger version of this figure.
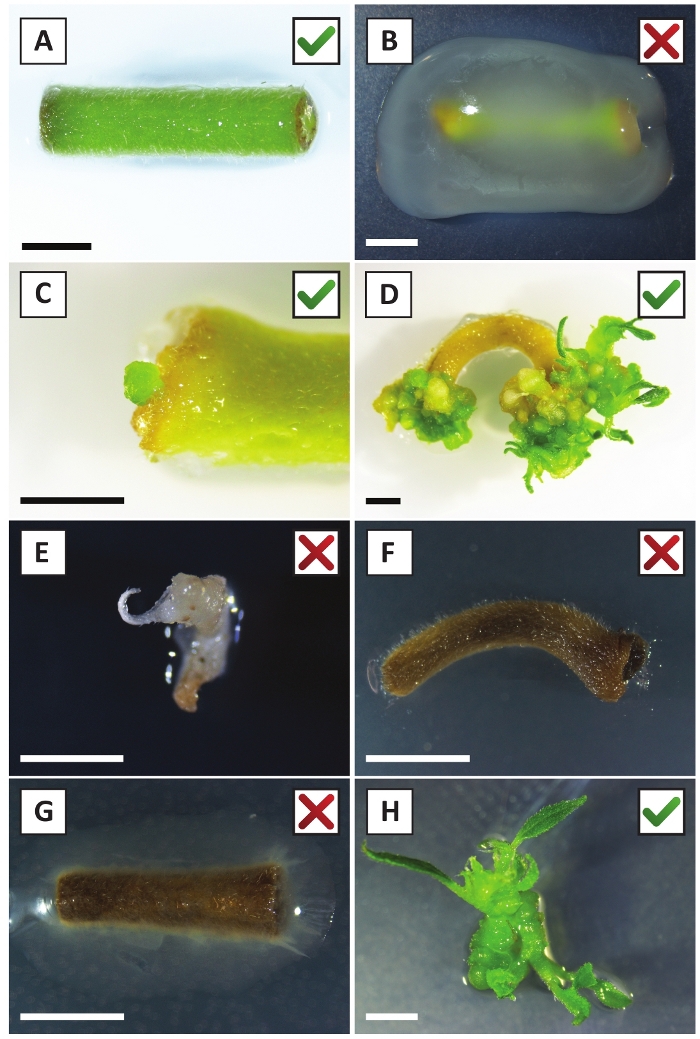
Figure 2: Representative images of explants at different stages of the stable transformation procedure. (A) Explant co-cultivated with A. tumefaciens. (B) Explant overgrown by A. tumefaciens during the first 2 weeks post transformation. (C) Transgenic micro-callus formed near the wound site of an explant at 2.5 weeks post co-cultivation. (D) Representative image of an explant at 6 weeks post co-cultivation showing the emergence of shoots from (transgenic) calli. (E) Representative image of a shoot that becomes whitish and eventually dies when in direct contact with kanamycin-containing medium. This shoot is most likely non-transgenic and escaped kanamycin selection when attached to the explant. (F) Representative image of an unsuccessfully transformed explant. (G) Representative image of an unsuccessfully transformed explant overgrown by A. tumefaciens. (H) Single transgenic shoot grown on propagation medium at 8 weeks post co-cultivation with A. tumefaciens. Scale bars equal 2.5 mm. Boxes containing green check marks or red crosses indicate successful or unsuccessful transformation of explants, respectively. Please click here to view a larger version of this figure.

Figure 3: Representative images of in vitro propagation. (A) Shoots grown on propagation medium. The image was taken 1 week after plates were refreshed. (B) Shoots grown on propagation medium. The image was taken 4 weeks after plates were refreshed. (C) Freshly cut shoots placed on rooting medium. (D) Shoots incubated on rooting medium for 2 weeks. Note the presence of roots. Scale bars are equal to 2.5 cm. Please click here to view a larger version of this figure.
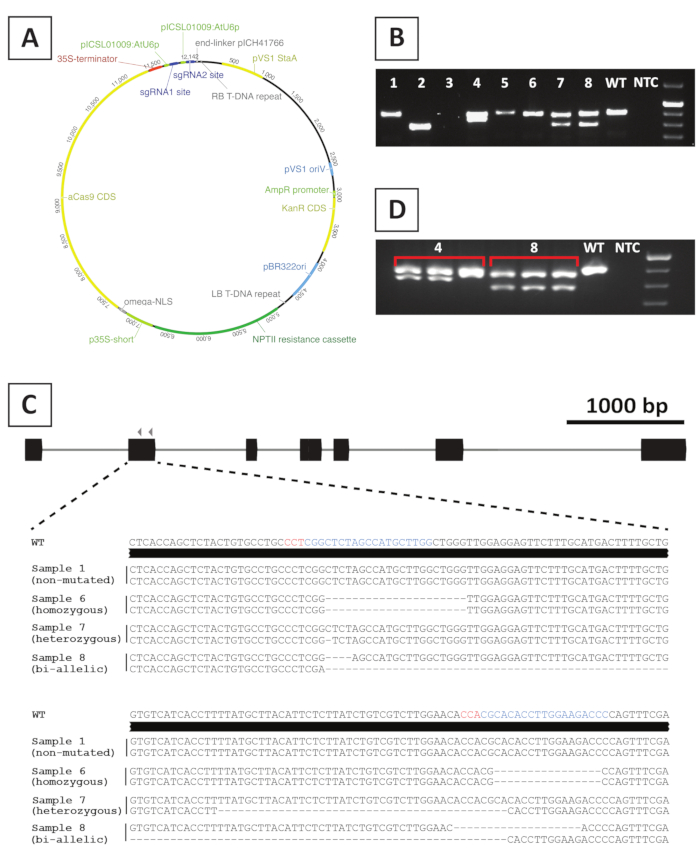
Figure 4: Representative results after genotyping of P. andersonii T0 transgenic CRISPR/Cas9 mutant lines. (A) Representative map of a binary vector used for CRISPR/Cas9-mediated mutagenesis of P. andersonii. (B) Representative result after PCR-based genotyping of potential CRISPR/Cas9 mutant lines using primers spanning the sgRNA target site(s). Shown is an image after agarose gel electrophoresis of amplicons. Samples taken from individual transgenic lines are indicated by numbers. Wild type (WT) and no template control (NTC) indicate lanes containing positive and negative controls, respectively. (C) Schematic representation of mutant alleles obtained after CRISPR/Cas9-mediated gene editing. Highlighted in blue and red colors are the sgRNA target sites and PAM sequences, respectively. (D) Representative result after PCR-based screening for potential chimeric mutant lines. Shown is an image after agarose gel electrophoresis of 3 individual samples taken from mutant lines 4 and 8. Note that transgenic mutant line 4 is chimeric. Please click here to view a larger version of this figure.

Figure 5: Representative images of nodulation assays in plates and pouches. (A) Nodulation on plates containing agar-solidified EKM medium and inoculated with M. plurifarium BOR2 for 4 weeks. (B) Representative image of a P. andersonii root nodule. The image was taken at 4 weeks post inoculation with M. plurifarium BOR2. (C) Nodulation in pouches containing liquid EKM medium. Seedlings were inoculated with Bradyrhizobium sp. Kelud2A4 for 5 weeks. (D) Representative image of a complete setup used for the nodulation in pouches. Scale bars are equal to 2.5 cm in (A,C), 1 mm in (B), and 5 cm in (D). Please click here to view a larger version of this figure.
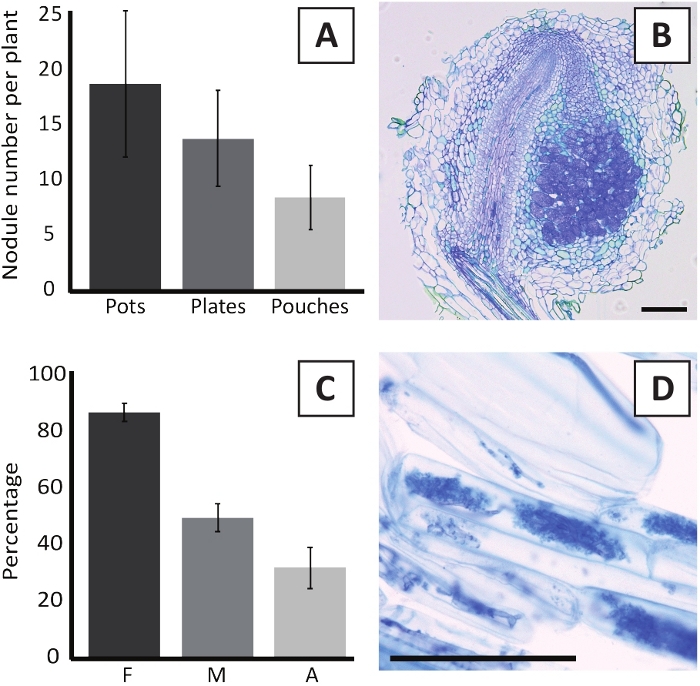
Figure 6: Representative results of the nodulation and mycorrhization assays. (A) Representative bar graph showing the number of nodules formed per plant at 4 weeks post inoculation with M. plurifarium BOR2 in pots or on plates and at 5 weeks post inoculation with Bradyrhizobium sp. Kelud2A4 in pouches. Data represent mean ± SD (n = 10). (B) Representative image of a longitudinal section through a nodule formed at 4 weeks post inoculation with M. plurifarium BOR2. The section is stained with toluidine blue. (C) Representative bar graph showing quantification of mycorrhization. Variables quantified according to Trouvelot et al.29 are F, the frequency of analyzed root fragments that are mycorrhized; M, the intensity of infection; A, the abundance of mature arbuscules in the total root system. Mycorrhization was quantified at 6 weeks post inoculation with R. irregularis (strain DAOM197198). Data represent mean ± SD (n = 10). (D) Representative image of mature arbuscules present in P. andersonii root cortical cells at 6 weeks post inoculation with R. irregularis. Scale bars equal 75 µm. Please click here to view a larger version of this figure.
| Compound | SH-0 | SH-10 | Propagation medium | Rooting medium | Infiltration medium |
| SH-basal salt medium | 3.2 g | 3.2 g | 3.2 g | 3.2 g | 3.2 g |
| SH-vitamin mixture | 1 g | 1 g | 1 g | 1 g | 1 g |
| Sucrose | - | 10 g | 20 g | 10 g | 10 g |
| BAP (1 mg/mL) | - | - | 1 mL (4.44 µM) | - | - |
| IBA (1 mg/mL) | - | - | 100 µL (0.49 µM) | 1 mL (4.92 µM) | - |
| NAA (1 mg/mL) | - | - | - | 100 µL (0.54 µM) | - |
| 1 M MES pH=5.8 | 3 mL | 3 mL | 3 mL | 3 mL | 3 mL |
| 1 M KOH | Adjust pH to 5.8 | Adjust pH to 5.8 | Adjust pH to 5.8 | Adjust pH to 5.8 | Adjust pH to 5.8 |
| Daishin agar | 8 g | - | 8 g | 8 g | - |
Table 1: Composition of Schenk-Hildebrandt-based30 media used for growing P. andersonii seedlings, stable transformation, and in vitro propagation. Dissolve solid compounds into 750 mL of ultra-pure water before adding liquid stocks. Afterwards, fill the complete medium to 1 L. Prepare BAP, IBA, NAA stocks in 0.1 M KOH and store at -20 ᵒC.
| Before autoclaving: | ||
| Compound | Amount per liter | Final concentration |
| Mannitol | 5 g | 27.45 mM |
| Na-Gluconate | 5 g | 22.92 mM |
| Yeast extract | 0.5 g | - |
| MgSO4·7H2O | 0.2 g | 0.81 mM |
| NaCl | 0.1 g | 1.71 mM |
| K2HPO4 | 0.5 g | 2.87 mM |
| After autoclaving: | ||
| Compound | Amount per liter | Final concentration |
| 1.5 M CaCl2 | 1 mL | 1.5 mM |
Table 2: Composition of Yeast-Mannitol (YEM) medium used for growing rhizobium. Adjust the pH to 7.0 and fill with ultra-pure water to 1 L. To prepare the agar-solidified YEM medium, add 15 g of microagar before autoclaving.
| Before autoclaving: | |||
| Compound | Stock concentration | Amount per liter medium | Final concentration |
| KH2PO4 | 0.44 M | Add 2 mL | 0.88 mM |
| K2HPO4 | 1.03 M | Add 2 mL | 2.07 mM |
| 500x micro-elements stock solution | - | Add 2 mL | - |
| MES pH=6.6 | 1 M | Add 3 mL | 3 mM |
| HCl | 1 M | Adjust pH to 6.6 | - |
| Ultra-pure water | - | Fill to 990 mL | - |
| After autoclaving: | |||
| Compound | Stock concentration | Amount per liter medium | Final concentration |
| MgSO4·7H2O | 1.04 M | 2 mL | 2.08 mM |
| Na2SO4 | 0.35 M | 2 mL | 0.70 mM |
| NH4NO3 | 0.18 M | 2 mL | 0.36 mM |
| CaCl2·2H2O | 0.75 M | 2 mL | 1.5 mM |
| Fe(III)-citrate | 27 mM | 2 mL | 54 μM |
Table 3: Composition of 1 L modified EKM medium31 used for P. andersonii nodulation assay. The composition of the 500x micro-elements stock solution is listed in Table 4. To prepare 2% agar-solidified EKM medium, add 20 g of Daishin agar before autoclaving. Autoclave the MgSO4·7H2O, Na2SO4, CaCl2·2H2O, and Fe(III)-citrate stocks to sterilize. Filter sterilize NH4NO3 stock solution to sterilize.
| Compound | Amount per liter | Stock concentration |
| MnSO4 | 500 mg | 3.31 mM |
| ZnSO4·7H2O | 125 mg | 0.43 mM |
| CuSO4·5H2O | 125 mg | 0.83 mM |
| H3BO3 | 125 mg | 2.02 mM |
| Na2MoO4·2H2O | 50 mg | 0.21 mM |
Table 4: Composition of the 500x micro-elements stock solution used for preparing modified EKM medium. Store the micro-elements stock solution at 4 °C.
| Compounds | Stock concentration | Amount per liter medium | Final concentration |
| K2HPO4 | 20 mM | 1 mL | 0.2 mM |
| NH4NO3 | 0.28 M | 10 mL | 2.8 mM |
| MgSO4 | 40 mM | 10 mL | 0.4 mM |
| K2SO4 | 40 mM | 10 mL | 0.4 mM |
| Fe(II)-EDTA | 9 mM | 10 mL | 0.9 mM |
| CaCl2 | 80 mM | 10 mL | 0.8 mM |
| 50x micro-elements stock solution | - | 10 mL | - |
Table 5: Composition of ½-Hoagland32 medium used for mycorrhization assays. The composition of the 50x micro-elements stock solution is listed in Table 6. Prepare the Fe(II)-EDTA solution by combining FeSO4·7H2O (9 mM) and Na2·EDTA (9 mM) into 1 stock solution, and store at 4 °C. Adjust the pH of the medium to 6.1 using 1 M KOH and fill with ultra-pure water to 1 L.
| Compounds | Amount per liter | Stock concentration |
| H3BO3 | 71.1 mg | 1.15 mM |
| MnCl2·4H2O | 44.5 mg | 0.22 mM |
| CuSO4·5H2O | 3.7 mg | 23.18 µM |
| ZnCl2 | 10.2 mg | 74.84 µM |
| Na2MoO4·2H2O | 1.2 mg | 4.96 µM |
Table 6: Composition of the 50x micro-elements stock solution used for preparing ½-Hoagland medium.
| Age of explants | Transformation efficiency |
| Young | 69.4 ± 6.2% (n = 2) |
| Mature | 18.3 ± 10.2% (n = 15) |
Table 7: Transformation efficiency of P. andersonii. Here, transformation efficiency is defined as the percentage of explants that form at least 1 transgenic callus or shoot. Transformation efficiency was scored at 6 weeks post transformation and is depicted as mean ± SD. n indicates the number of transformation experiments from which the transformation efficiency was determined.
Supplemental File 1: Overview of level 1 and level 2 constructs used for CRISPR/Cas9 mutagenesis. Please click here to download this file.
Discussion
Legumes and the distantly-related Cannabaceae genus Parasponia represent the only two clades of plant species able to establish an endosymbiotic relationship with nitrogen-fixing rhizobia and form root nodules. Comparative studies between species of both clades are highly relevant to provide insights into the core genetic networks allowing this symbiosis. Currently, genetic studies are mainly done in legumes; especially the two model species M. truncatula and L. japonicus. To provide an additional experimental platform and facilitate comparative studies with a nodulating non-legume, we describe here a detailed protocol for stable transformation and reverse genetic analyses in P. andersonii. The presented protocol uses in vitro propagation of T0 transgenic P. andersonii lines, allowing phenotypic analysis to be initiated within 4 months after A. tumefaciens co-cultivation. This is substantially faster than current protocols that have been established for stable transformation of legumes33. This makes P. andersonii an attractive research model.
The protocol described here contains several critical steps. The first of which concerns seed germination. To prepare P. andersonii seeds for germination, seeds need to be isolated from the berries. This is done by rubbing the berries on a piece of tissue paper or against the inside of a tea sieve. This procedure needs to be performed gently in order to prevent damage to the seed coat. If the seed coat gets damaged, bleach could enter the seed during sterilization, which reduces seed viability. To break seed dormancy, seeds are subjected to a 10-day temperature cycle. However, despite this treatment, germination is not entirely synchronized. Generally, the first seeds show radicle emergence after 7 days, but others might take several days longer to germinate.
Critical points in the transformation procedure concern the choice of the starting material and the duration of the co-cultivation step. To reach efficient transformation, it is best to use healthy and young stems or petioles of non-sterile greenhouse-grown plants as the starting material. In order to induce the growth of young branches, it is advisable to trim Parasponia trees every 2-3 months and refresh trees once a year. Additionally, the co-cultivation step needs to be performed for 2 days only. Prolonged co-cultivation promotes over-colonization of tissue explants by A. tumefaciens and generally reduces transformation efficiency. To prevent over-colonization by A. tumefaciens it is also important to regularly refresh the plates on which the explants are cultivated. In case over-colonization does occur, tissue explants could be washed (see Section 3.8) to remove A. tumefaciens cells. We advise adding bleach to the SH-10 solution used for washing (final concentration: ~2% hypochlorite). It is important to note that this additional washing step might not work on heavily-infected explants (Figure 2B). In case a transformation with a CRISPR/Cas9 construct yields only a limited number of putatively-transformed shoots or if mutagenesis of a particular gene is expected to cause problems in regeneration, it is advisable to include an empty vector control construct as the positive control. Lastly, it is important to ensure that all transgenic lines that are selected are resulting from independent T-DNA integration events. Therefore, we instruct to take only a single putatively-transgenic shoot from each side of an explant. However, we realize that this reduces the potential number of independent lines. If many lines are required, researchers could decide to separate putatively-transformed calli from the original explants when these calli are ≥2 mm in size and culture these calli independently. In this way, multiple lines could be isolated from each explant, which raises the number of potential transgenic lines.
In the current protocol, transgenic lines of P. andersonii are propagated vegetatively through in vitro propagation. The advantage of this is that many transgenic plantlets can be generated in a relatively short time period. However, this method also has several limitations. Firstly, the maintenance of T0 transgenic lines through in vitro propagation is labor intensive and could result in unwanted genetic or epigenetic alterations34,35. Secondly, T0 lines still contain a copy of the T-DNA, including the antibiotic resistance cassette. This limits the number of possible re-transformations, as different selection markers are required for each re-transformation. Currently, we have only tested transformation using kanamycin or hygromycin selection (data not shown). Furthermore, the presence of the Cas9-encoding sequence and sgRNAs in the T0 transgenic lines complicates complementation studies. Complementation assays are possible but require the sgRNA target site(s) to be mutated as such that gene-editing of the complementation construct is prevented. Thirdly, a disadvantage of working with T0 lines is that CRISPR/Cas9 mutants might be chimeric. To prevent phenotypic analysis of chimeric mutant lines, we recommend repeating the genotyping analysis after in vitro propagation on at least 3 different shoots. Although, the number of chimeric mutants obtained using the protocol described here is limited, they are occasionally observed10. To overcome the limitations of working with T0 lines, P. andersonii mutant lines could be propagated generatively. P. andersonii trees are dioecious and wind-pollinated2. This means that each transgenic line needs to be manipulated as such that male and female flowers are produced on a single individual, and subsequently grown as such that cross pollination does not occur. As P. andersonii is a fast-growing tree it requires a substantial amount of space in a tropical greenhouse (28 °C, ~85% relative humidity). Therefore, although technically possible, generative propagation of P. andersonii transgenic lines is logistically challenging.
In the protocol section, we described 3 methods for nodulation of P. andersonii. The advantage of the plate and pouch systems is that the roots are easily accessible, which may allow spot-inoculation of bacteria and following nodule formation over time. However, the plate system is quite labor intensive, which makes it less suited for large-scale nodulation experiments. A disadvantage of the pouch system is that it is difficult to prevent fungal contamination. Pouches are not sterile, and therefore fungal growth is often observed on the top half of the pouch. However, this does not affect P. andersonii growth, and therefore does not interfere with nodulation assays. Additionally, the pouch system is only suitable for seedlings. Despite several attempts, we have been unable to grow plantlets obtained through in vitro propagation in pouches.
The P. andersonii reverse genetics pipeline described here offers a substantial improvement compared to the existing A. rhizogenes-based root transformation method11. Using the described procedures, stable transgenic lines can be generated efficiently and can be maintained via in vitro propagation. In contrast, A. rhizogenes transformation is transient and only results in the formation of transgenic roots. Because each transgenic root results from an independent transformation, A. rhizogenes transformation-based assays suffer from substantial phenotypic variation. This variation is much less in case of stable lines, although in vitro propagation also creates some level of variation. Because of this reduced variation and the fact that multiple plantlets could be phenotyped for each stable line, stable lines are more suited for quantitative assays compared to A. rhizogenes-transformed roots. Additionally, the stable transformation does not depend on the introduction of the A. rhizogenes root inducing locus (rol) that affects the endogenous hormone balance15. Therefore, stable lines are better suited for reverse genetic analysis of genes involved in hormone homeostasis compared to A. rhizogenes-transformed roots. A more general advantage of P. andersonii as research model is that it did not experience a recent whole genome duplication (WGD). The legume Papilionoideae subfamily, which includes the model legumes M. truncatula and L. japonicus, as well as the Salicaceae (order Malpighiales) that includes the model tree Populus trichocarpa experienced WGDs ~65 million years ago36,37. Many paralogous gene copies resulting from these WGDs are retained in the genomes of M. truncatula, L. japonicus and P. trichocarpa37,38,39, which creates redundancy that might complicate reverse genetic analyses. As P. andersonii did not experience a recent WGD, reverse genetic analyses on P. andersonii might be less affected by redundant functioning of paralogous gene copies.
Taken together, we provide a detailed protocol for reverse genetic analysis in P. andersonii. Using this protocol, single mutant lines can be efficiently generated in a timeframe of 2-3 months10. This protocol can be extended to create higher order mutants through multiplexing of sgRNAs targeting different genes simultaneously, as shown for other plant species40,41,42. Additionally, the stable transformation procedure described here is not limited to CRISPR/Cas9 gene-targeting but could also be used to introduce other types of constructs (e.g., for promoter-reporter assays, ectopic expression or trans-complementation). We established P. andersonii as a comparative research model to study mutualistic symbioses with nitrogen-fixing rhizobia or endomycorrhizal fungi. However, the protocols described here also provide tools to study other aspects of the biology of this tropical tree, such as wood formation, the development of bi-sexual flowers or the biosynthesis of Cannabaceae-specific secondary metabolites.
Disclosures
The authors have nothing to disclose.
Acknowledgements
The authors like to acknowledge Mark Youles, Sophien Kamoun and Sylvestre Marillonnet for making Golden Gate cloning parts available through the Addgene database. Additionally, we would like to thank E. James, P. Hadobas, and T. J. Higgens for P. andersonii seeds. This work was supported by The Netherlands Organization for Scientific Research (NWO-VICI grant 865.13.001; NWO-Open Competition grant 819.01.007) and The Ministry of Research, Technology and Higher Education of the Republic of Indonesia (RISET-PRO grant 8245-ID).
Materials
| Name | Company | Catalog Number | Comments |
|---|---|---|---|
| Sigma-Aldrich | N0640 | NAA | |
| Duchefa Biochemie | M1503.0250 | MES | |
| Sigma-Aldrich | D134406 | Acetosyringone | |
| Duchefa Biochemie | X1402.1000 | X-Gal | |
| Merck | 101236 | For nucleic acid electrophoresis gel | |
| - | - | Pouches box material, hangers | |
| Merck | 101188 | NH4NO3 | |
| Sigma-Aldrich | B3408-1G | BAP | |
| Merck | 100156 | H3BO3 | |
| Thermo-Fisher | ER1011 | Used as restriction enzyme in Golden Gate cloning assembly | |
| Thermo-Fisher | 15561020 | Used in Golden Gate cloning assembly | |
| Merck | 137101 | CaCl2·2H2O | |
| Duchefa Biochemie | C0111.0025 | C16H16N5O7S2Na | |
| Thermo-Fisher | K1231 | Used for cloning the blunt-ended PCR amplicons in genotyping procedure | |
| Agronutrition | AP2011 | Containing Rhizophagus irregularis DAOM 197198 (1,000 spores/mL), used for mychorrization assay | |
| Merck | 102790 | CuSO4·5H2O | |
| Duchefa Biochemie | D1004.1000 | Used for plant tissue culture agar-based medium | |
| Merck | 105101 | K2HPO4 | |
| VWR Chemicals | 20302.293 | Na2·EDTA | |
| Duchefa Biochemie | M0803.1000 | C6H14O6 | |
| Thermo-Fisher | ER0291 | Used as restriction enzyme in Golden Gate cloning assembly | |
| Merck | 100983 | C2H5OH | |
| VWR Chemicals | BDH9232-500G | EDTA | |
| Sigma-Aldrich | Z377600-1PAK | Cellophane membrane | |
| Biomatters, Ltd. | R9 or higher | Bioinformatics software for in silico cloning and designing of sgRNAs | |
| Mega International | - | Technical information at https://mega-international.com/tech-info/ | |
| Sigma-Aldrich | 65882 | Used for fixating nodule tissues | |
| VWR Chemicals | 24385.295 | - | |
| Vink | 219341 | Pouches box material, bottom part | |
| Leica Biosystems | 14702218311 | Used as a template for plastic embedding | |
| Merck | 100317 | HCl | |
| Sigma-Aldrich | I5386-1G | IBA | |
| Merck | 103862 | C6H5FeO7 | |
| Merck | 103965 | FeSO4O·7H2O | |
| Duchefa Biochemie | I1401.0005 | IPTG | |
| Duchefa Biochemie | K0126.0010 | ||
| Sigma-Aldrich | L2000 | ||
| Merck | 105886 | MgSO4O·7H2O | |
| Merck | 105934 | MnCl2·4H2O | |
| Merck | 102786 | MnSO4O | |
| Duchefa Biochemie | M1002.1000 | Used for bacterial culture agar-based medium | |
| Manutan | 92007687 | Pouches material | |
| Paraxisdienst | 130774 | Elastic sealing foil | |
| Pull Rhenen | Agra-Perlite No.3 | Used as growing substrate in pots for nodulation assay | |
| VWR Chemicals | 391-0581 | Used as container for cellophane membranes | |
| Thermo-Fisher | F130WH | For genotyping transgenic lines | |
| Addgene | 50337 | Level 0 terminator, 3’UTR, 35s (Cauliflower Mosaic Virus) | |
| Addgene | 48017 | End-link 2 for assembling 2 level one part into a level 2 acceptor | |
| Addgene | 48018 | End-link 3 for assembling 3 level one part into a level 2 acceptor | |
| Addgene | 48001 | Level 1 acceptor. Position 5. Forward orientation | |
| Addgene | 48007 | Level 1 Acceptor. Position 1. Reverse orientation | |
| Addgene | 50268 | Level 0 promoter (0.4 kb), 35s (Cauliflower Mosaic Virus) + 5’UTR, Ω (Tobacco Mosaic Virus) | |
| Addgene | 46966 | Used for designing CRISPR/Cas9 module | |
| Addgene | 46968 | Used for designing CRISPR/Cas9 module | |
| Addgene | 50334 | Level 0 Kanamycin/Neomycin/Paromomycin resistance cassette | |
| Topzeven | - | Used as filters for washing spore suspension | |
| Sigma-Aldrich | 8.17003 | PEG400 | |
| Duchefa Biochemie | E1674.0001 | Pots to grow Parasponia plantlets/seedlings | |
| Merck | 104871 | KH2PO4 | |
| Merck | 105033 | KOH | |
| Merck | 105153 | K2SO4O | |
| Van Leusden b.v. | - | Used as growing substrate for mychorrhization assay | |
| Duchefa Biochemie | S0225.0050 | SH-basal salt medium | |
| Duchefa Biochemie | S0411.0250 | SH-vitamin mixture | |
| Lehle Seeds | VIS-02 | Used as non-ionic surfactant in the washing step of stable transformation | |
| Merck | 137017 | NaCl | |
| VWR Chemicals | 89230-072 | C6H11NaO7 | |
| Merck | 106521 | Na2MoO4·2H2O | |
| Merck | 106574 | Na2HPO4·7H2O | |
| Merck | 567549 | NaH2PO4·H2O | |
| Sigma-Aldrich | 239313 | Na2SO4O | |
| Duchefa Biochemie | S0809.5000 | C12H22O11 | |
| Thermo-Fisher | B69 | Used in Golden Gate cloning assembly | |
| Thermo-Fisher | EL0013 | Used in Golden Gate cloning assembly | |
| Kulzer-Mitsui Chemicals Group | 64708806 | Methyl methacrylate-based resin powder | |
| Kulzer-Mitsui Chemicals Group | 64709003 | HEMA (2-hydroxyethyl methacrylate)-based resin solution | |
| Kulzer-Mitsui Chemicals Group | 66022678 | Methyl methacrylate-based resin solution | |
| Merck | 1159300025 | ||
| Acros | 189350250 | ||
| VWR Chemicals | 663684B | Polysorbate 20 | |
| Stout Perspex | - | pouches box material, lid | |
| Duchefa Biochemie | Y1333.1000 | ||
| Merck | 108816 | ZnCl2 | |
| Alfa Aesar | 33399 | ZnSO4O·7H2O |
References
- Clason, E. W. THE VEGETATION OF THE UPPER-BADAK REGION OF MOUNT KELUT (EAST JAVA). Bulletin du Jardin Botanique de Buitenzorg. Serie III, 509-518 (1936).
- Soepadmo, E. Ulmaceae. Flora Malesiana-Series 1, Spermatophyta. 8, 31-76 (1974).
- Becking, J. H. The Rhizobium symbiosis of the nonlegume Parasponia. Biological Nitrogen Fixation. , 497-559 (1992).
- Oldroyd, G. E. D. Speak, friend, and enter: signalling systems that promote beneficial symbiotic associations in plants. Nature Reviews Microbiology. 11, 252-263 (2013).
- Gutjahr, C., Parniske, M. Cell and developmental biology of arbuscular mycorrhiza symbiosis. Annual Review of Cell and Developmental Biology. 29, 593-617 (2013).
- van Velzen, R., et al. Comparative genomics of the nonlegume Parasponia reveals insights into evolution of nitrogen-fixing rhizobium symbioses. Proceedings of the National Academy of Sciences of the United States of America. 115, E4700-E4709 (2018).
- van Velzen, R., Doyle, J. J., Geurts, R. A Resurrected Scenario: Single Gain and Massive Loss of Nitrogen-Fixing Nodulation. Trends in Plant Science. 24, 49-57 (2019).
- Griesmann, M., et al. Phylogenomics reveals multiple losses of the nitrogen-fixing root nodule symbiosis. Science. 1743, eaat1743(2018).
- Becking, J. H. Root-Nodule Symbiosis Between Rhizobium And Parasponia (Ulmaceae). Plant and Soil. 51, 289-296 (1979).
- van Zeijl, A., et al. CRISPR/Cas9-Mediated Mutagenesis of Four Putative Symbiosis Genes of the Tropical Tree Parasponia andersonii Reveals Novel Phenotypes. Frontiers in Plant Science. 9, 284(2018).
- Cao, Q., et al. Efficiency of Agrobacterium rhizogenes–mediated root transformation of Parasponia and Trema is temperature dependent. Plant Growth Regulation. 68, 459-465 (2012).
- Limpens, E., et al. RNA interference in Agrobacterium rhizogenes-transformed roots of Arabidopsis and Medicago truncatula. Journal of Experimental Botany. 55, 983-992 (2004).
- Boisson-Dernier, A., et al. Agrobacterium rhizogenes-Transformed Roots of Medicago truncatula for the Study of Nitrogen-Fixing and Endomycorrhizal Symbiotic Associations. Molecular Plant-Microbe Interactions. 14, 695-700 (2001).
- Kumagai, H., Kouchi, H. Gene Silencing by Expression of Hairpin RNA in Lotus japonicus Roots and Root Nodules. Molecular Plant-Microbe Interactions. 16, 663-668 (2003).
- Nilsson, O., Olsson, O. Getting to the root: The role of the Agrobacterium rhizogenes rol genes in the formation of hairy roots. Physiologia Plantarum. 100, 463-473 (1997).
- Davey, M. R., et al. Effective Nodulation of Micro-Propagated Shoots of the Non-Legume Parasponia andersonii by Bradyrhizobium. Journal of Experimental Botany. 44, 863-867 (1993).
- Webster, G., Poulton, P. R., Cocking, E. C., Davey, M. R. The nodulation of micro-propagated plants of Parasponia andersonii by tropical legume rhizobia. Journal of Experimental Botany. 46, 1131-1137 (1995).
- Op den Camp, R., et al. LysM-type mycorrhizal receptor recruited for rhizobium symbiosis in nonlegume Parasponia. Science. 331, 909-912 (2011).
- Weber, E., Engler, C., Gruetzner, R., Werner, S., Marillonnet, S. A Modular Cloning System for Standardized Assembly of Multigene Constructs. PLOS ONE. 6, e16765(2011).
- Nekrasov, V., Staskawicz, B. J., Weigel, D., Jones, J. D. G., Kamoun, S. Targeted mutagenesis in the model plant Nicotiana benthamiana using Cas9 RNA-guided endonuclease. Nature Biotechnology. 31, 691-693 (2013).
- Bertani, G. Studies On Lysogenesis. I. The Mode Of Phage Liberation By Lysogenic Escherichia Coli. Journal of Bacteriology. 62, 293-300 (1951).
- Engler, C., et al. A Golden Gate modular cloning toolbox for plants. ACS Synthetic Biology. 3, 839-843 (2014).
- Fauser, F., Schiml, S., Puchta, H. Both CRISPR/Cas-based nucleases and nickases can be used efficiently for genome engineering in Arabidopsis thaliana. The Plant Journal. 79, 348-359 (2014).
- Lazo, G. R., Stein, P. A., Ludwig, R. A. A DNA Transformation-Competent Arabidopsis Genomic Library in Agrobacterium. Biotechnology. 9, 963-967 (1991).
- Op den Camp, R. H. M., et al. N Nonlegume Parasponia andersonii Deploys A Broad Rhizobium Host Range Strategy Resulting in Largely Variable Symbiotic Effectivenes. Molecular Plant-Microbe Interactions. 25, 954-963 (2012).
- Graham, P. H., Viteri, S. E., Mackie, F., Vargas, A. T., Palacios, A. Variation in acid soil tolerance among strains of Rhizobium phaseoli. Field Crops Research. 5, 121-128 (1982).
- Martinez-Romero, E., et al. Rhizobium tropici, A Novel Species Nodulating Phaseolus vulgaris L. Beans and Leucaena sp. Trees. International Journal of Systematic and Evolutionary Microbiology. 41, 417-421 (1991).
- Felten, J., et al. The Ectomycorrhizal Fungus Laccaria bicolor Stimulates Lateral Root Formation in Poplar and Arabidopsis through Auxin Transport and Signaling. Plant Physiology. 151, 1991-2005 (1991).
- Trouvelot, A., Kough, J. L., Gianinazzi-Pearson, V. Mesure du taux de mycorhization VA d’un systeme radiculaire. Recherche de methods d’estimation ayant une signification fonctionnelle. Aspects Physiologiques et Genetiques des Mycorhizes. , 217-221 (1986).
- Schenk, R. U., Hildebrandt, A. C. Medium and techniques for induction and growth of monocotyledonous and dicotyledonous plant cell cultures. Canadian Journal of Botany. 50, 199-204 (1972).
- Becking, J. H. The Parasponia parviflora - Rhizobium symbiosis. Host specificity, growth and nitrogen fixation under various conditions. Plant and Soil. 75, 309-342 (1983).
- Hoagland, D. R., Arnon Revised, D. I., Arnon, D. I. The Water-Culture Method for Growing Plants without Soil. Circular California Agricultural Experiment Station. 347, 1-32 (1950).
- Wang, K. Methods in Molecular Biology: Agrobacterium Protocols. 1, Humana Press. (2015).
- Smulders, M. J. M., de Klerk, G. J. Epigenetics in plant tissue culture. Plant Growth Regulation. 63, 137-146 (2011).
- Larkin, P. J., Scowcroft, W. R. Somaclonal variation — a novel source of variability from cell cultures for plant improvement. Theoretical and Applied Genetics. 60, 197-214 (1981).
- Cannon, S. B., et al. Legume genome evolution viewed through the Medicago truncatula and Lotus japonicus genomes. Proceedings of the National Academy of Sciences of the United States of America. 103, 14959-14964 (2006).
- Tuskan, G. A., et al. The Genome of Black Cottonwood, Populus trichocarpa (Torr. & Gray). Science. 313, 1596-1604 (2006).
- Young, N. D., et al. The Medicago genome provides insight into the evolution of rhizobial symbioses. Nature. 480, 520(2011).
- Sato, S., et al. Genome Structure of the Legume, Lotus japonicus. DNA Research. 15, 227-239 (2008).
- Xing, H. L., et al. A CRISPR/Cas9 toolkit for multiplex genome editing in plants. BMC Plant Biology. 14, 327(2014).
- Lowder, L. G., et al. A CRISPR/Cas9 Toolbox for Multiplexed Plant Genome Editing and Transcriptional Regulation. Plant Physiology. 169, 971(2015).
- van Zeijl, A. Dissecting Hormonal Pathways in Nitrogen-Fixing Rhizobium Symbioses. , Wageningen University. (2017).
Reprints and Permissions
