This article describes the generation of an orthotopic mouse model of human pleural mesothelioma by implantation of H2052/484 mesothelioma cells into the pleural cavity of immunocompromised athymic mice. The longitudinal monitoring of the development of intrapleural tumors was assessed by non-invasive multimodal [18F]-2-fluoro-2-deoxy-D-glucose positron emission tomography and computed tomography imaging.
Method Article
Implantation and Monitoring by PET/CT of an Orthotopic Model of Human Pleural Mesothelioma in Athymic Mice
In This Article
Summary
Abstract
Malignant pleural mesothelioma (MPM) is a rare and aggressive tumor arising in the mesothelium that covers the lungs, the heart, and the thoracic cavity. MPM development is mainly associated with asbestos. Treatments provide only modest survival since the median survival average is 9–18 months from the time of diagnosis. Therefore, more effective treatments must be identified. Most data describing new therapeutic targets were obtained from in vitro experiments and need to be validated in reliable in vivo preclinical models. This article describes one such reliable MPM orthotopic model obtained after injection of a human MPM cell line H2052/484 into the pleural cavity of immunodeficient athymic mice. Transplantation in the orthotopic site allows studying the progression of tumor in the natural in vivo environment. Positron emission tomography/computed tomography (PET/CT) molecular imaging using the clinical [18F]-2-fluoro-2-deoxy-D-glucose ([18F]FDG) radiotracer is the diagnosis method of choice for examining patients with MPM. Accordingly, [18F]FDG-PET/CT was used to longitudinally monitor the disease progression of the H2052/484 orthotopic model. This technique has a high 3R potential (Reduce the number of animals, Refine to lessen pain and discomfort, and Replace animal experimentation with alternatives) since the tumor development can be monitored non-invasively and the number of animals required could be significantly reduced.
This model displays a high development rate, a rapid tumor growth, is cost-efficient and allows for rapid clinical translation. By using this orthotopic xenograft MPM model, researchers can assess biological responses of a reliable MPM model following therapeutic interventions.
Introduction
Malignant pleural mesothelioma (MPM) is a cancer most often associated with the exposure to asbestos fibers1,2,3. Although asbestos has been banned in most Western countries4,5,6, the incidence of MPM is still increasing7,8. Recently, exposure of mice to carbon nanotubes suggests that they may result in significant health risk in humans9,10. The data suggest that exposure to these products may induce chronic inflammation and molecular changes (e.g., loss of tumor-suppressor pathways) that underlie progression to malignant mesothelioma. Currently, multiwall carbon nanotubes are one of the most important products of nanotechnology and are increasingly incorporated in various products such as composites, energy storage materials, medicine, electronics, and environmental remediation materials.
MPM is a cancer with poor prognosis, and most patients die within two years after diagnosis due to a limited efficacy of current treatment modalities11. The choice of the treatment for MPM depends on the cancer stage. For most early-stage MPM (stage 1 and possibly some stage 2 or 3 tumors), the clinical approach is a multimodal therapy including the surgical resection of the tumors, associated to radiotherapy and chemotherapy12. A combined chemotherapy with cisplatin and pemetrexed is indicated for the treatment of most patients diagnosed with advanced locally invasive disease, that is not amenable to surgical resection, or who are otherwise not candidates for curative surgery13,14. There is, therefore, an urgent need to develop more effective treatments for MPM patients. However, there are few validated in vivo animal models that reflect the clinical relevancy of MPM. Several murine MPM models have been developed but most of them do not faithfully recapitulate the complex aspects of the MPM tumor microenvironment15,16,17,18. The use of asbestos-induced MPM in mice, genetically engineered MPM mouse models, or models of syngeneic transplantation of murine MPM cell lines are limited by fundamental phenotypic and functional differences and, consequently, poorly translate new discoveries to the clinic. Other preclinical murine MPM models mostly rely on subcutaneous or peritoneal xenografts of human cell lines in immunodeficient mice. While these models are easy to monitor and provide fundamental data, the microenvironment of these xenografts is not that comparable to human tumors impairing the translational power of most of these preclinical studies17,19. Conversely, orthotopic xenografts better reflect the patient tumor behavior and response to treatment as they are surrounded with a similar microenvironment as the one found in the original tumor site16.
Molecular imaging by [18F]FDG-PET/CT is the method of choice to longitudinally monitor disease progression in patients with MPM20,21. Therefore, resorting to this non-invasive imaging method greatly promotes the translation of preclinical studies to clinical trials16,22. Moreover, it helps to reduce the required number of animals as each animal represents its own control over time.
In this article, we present a reliable orthotopic xenograft MPM model obtained after injection of the human MPM cell line H2052/484 into the pleural cavity of athymic mice. Coupled with [18F]FDG-PET/CT imaging, this model is a valuable and reproducible method to study functional and mechanistic effects of new diagnostic strategies and treatments for human MPM.
Protocol
All the procedures described below were approved by the institutional animal care and use committee and by the veterinarian state office of Geneva, Switzerland (Authorization GE/106/16). The MPM cell line H2052/484 was established and characterized in our laboratory as detailed in the article of Colin DJ and et al.23. Briefly, H2052/484 cell line was established from a thoracic tumor obtained after an intrapleural injection of NCI-H2052 (ATCC) cells into immunodeficient Nude mice.
1. Experimental Design
- Determine how many mice are needed according to the experiment using statistical power calculation (e.g. http://powerandsamplesize.com/Calculators/).
- At least one week prior to implantation, purchase eight to ten-week-old athymic female nude mice Foxn1nu nu/nu and house them in a specific-pathogen-free (SPF) environment for at least a week.
2. Preparation of Cells for Implantation
- Calculate how many H2052/484 cells are needed as each mouse is injected with 1 x 10⁶ cells (step 1.1). Prepare an extra number of cells as injection to mice will involve syringe sampling.
- Culture the MPM H2052/484 cell line in RPMI 1640 medium supplemented with 10% (v/v) fetal bovine serum (FBS), 100 Units/mL penicillin and 100 μg/mL streptomycin in a tissue culture incubator at 37 °C with 5% CO2.
- Culture cells for implantation to approximately 80% confluence (~7 x 10⁶ cells per 15 cm Petri dish).
- About 1 h before grafting, prepare the cells.
- Discard the media, wash cells with sterile PBS without calcium and magnesium (10 mL per 15 cm Petri dish) and detach cells by incubating for 5 min with 0.05% trypsin-2 mM EDTA (2 mL per 15 cm Petri dish).
- Collect the cells in RPMI medium (10 mL per 15 cm Petri dish) and count the cells using a hemocytometer.
- Collect the appropriate number of cells for the number of mice to be injected considering as calculated according to step 1.2.
- Centrifuge at 300 x g for 3 min, wash the cell pellet in 10 mL of RPMI medium without FBS and centrifuge again at 300 x g for 3 min.
- Resuspend the cells in an appropriate volume of RPMI medium without FBS to a concentration of 1 x 10⁶ cells per 50 µL as each mouse must be injected with a volume of 50 µL.
3. Tumor Cell Implantation
- Prior to implantation, prepare the anesthesia system and surgical area in a laminar flow hood by spraying all surfaces with a disinfectant. Prepare sterile or disinfected supplies in the laminar flow hood including the anesthesia system, the heating pad to maintain mouse body temperature, the polyvidone iodine solution, a 30 G Hamilton syringe (e.g., 705RN syringe, 30 G needle-20 mm-Point Style 4), sterile gauze and cotton swabs, sterile disposable scalpels and surgery instruments and sterile micropipettes and tips.
- Keep and open the microisolated SPF-cages in the disinfected flow hood and anaesthetize one mouse after the other according to the grafting speed. Grafting duration is about 5–10 min for experimented technicians.
- Anaesthetize mice by inducing first with 4–5% isoflurane. Then maintain under anesthesia on the heating pad while grafting with 3% isoflurane. Determine the depth of anesthesia by the loss of righting reflex by mouse.
- Once a mouse is anaesthetized, inject subcutaneously 0.05 mg/kg buprenorphine as an analgesic/post-operative pain-relief.
- Place the mouse on its right side (right lateral decubitus) on the heating pad.
- Clean the surgical area with polyvidone iodine solution and make a 5 mm incision of the skin and clear surrounding fat and muscles with blunt scissors to expose the ribs.
- Homogenize the cell suspension at a concentration of 1 x 10⁶ cells per 50 µL of RPMI medium without FBS and load 50 µL of the suspension with the Hamilton syringe. Avoid air bubbles and wipe the needle with 70% alcohol to avoid non-orthotopic grafting of cells. Homogenize the cell suspension before each injection.
- Slowly inject the cells into the pleural cavity between the 6th and 7th ribs with an angle of 30° and a depth of 2–3 mm just under the intercostal muscles. Make sure not to inject into the lungs by keeping the needle just under the ribs. The needle should be visible by transparency through the muscles (Figure 1A).
- Close the wound with three to four absorbable sutures.
- Store the mice in a warmed environment until they wake up.
- The day after, repeat buprenorphine injection. Monitor mice according to the experimental design and authorization.
4. [18F]FDG-PET/CT Imaging
NOTE: All the procedures described below must be approved by local animal housing and imaging facilities. Make sure that radioactive materials are imported, stored and handled according to local radiation safety rules (e.g., stock solutions activity, shielded hood handling). SPF conditions can be maintained by manipulating animals in a laminar flow hood and by loading them in SPF-compatible scanner bed (Figure 1B, C).
- Monitor the tumor development performing PET/CT imaging, once a week, starting on day 7 after implantation of the H2052/484 cells. Each animal represents its own control over time.
- Avoid distress of animals prior to imaging by transporting mice to imaging facility housing if available or keep them close to the facility.
- Fast mice for 12–16 h before [18F]FDG-PET/CT which reduces background signals. See Fueger24 who described the impact of animal handling on [18F]FDG-PET/CT scans.
- Decontaminate and store the mice bed according to local rules.
- Record all times of radioactivity doses measurements, injections and PET scans to be able to calculate SUVs.
- Pre-warm mice at 30 °C for 30 min prior to injection of [18F]FDG that reduces brown adipose tissue (BAT) metabolism. For example, pre-warm in heating chambers, by using heating pads or by using infrared lamps.
- Prepare 3–4 MBq doses of [18F]FDG from stock solution in 150-200 µL of saline in 1 mL insulin syringes by using a dose calibrator. Insulin syringes have the advantage of having almost no dead volume and could avoid the measurement of remaining activity after injection.
- Anaesthetize mice with isoflurane as described in step 3.3. Weigh mice and then inject intravenously 3–4 MBq [18F]FDG. Retro-orbital injection is a method of choice since it is quick, easy and avoids tail vein injection issues or delayed uptake of intraperitoneal injection.
- After injection, leave mice awake for 45 min in their cages under the warm conditions initiated in step 3.5. The duration of [18F]FDG uptake is 1 h; 15 min are normally sufficient to load mice on the bed and perform CT before PET.
- Anaesthetize mice with isoflurane as described in step 3.3 and load them on the scanner bed (Figure 1B).
- Transfer the bed to the scanner and subject animals to a CT scan centered on the lungs. Acquire scans at 80 kVp, 160 μA, 1024 projections during a 360° rotation, with a field of view of 74 mm (1.6x magnification, example of Triumph acquisition) (Figure 1C).
- Move the bed to the PET subsystem and start the acquisition 1 h after [18F]FDG injection for a duration of 15 min. With most of PET/CT systems, the bed can be moved automatically from the CT to the PET to keep the FOV centered on the same area.
- Remove the mice from the imaging chamber and allow them to recover in their cage.
- Keep mice in an area dedicated to radioactive decay according to local rules.
5. Analyses of [18F]FDG-PET/CT Scans
- Reconstruct CT scans performed in the conditions mentioned above with a matrix of 512 and a voxel size of 0.144 mm (Filtered Back Projection-FBP algorithm, built-in software). Reconstruct PET scans using an 20 iterations of an Ordered Subset Expectation Maximum-3 Dimension-OSEM3D algorithm. Calibrate the images in Bq/mL by scanning a phantom cylinder. Automatically co-register the CT and PET scans according to your built-in software solution.
- Analyze lungs volumes by using the analysis software (Table of Materials).
- Load CT data as reference (Ref) by clicking on the Open Data icon. Then load PET data as input (Inp1) by clicking on the Append Data icon.
- Adjust the color scales ("WL") of CT and PET to contrast images for visual inspection.
- Select 3D ROI Tool from the drop-down menu, click on Add ROI and name the file Lungs. Click on Segmentation Algorithms | Neighborhood Thresholding. Define Input as Background and Image as Ref. Enter Min and Max according to mouse lung density values, typically -800 and -300 HU. Inspect 3D rendered lungs by clicking on the vtk icon and retrieve the volume in the table generated by clicking on the Show Table Icon.
- Analyze [18F]FDG uptake in tumors by extracting maximum Standard Uptake Values (SUVmax).
- Convert PET images calibrated in Bq/mL to SUV by selecting Arithmetics from the drop-down menu, then Scalar Multiply and use inp1 as Selected and Scalar is Bq/mL to SUV factor calculated as follow: SUV = (Bq/mL)/(injected dose (Bq)/body weight(g)).
- Select 3D ROI Tool from the drop-down menu, click on Add ROI and name the file Tumors. Click on 3D Paint mode | Sphere. Uncheck 2D only. Adjust the size of the shape and surround the tumors. Make sure not to include any interfering signals coming from heart for example. Retrieve SUVmax value in the table generated by clicking on the Show Table Icon.
Results
The H2052/484 orthotopic model
Orthotopic MPM models by intra-thoracic injection of cultured cancer cells, especially H2052/484 cells are relatively easy to setup. The different steps described above only require modest cell culture knowledge and the surgery steps are accessible to moderately trained animal experimenters. Nude mice and cells should be manipulated under sterile conditions to maximize the outcome of the implantations. By carefully following this protocol, which involves short anesthesia and minimal surgery, we encountered only 1 death among 266 mice injected with different MPM cell lines. No pneumothorax or intra-pulmonary implantations of tumor cells were observed among these 266 mice carefully injected as described. Specifically, the orthotopic tumor development rate of the H2052/484 cell line is high since 93.8% of injected mice developed tumors (n = 118). H2052/484 tumors can be detected by PET/CT imaging from 14 days after injection and the median duration of the experiment according to our endpoint criteria was 31 days in a representative experiment21. As we described in this other study21, the tumors were localized in the thoracic cavity, freely distributed or attached on the lungs, the thoracic muscles, the aortic arch or the inferior vena cava. Metastases were not found.
MPM monitoring by [18F]FDG-PET/CT imaging
Orthotopic MPM were monitored weekly by combined PET/CT imaging with the widely used radiotracer [18F]FDG that accumulates in highly metabolic tumors. Longitudinal anatomical CT scans allowed visualizing the impact of MPM development on the morphology of lungs. Automatic segmentation of highly contrasted lungs on CT scans is simple due to their low density as compared to surrounding tissues. 3D renderings give an overview of the localization of tumors and longitudinal volumes of lungs can be extracted (Figure 2A). Lung volumes measurements by CT decreased significantly over time after MPM injection of mice with intrapleural (ipl) H2052/484 tumors (Figure 2B). Indeed, MPM tumors grow inside the pleural cavity and create pressures on the lungs, reducing their volumes. Correlation analyses demonstrated that lung volumes were inversely correlated to the time of monitoring with a coefficient of determination R2 of 0.8 (Figure 2C). Altogether, these data show the reliability of CT scan to monitor the development of this MPM model.
Combined with CT, a [18F]FDG-PET scan provides additional and valuable information on the metabolic status of MPM tumors. While sometimes it can be complicated to interpret CT and PET scans images by themselves, especially at early time points, a combination of both modalities gives further robustness to diagnosis. Indeed, representative longitudinal [18F]FDG-PET/CT monitoring performed between 10 days and 44 days of a mouse with ipl H2052/484 tumors shows that tumors begin to be distinguishable 2 weeks after grafting (Figure 3A). This example highlights the growth and [18F]FDG avidity of tumors located at the periphery of the thoracic cavity and along the heart great vessels (white arrows). [18F]FDG uptake in tumors was quantified by extracting SUVmax in ROIs drawn over tumors, with the help of CT scans, and shows significant time-dependent increases of their glucose metabolism (Figure 3B). Correlation analyses demonstrated that SUVmax were positively correlated to the time of monitoring with a coefficient of determination R2 of 0.7 (Figure 3C). These data demonstrate the reliability of [18F]FDG-PET scans to monitor the fate of H2052/484 orthotopic tumors. Finally, lung volumes and [18F]FDG avidity, respectively, analyzed by CT and PET, correlate with each other with an R2 of 0.6 supporting the strength of these measurements to study MPM orthotopic tumors development (Figure 4).
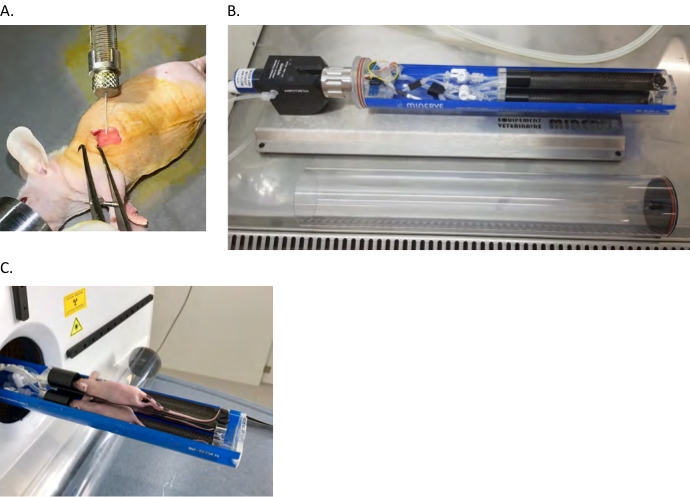
Figure 1: Nude mouse orthotopic xenograft model. (A) Intrapleural (ipl) injection of human MPM cells into the left pleural cavity as described in the protocol section. (B,C) Mice are anesthetized and loaded in the PET/CT bed in a laminar flow hood then transferred to the scanner. Please click here to view a larger version of this figure.
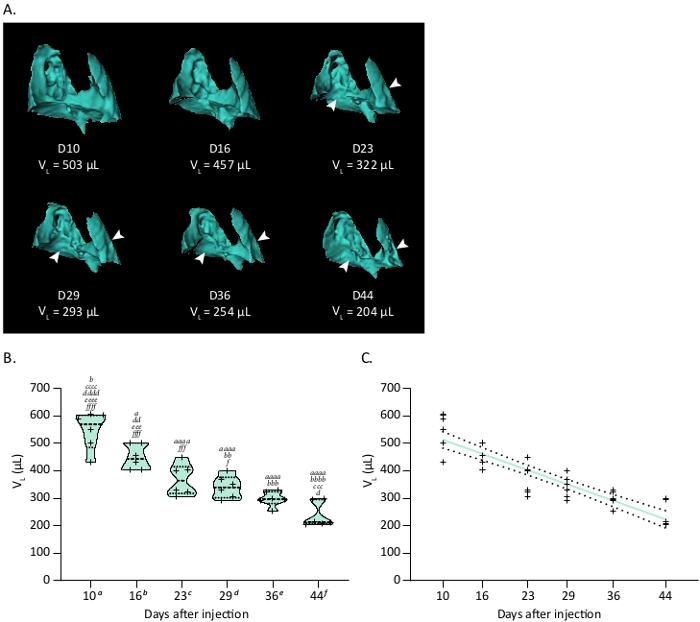
Figure 2: Tumor growth of the orthotopic H2052/484 MPM model monitored by CT. (A) Representative 3D reconstructions of CT scans showing H2052/484 MPM ipl tumors and their effect on the lung volume (Vp) at various time in days after implantation. White arrowheads show location of MPM ipl tumors. (B) Violin plot showing a representative time course of lung volumes (VL), n = 6. One-way ANOVA test with Tukey's multiple comparisons statistics are indicated. Letters indicate significant differences between models with a, b, c, d, e, f indicating respectively D10, D16, D23, D29, D36 and D44. Corresponding p values: x, p < 0.05; xx, p < 0.01; xxx, p < 0.001; xxxx, p < 0.0001. (C) Correlation between the decrease of lung volume related to ipl MPM development and time after injection. Linear regression is plotted as a thick colored line and related SD as dashed black lines. Graphs and statistical analyses were performed with software. Please click here to view a larger version of this figure.
![[F-18]FDG-PET/CT scans show SUV changes over time, with coronal and transversal images; SUVmax chart.](/files/ftp_upload/60272/60272fig03.jpg "figure-results-3")
Figure 3: Tumor metabolism of the ipl MPM model followed by [18F]FDG-microPET/CT. (A) Representative PET/CT scans showing MPM ipl tumors. PET/CT images show trans-axial slices of the chest area containing the [18F]FDG-avid tumors, with CT (grey scale) providing anatomical information and PET (calibrated pseudo-color scale) showing the location and intensity of high tumor and organ glucose utilization. Post-injection days are indicated. CT: CT mediastinal window; [18F]FDG-PET/CT: fused image of PET and CT scans. White arrowheads show MPM ipl tumors. L = lung, H = heart, BAT = brown adipose tissue. (B) Violin plot showing a representative time course of SUVmax linked to MPM metabolism, n = 6. One-way ANOVA test with Tukey's multiple comparisons statistics are indicated. Letters indicate significant differences between models with a, b, c, d, e, f indicating respectively D10, D16, D23, D29, D36 and D44. Corresponding p values: x, p < 0.05; xx, p < 0.01; xxx, p < 0.001; xxxx, p < 0.0001. (C) Correlation between the increase of SUVmax in ipl MPM tumors and time after injection. Linear regression is plotted as a thick colored line and related SD as dashed black lines. Graphs and statistical analyses were performed with software. Please click here to view a larger version of this figure.
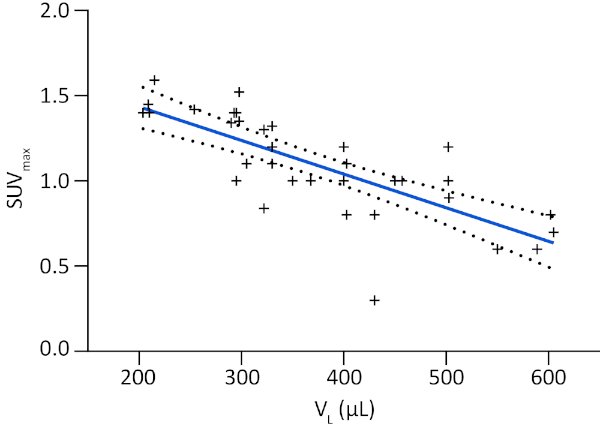
Figure 4: Correlation between MPM development monitored by lung volume and metabolic tumor activity. Correlation between SUVmax and lung volume (VL) displayed as a linear regression plotted as a thick colored line and related SD as dashed black lines. Graphs and statistical analyses were performed with software. Please click here to view a larger version of this figure.
Discussion
This paper describes an original orthotopic model of MPM H2052/484 cells injected in the pleural cavity of athymic mice and a method of monitoring by small animal PET/CT imaging. This model can be implemented with moderate animal handling and surgery skills and displays a very good development rate. It allows a large experimental window of about 10 weeks in untreated mice and non-invasive longitudinal detection of tumors as early as 2 weeks after injection.
Orthotopic models rely on the implantation of living cells or tissues directly into the initial environment of the tumor. The main difference between widely used subcutaneous or intraperitoneal MPM models and intrapleural models lies in their microenvironment. Indeed, the microenvironment of tumors contains multiple stromal cell types (fibroblasts, leucocytes, macrophages) in addition to cancer cells25. These stromal cells secrete growth factors and cytokines contributing to the tumor microenvironment that modulate tumor growth. The tumor microenvironment varies with the anatomical site suggesting that an orthotopic xenograft will develop and respond differently to a treatment than a subcutaneous one25. Therefore, as orthotopic xenografts are surrounded with a comparable microenvironment to the one found in MPM patients, their behavior and response to treatment should better reflect the clinical situation17,19.
Many preclinical models in cancer research implicate immunodeficient mice to ensure human xenograft success. Nude mice do not possess mature thymus and lack a vital part of tumor microenvironment26. Although nude mice do not possess mature thymus and are consequently deficient in T cells, they present mature lymphocytes B, neutrophils, monocytes and macrophages into their pleural microenvironment in contrast to more permissive and highly deficient SCID mice26. In the early stages of MPM development, regulatory T cells have an important suppressive role. However, in more advanced stages, myeloid cells including neutrophils and macrophages replace Treg cells; in this function, the suppressive role of regulatory T cells is only important during early stages of MPM development23,27. Consequently, although studies involving a complete immune response (e.g., immunotherapies involving a T response) cannot be studied in the model presented here, we postulate that this orthotopic model keeps all its interest to assess new treatments or new diagnostic tools of MPM.
In a methodological point of view, there are critical steps to keep in mind to maximize the development of intrapleural MPM tumors. Prior to establishing mice models, have access to exponentially growing cells (less than 80% confluency, depending on cell lines) and to 8 to 10 months acclimated mice. Indeed, injecting younger small mice is difficult and can result in ectopic injections and alter survival. During the implantation procedure, standard surgery precautions should be taken, and blunt scissors should be used especially when incising to avoid bleeding, which could lead to death of animals. The choice of the syringe (e.g., the model described here) and the protocol presented here allow precise and gentle injection of a small volume of medium containing tumor cells to ensure intrapleural injection (30° angle, 2–3 mm depth).
Longitudinal monitoring of orthotopic MPM models can only be performed non-invasively by imaging technics. PET/CT is the advised method in clinical practice to diagnose MPM and has consequently been used in this study20,21. As compared to widely used optical imaging, PET/CT imaging involves the use of radioactive compounds and is therefore more delicate to setup because of the safety, the logistics of radiotracers and its cost28. Nevertheless, PET/CT imaging does not rely on genetic modification of tumor cells and provides high-resolution tomographic, anatomic and molecular information. Optical imaging is also faster than PET/CT but the imaging system presented in this article involves a 3-mice bed and about 20 mice can be scanned per day, which is a reasonable throughput considering the information collected. The use of the highly available clinical radiotracer [18F]FDG warrants a high translational power to research performed with this technique29. Although [18F]FDG-PET scan readings and analyses might require some experience because of the high uptake in surrounding heart and brown adipose tissues, its combination with CT refines diagnosis. During [18F]FDG PET/CT experiments, fasting and warming mice as well as performing an uptake time of [18F]FDG of 1 h can significantly enhance the visualization of tumors since scan conditions highly impact PET contrasts as already described24. Further studies on preclinical orthotopic models involving other clinically-used radiotracers as [18F]Fluorothymidine (FLT) or [18F]Fluoromisonidazole (FMISO), which monitors proliferation and hypoxia respectively, could provide more information on such reliable orthotopic MPM models29.
Finally, this relevant translational model combined with non-invasive imaging is perfectly in line with the 3R concept: Reduce the number of animals, Refine to lessen pain and discomfort and Replace animal experimentation with alternatives22. Indeed, within the same set of animals, therapeutic follow-up and response can be monitored non-invasively allowing longitudinal measurements throughout the experiments, thus reducing the number of animals required per experiment. Moreover, as each animal represent its own control over time, non-invasive imaging also highly increase statistical power reducing the number of needed animals to obtain reliable data16.
Disclosures
The authors have nothing to disclose.
Acknowledgements
This research was funded by Ligue Genevoise contre le Cancer (to V.S.-B.) and by the Center for Biomedical Imaging (CIBM) of the Universities and Hospitals of Geneva and Lausanne (to D.J.C., O.B. and S.G.).
Materials
| Name | Company | Catalog Number | Comments |
|---|---|---|---|
| 3-mice bed | Minerve | bed for mice imaging | |
| Athymic Nude-Foxn1n nu/nu | Envigo, Huntingdon, UK | 6907F | immunodeficient mouse |
| Betadine | Mundipharma Medical Company, CH | 111131 | polyvidone iodine solution |
| Dulbecco's Phosphate-Buffered Saline (DPBS) | ThermoFisher Scientific, Waltham, MA, USA | 14190094 | Buffer for cell culture |
| Fetal bovine serum (FBS) | PAA Laboratories, Pasching, Austria | A15-101 | cell culture medium supplement |
| Insulin syringes | BD Biosciences, San Jose, CA, USA | 324826 | syringe for cell injection |
| Penicillin/Streptomycin | ThermoFisher Scientific, Waltham, MA, USA | 15140122 | antibiotics for cell culture medium |
| RPMI 1640 | ThermoFisher Scientific, Waltham, MA, USA | 61870010 | basal cell culture medium |
| Temgesic (Buprenorphin 0.3 mg/mL) | Alloga SA, CH | 700320 | opioid analgesic product |
| Triumph PET/SPECT/CT | Trifoil, Chatsworth, CA, USA | imaging equipment | |
| Trypsin | ThermoFisher Scientific, Waltham, MA, USA | 25050014 | enzymatic cell dissociation buffer |
| Virkon S 2% | Milian, Vernier, CH | 972472 | disinfectant |
| Vivoquant | Invicro, Boston, MA, USA |
References
- Grishman, E., Cohen, S., Salomon, M. I., Churg, J. Renal lesions in acute rheumatic fever. The American Journal of Pathology. 51 (6), 1045-1061 (1967).
- Mossman, B. T., Gee, J. B. Asbestos-related diseases. The New England Journal of Medicine. 320 (26), 1721-1730 (1989).
- Pass, H. I., et al. Asbestos exposure, pleural mesothelioma, and serum osteopontin levels. The New England Journal of Medicine. 353 (15), 1564-1573 (2005).
- Allen, L. P., Baez, J., Stern, M. E. C., Takahashi, K., George, F. Trends and the Economic Effect of Asbestos Bans and Decline in Asbestos Consumption and Production Worldwide. The Journal of Environmental Research and Public Health. 15 (3), (2018).
- LaDou, J., et al. The case for a global ban on asbestos. Environmental Health Perspectives. 118 (7), 897-901 (2010).
- Soeberg, M., Vallance, D. A., Keena, V., Takahashi, K., Leigh, J. Australia's Ongoing Legacy of Asbestos: Significant Challenges Remain Even after the Complete Banning of Asbestos Almost Fifteen Years Ago. The Journal of Environmental Research and Public Health. 15 (2), (2018).
- Glynn, M. E., Keeton, K. A., Gaffney, S. H., Sahmel, J. Ambient Asbestos Fiber Concentrations and Long-Term Trends in Pleural Mesothelioma Incidence between Urban and Rural Areas in the United States (1973-2012). Risk Analysis. 38 (3), 454-471 (2018).
- Zhao, J., et al. Epidemiology and trend analysis on malignant mesothelioma in China. The Chinese Journal of Cancer Research. 29 (4), 361-368 (2017).
- Chernova, T., et al. Long-Fiber Carbon Nanotubes Replicate Asbestos-Induced Mesothelioma with Disruption of the Tumor Suppressor Gene Cdkn2a (Ink4a/Arf). Current Biology. 27 (21), 3302-3314 (2017).
- Fukushima, S., et al. Carcinogenicity of multi-walled carbon nanotubes: challenging issue on hazard assessment. The Journal of Occupational Health. 60 (1), 10-30 (2018).
- Robinson, B. W., Musk, A. W., Lake, R. A. Malignant mesothelioma. The Lancet. 366 (9483), 397-408 (2005).
- Ricciardi, S., et al. Surgery for malignant pleural mesothelioma: an international guidelines review. The Journal of Thoracic Diseases. 10, Suppl 2 285-292 (2018).
- Hiddinga, B. I., Rolfo, C., van Meerbeeck, J. P. Mesothelioma treatment: Are we on target? A review. The Journal of Advanced Research. 6 (3), 319-330 (2015).
- Kim, J., Bhagwandin, S., Labow, D. M. Malignant peritoneal mesothelioma: a review. Annals of Translational Medicine. 5 (11), 236(2017).
- Ampollini, L., et al. Immuno-chemotherapy reduces recurrence of malignant pleural mesothelioma: an experimental setting. The European Journal of Cardiothoracic Surgery. 35 (3), 457-462 (2009).
- de Jong, M., Essers, J., van Weerden, W. M. Imaging preclinical tumour models: improving translational power. Nature Reviews Cancer. 14 (7), 481-493 (2014).
- Mak, I. W., Evaniew, N., Ghert, M. Lost in translation: animal models and clinical trials in cancer treatment. The American Journal of Translational Research. 6 (2), 114-118 (2014).
- Mazzocchi, A. R., Rajan, S. A. P., Votanopoulos, K. I., Hall, A. R., Skardal, A. In vitro patient-derived 3D mesothelioma tumor organoids facilitate patient-centric therapeutic screening. Scientific Reports. 8 (1), 2886(2018).
- Gengenbacher, N., Singhal, M., Augustin, H. G. Preclinical mouse solid tumour models: status quo, challenges and perspectives. Nature Reviews Cancer. 17 (12), 751-765 (2017).
- Kanemura, S., et al. Metabolic response assessment with 18F-FDG-PET/CT is superior to modified RECIST for the evaluation of response to platinum-based doublet chemotherapy in malignant pleural mesothelioma. The European Journal of Radiology. 86, 92-98 (2017).
- Truong, M. T., Viswanathan, C., Godoy, M. B., Carter, B. W., Marom, E. M. Malignant pleural mesothelioma: role of CT, MRI, and PET/CT in staging evaluation and treatment considerations. Seminars in Roentgenology. 48 (4), 323-334 (2013).
- MacArthur Clark, J. The 3Rs in research: a contemporary approach to replacement, reduction and refinement. The British Journal of Nutrition. 120, 1-7 (2018).
- Colin, D. J., et al. Experimental Model of Human Malignant Mesothelioma in Athymic Mice. The International Journal of Molecular Sciences. 19 (7), (2018).
- Fueger, B. J., et al. Impact of animal handling on the results of 18F-FDG PET studies in mice. The Journal of Nuclear Medicine. 47 (6), 999-1006 (2006).
- Devaud, C., et al. Tissues in different anatomical sites can sculpt and vary the tumor microenvironment to affect responses to therapy. Molecular Therapy. 22 (1), 18-27 (2014).
- Belizário, J. E. Immunodeficient mouse models: An overview. The Open Immunology Journal. 2, 79-85 (2009).
- Jackaman, C., Yeoh, T. L., Acuil, M. L., Gardner, J. K., Nelson, D. J. Murine mesothelioma induces locally-proliferating IL-10(+)TNF-alpha(+)CD206(-)CX3CR1(+) M3 macrophages that can be selectively depleted by chemotherapy or immunotherapy. Oncoimmunology. 5 (6), 1173299(2016).
- James, M. L., Gambhir, S. S. A molecular imaging primer: modalities, imaging agents, and applications. Physiological Reviews. 92 (2), 897-965 (2012).
- Kenny, L. M., Aboagye, E. O. Clinical translation of molecular imaging agents used in PET studies of cancer. Advances in Cancer Research. 124, 329-374 (2014).
Reprints and Permissions
