We present a method that combines membrane protein purification and reconstitution into peptidiscs in a single chromatographic step. Biotinylated scaffolds are used for direct surface attachment and measurement of protein-ligand interactions via biolayer interferometry.
Method Article
PeptiQuick, a One-Step Incorporation of Membrane Proteins into Biotinylated Peptidiscs for Streamlined Protein Binding Assays
In This Article
Summary
Abstract
Membrane proteins, including transporters, channels, and receptors, constitute nearly one-fourth of the cellular proteome and over half of current drug targets. Yet, a major barrier to their characterization and exploitation in academic or industrial settings is that most biochemical, biophysical, and drug screening strategies require these proteins to be in a water-soluble state. Our laboratory recently developed the peptidisc, a membrane mimetic offering a “one-size-fits-all” approach to the problem of membrane protein solubility. We present here a streamlined protocol that combines protein purification and peptidisc reconstitution in a single chromatographic step. This workflow, termed PeptiQuick, allows for bypassing dialysis and incubation with polystyrene beads, thereby greatly reducing exposure to detergent, protein denaturation, and sample loss. When PeptiQuick is performed with biotinylated scaffolds, the preparation can be directly attached to streptavidin-coated surfaces. There is no need to biotinylate or modify the membrane protein target. PeptiQuick is showcased here with the membrane receptor FhuA and antimicrobial ligand colicin M, using biolayer interferometry to determine the precise kinetics of their interaction. It is concluded that PeptiQuick is a convenient way to prepare and analyze membrane protein-ligand interactions within one day in a detergent-free environment.
Introduction
Membrane proteins are often excluded from drug or antibody discovery research programs due to the propensity of membrane proteins to aggregate outside of the lipid bilayer environment, especially in the presence of detergents1. Therefore, in recent years, several membrane mimetics (termed scaffolds) have been developed to facilitate isolation and interrogation of membrane proteins in a completely detergent-free environment (i.e., nanodiscs, SMALPs, amphipols, etc.)2,3,4,5,6. However, reconstitution of membrane proteins in these mimetics often requires extensive optimization, which is time-consuming and generally accompanied with loss of protein recovery7,8. To overcome these limitations, our laboratory recently developed a “one-size-fits-all” formulation known as the peptidisc9. The peptidisc is formed when multiple copies of a designer 4.5 kDa amphipathic bihelical peptide bind to the hydrophobic surface of a target membrane protein. Stable reconstitution in peptidisc occurs upon removal of detergent, entrapping both endogenous lipids and solubilized membrane proteins into water-soluble particles. These stabilized particles are now amenable for numerous downstream applications.
The peptidisc method offers several advantages; for instance, reconstitution is straightforward, since binding of the peptidisc scaffold onto the target is guided by the protein template itself9,10. The peptide stoichiometry is also self-determined, and addition of exogenous lipids is not necessary. Peptidisc formation occurs by simple detergent dilution, an important advantage over dialysis or adsorption on polystyrene beads, which often result in low protein yield due to non-specific surface association and aggregation11,12,13. The final peptidisc assembly is highly thermostable and invariably soluble in different buffers or in the presence of divalent cations (e.g., Ni2+). The purity and structural homogeneity of the scaffold is also high (e.g., endotoxin-free), and the peptide can be customized with functional groups placed at different positions.
We present here a laboratory workflow called PeptiQuick, also known as on-beads reconstitution9. This protocol combines membrane protein purification and peptidisc reconstitution into a single step and on the same chromatographic support. As the name indicates, PeptiQuick is rapid compared to other reconstitution methods, and it also seriously reduces exposure time to detergent. Negative detergent effects such as protein unfolding and aggregation often occur in a time-dependent manner; therefore, minimizing detergent exposure is critical to maintain native protein conformation14,15. This is crucial for the accuracy of methods that report on protein interactions and ligand binding affinities.
While developing this protocol, we present the novel biotinylated version of the peptidisc scaffold, termed Bio-Peptidisc. The biotin functional groups allow attachment of the target membrane protein onto streptavidin-coated surfaces. Since biotin labeling is limited to the scaffold, binding sites on the target membrane protein remain unaltered. Using Bio-Peptidisc, the binding kinetics of the bacterial membrane receptor FhuA and antimicrobial peptide colicin M (ColM) are determined16. This affinity is measured via biolayer interferometry (BLI), which analyzes interactions in real-time based on white light interference patterns reflected from a sensor tip.
By using this protocol, the need for detergent during BLI analysis is eliminated, which is an important development, as detergents can disrupt interactions. Binding affinities can be measured rapidly with this method, and the results are comparable to those reported earlier using nanodiscs and isothermal titration calorimetry (ITC)16. The critical steps in the PeptiQuick workflow are shown and discussed, such as protein preparation, detergent dilution, peptide addition, and reconstitution, along with tips to troubleshoot ligand and analyte binding in the BLI assay. Using the PeptiQuick workflow, it is found that membrane proteins can be captured in peptidiscs and their interactions measured within a day.
Protocol
1. Preparation and solubilization of membrane receptor FhuA
- Express His6-tagged FhuA in Escherichia coli strain AW740. Grow cells for 18 h at 37 °C in M9 media (Table 1). See Mills et al.16 for a detailed expression protocol.
- Harvest cells by centrifugation (5,000 x g, 10 min, 4 °C) and resuspend them in 50 mL of Tris-salt-glycerol (TSG) buffer (Table 1). Dounce the resuspended cells and add phenylmethanesulfonylfluoride (PMSF) to a final concentration of 1 mM just prior to lysis.
CAUTION: PMSF is toxic and corrosive. - Lyse the cells using a microfluidizer (three passages) at 15,000 psi or a French press (three passages) at 8,000 psi. Pellet the unlysed cells and other insoluble material by low-speed centrifugation (5,000 x g, 10 min, 4 °C).
- Ultracentrifuge the supernatant (200,000 x g, 40 min, 4 °C) to isolate the crude membrane fraction. Discard the supernatant, resuspend the membrane pellet in a minimum amount of TSG buffer, and dounce using a glass or metal douncer apparatus to ensure homogeneity.
- Perform a Bradford assay to check the protein concentration of the resuspended crude membrane. Dilute the crude membrane to a final concentration of 3 mg/mL using TSG buffer prior to solubilization.
- Add detergent Triton X-100 to a final concentration of 1% (v/v) to selectively solubilize the bacterial inner membrane for 1 h at 4 °C with gentle rocking. Pellet the insoluble material (outer membrane fraction) by ultracentrifugation (200,000 x g, 40 min, 4 °C).
- Discard the supernatant containing the solubilized membrane and resuspend the pellet in TSG to a final concentration of 3 mg/mL. Add lauryldimethylamine oxide (LDAO) to a concentration of 1% (v/v) to the resuspended outer membrane fraction and solubilize for 1 h at 4 °C with gentle rocking.
- Perform a final centrifugation step to pellet all insoluble material (200,000 x g, 40 min, 4 °C).
NOTE: The resultant supernatant contains the solubilized outer membrane proteins, including the target his-tagged FhuA.
2. Purification and reconstitution of FhuA using the PeptiQuick workflow
- Pre-equilibrate a prepacked Ni-NTA column (5 mL resin volume) with two column volumes of immobilized metal affinity chromatography (IMAC) wash buffer (Table 1).
- Dilute the solubilized outer membrane from 1% LDAO to 0.04% LDAO using TSG. Then, add imidazole to a final concentration of 5 mM.
CAUTION: Imidazole is toxic and corrosive. - Load the solubilized outer membrane proteins onto the Ni-NTA resin and collect the flowthrough. Reload the flowthrough onto the resin to increase the resin binding of FhuA and collect the secondary flowthrough.
NOTE: Keep a 20 µL aliquot of solubilized material as a reference for later sodium dodecyl sulfate polyacrylamide gel electrophoresis (SDS-PAGE) analysis. - Wash the resin with 250 mL of IMAC wash buffer and collect the first 50 mL of eluate. Drain the wash buffer to the height of the resin bed volume and close the stopcock on the column.
- Add 1 mL of concentrated 10 mg/mL Bio-Peptidisc peptide solution (Table 1) to the column. Add 50 mL of dilute 1 mg/mL Bio-Peptidisc peptide solution in TSG and stir the resin with a glass rod to resuspend the beads in TSG.
- Following peptidisc trapping, allow the resin to settle and drain the excess 1 mg/mL Bio-Peptidisc solution through the resin.
- Wash the Ni-NTA attached peptidisc particles with 50 mL of TSG. Elute the peptidisc particles with 15 mL of IMAC elution buffer (Table 1) containing 600 mM imidazole in TSG. Collect 1 mL fractions and immediately add 10 µL of 0.5 M EDTA to chelate leached nickel ions.
CAUTION: EDTA is an irritant.
3. Evaluation of the PeptiQuick reconstitution
- SDS-PAGE analysis
- Load 10 µL aliquots of the start material, flowthrough, wash(es), and eluted fractions from the PeptiQuick reconstitution onto a 12% SDS-denaturing gel and electrophorese for 30 min at a constant current of 60 mA.
- Stain the gel with Coomassie blue dye, destain the gel, and visualize on a scanner.
- Size-exclusion chromatography (SEC)
- Based on the 12% SDS-PAGE analysis of the PeptiQuick reconstitution, isolate and pool the relevant fractions, and concentrate them using a 30 kDa cut-off centrifugal concentrator.
NOTE: In the accompanying video, fractions F3–F7 are pooled together and concentrated below 1 mL (the injection loop volume on the SEC instrument). - Inject ~1 mL of the pooled IMAC elution fractions onto a gel filtration S200 (300/10) column at a flow rate of 0.25 mL/min in TSG buffer. Collect 1 mL fractions and run them on a 12% SDS gel to determine which SEC fractions to pool and concentrate.
NOTE: The eluted PeptiQuick fractions may be pooled without concentration, and an aliquot may be injected onto the SEC to check quality of the reconstitution. This is an important control for membrane proteins that are potentially sensitive to aggregation during centrifugal concentration.
- Based on the 12% SDS-PAGE analysis of the PeptiQuick reconstitution, isolate and pool the relevant fractions, and concentrate them using a 30 kDa cut-off centrifugal concentrator.
4. Biolayer interferometry
- BLI experimental setup
- Set up the 96 well plate by hand.
NOTE: All wells are filled to a final volume of 200 µL. - In column 1, rows A−E, load 200 µL of kinetics buffer to allow the tips to equilibrate and form a baseline signal.
- Dilute the ligand (FhuA in Bio-Peptidisc) to a concentration of 2.5 µg/mL in kinetics buffer (Table 1). Load 200 µL of this dilution into rows A−D in column 2.
- Add 200 µL of kinetics buffer only to E2 (the reference sensor).
- Add 200 µL of kinetics buffer to column 3, rows A−E to wash excess FhuA from the tip.
- In column 4, conduct two-fold serial dilutions of the analyte (ColM) down the plate from A4 to D4. Start with 28 nM (8*Kd) in A4 to 3.5 nM (1*Kd) in D4.
- Add 28 nM ColM to E4 to measure for non-specific binding (the highest ColM concentration used).
- Add 200 µL of kinetics buffer to column 5, rows A−E.
NOTE: Here, the ColM will dissociate from the tip, and the dissociation is measured. - Place the setup plate in the BLI instrument.
- Place the sensor tip tray in the BLI instrument.
- Open the BLI data acquisition software and select New Kinetics Experiment on the software wizard.
- Use the plate definition tab to input the layout of the 96 well plate into the software.
NOTE: The wells containing the ligand, FhuA are inputted as the “Load”. Wells containing buffer only are inputted as the “Buffer”. Wells containing the analyte, ColM, are inputted as the “Sample”. - Use the assay definition tab to define the length of time and plate rotation speed for each step in the experiment.
NOTE: The experimental steps are set up as: 1) baseline: 60 s; 2) loading: 250 s; 3) baseline2: 300 s; 4) association: 450 s; and 5) dissociation: 900 s. Leave the shake speed as default (1,000 rpm). The above steps are individually assigned to each column in the 96 well plate by selecting the desired step and right-click Add Assay Step on each column. - Assign the first step by right-clicking on the first column and select Start New Assay. Ensure the baseline step is correctly assigned using the bottom righthand window and change with the drop-down menu as needed.
- Assign the subsequent steps to each column by right clicking along the plate and selecting Add Assay Step. Assign these to the appropriate column, as set in step 4.1.13.
- Use the sensor assignment tab to ensure that the octet instrument is taking BLI pins from the correct location in the sensor tray.
NOTE: In the sensor assignment tab, only A1−E1 should be highlighted blue. Ensure a sensor tip is present in these locations in the sensor tray and ensure that F1−H1 are empty. - Highlight F1−H1 on screen, then right-click and select Remove to mark these as empty. Tick Replace sensors in tray after use to retain the used sensors.
- In the review experiment tab, which provides a final overview of the experiment prior to execution, go over the experimental steps to ensure that the entire setup is correct.
- In the run experiment tab, select a file location to save the method files.
- Change the plate temperature to the room temperature.
- Select GO to run the experiment.
- Set up the 96 well plate by hand.
- BLI data analysis
- Open the Octet BLI data analysis software.
- Use the data selection tab to locate the experiment and to check the experimental summary. Import the project file from its save location defined during step 4.1.19.
- Input the concentrations of the analyte (here, ColM) by selecting the sensor information for each experiment.
- Assign the tip in E1 as the reference tip.
- Use the processing tab to subtract the reference signal (E1) from the experimental data. Check the raw data from the reference tip for nonspecific analyte binding. If none is observed, proceed.
NOTE: This is an important negative control. If nonspecific binding is observed, this will be accounted for in step 4.2.7. - Align the y-axis to the second baseline step. Do not tick the interstep connection. Select Savitzky-Golay filtering. Select Process Data!.
- In the analysis tab, select the experimental data in the table below the plot to see the association and dissociation curves with the signal from the reference sensor subtracted.
- Select the 1:1 binding model and select a partial curve fit. Select Fit Curves!.
- Analyze the residual view plot to check the curve fitting.
- Scroll through the table to see the calculated Kd.
- Select Save Report… to save a spreadsheet document detailing the setup, plots of the raw and analyzed data, and the calculated dissociation constants.
Results
The membrane receptor FhuA is expressed in a laboratory E. coli strain. The outer membrane fraction is harvested by centrifugation, and proteins are solubilized using a two-step detergent extraction. The solubilized membrane proteins are loaded onto Ni-NTA agarose beads packed in a plastic column, followed by the PeptiQuick workflow as presented in the protocol. After a quality control using size-exclusion chromatography, the Bio-Peptidisc particles are immobilized onto streptavidin-coated pins. The BLI analysis is conducted to measure kinetics of the interactions between FhuA and ColM. The schematic overview of this experiment is presented in Figure 1.
An SDS gel is run to determine the quality of reconstitution after elution of FhuA Bio-Peptidisc particles from the IMAC column (Figure 2). Aliquots of the fractions corresponding to start, flowthrough, washes, and elution fractions are loaded onto the SDS-gel to evaluate the success of the PeptiQuick method. The depletion of FhuA in the flowthrough fraction is correlated with an enrichment in the elution fractions, which indicates that purification of the protein has been effective. Minor contaminant protein bands are observed in the eluted fractions. The SDS gel analysis is used to determine which fractions should be pooled prior to the SEC analysis. A native gel of the eluted FhuA Bio-Peptidisc particles is also run to confirm FhuA solubility (Supplementary Figure 1). Migration of the reconstituted protein into the native gel indicates protein solubility in a detergent-free environment.
The SEC analysis is performed to assess the solubility of the peptidisc particles. The chromatogram presented in Figure 3A shows a single, symmetrical peak eluting at about 14 mL (6 mL past the void volume of 8.0 mL on the gel filtration S200 10/300 column). The position of this peak, past the void volume, confirms the solubility of the FhuA Bio-Peptidisc particles. For reference, Figure 3B illustrates a theoretical suboptimal peptidisc preparation. In this case, the chromatogram shows a larger protein peak eluting at the void volume, indicating the presence of protein aggregates. The smaller peak eluting just past the main peptidisc peak corresponds to excess peptidisc peptides.
The interaction of FhuA with the analyte ColM is determined after attachment of the peptidiscs to streptavidin coated sensors. The sensor tips are first equilibrated in kinetics buffer, then transferred into buffer containing the FhuA Bio-Peptidiscs. The concentration of the FhuA Bio-Peptidiscs and the length of time for which they are incubated with the tip is optimized prior to this experiment (Supplementary Figure 1). Following the loading and washing steps, the association step measures the interactions between the loaded tips and four different concentrations of colicin M. The subsequent movement of the tips back into buffer results in dissociation, which is measured by the wavelength shift of white light reflecting off the tip.
Figure 4A displays the raw data sensorgram output from this experiment. All traces appear uniform in the loading and baseline steps, apart from the reference trace in yellow. The reference tip has no ligand loaded but is exposed to the analyte to assay for nonspecific binding, which is an important negative control. For more detailed analysis of the results, the signal from the reference tip is subtracted from the traces for the experimental tips to account for nonspecific binding. The data are aligned to the start of the association step to allow a direct visual comparison, as shown in Figure 4B. This comparison shows an increase in wavelength shift for increasing concentrations of colicin M. The curve is fit to the data and exhibits a classical 1:1 binding model.
The residual view plot (Figure 4B, bottom), which describes the differences between the fitting and experimental data, shows the fitting for the highest concentration of ColM (28 nM) is poor compared to the three lower concentrations. The profile of the curve itself lacks the binding curve plateau, which is characteristic of binding site saturation in a typical binding experiment. The lack of plateau suggests heterogeneous binding, which is likely an artifact of the high ColM concentration. This highest ColM concentration is therefore discounted from the analysis, and the other three concentrations are used to determine the dissociation constant (Figure 4C,D). A two-tailed student’s t-test, at a 95% confidence level, found that the observed dissociation constant from this experiment is not significantly different from the values obtained using different techniques (Figure 4E)16.
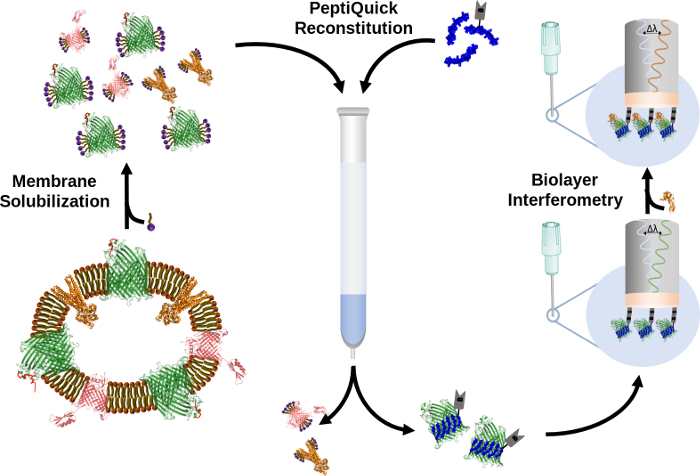
Figure 1: Overview for the PeptiQuick workflow using Bio-Peptidiscs and BLI analysis. Please click here to view a larger version of this figure.
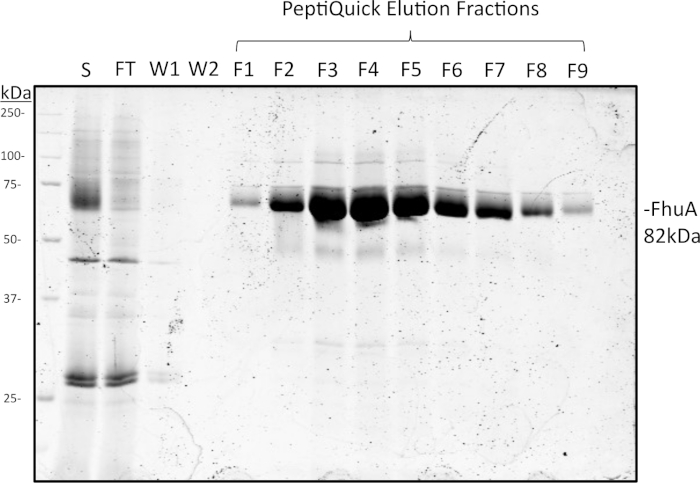
Figure 2: SDS gel analysis (12%) of start, flowthrough, wash, and elution fractions collected through the PeptiQuick workflow. About 10 µL of sample was loaded into each lane and run for 30 min at a constant current of 60 mA. The gel was stained with Coomassie blue, destained, and visualized on a gel scanner. Please click here to view a larger version of this figure.
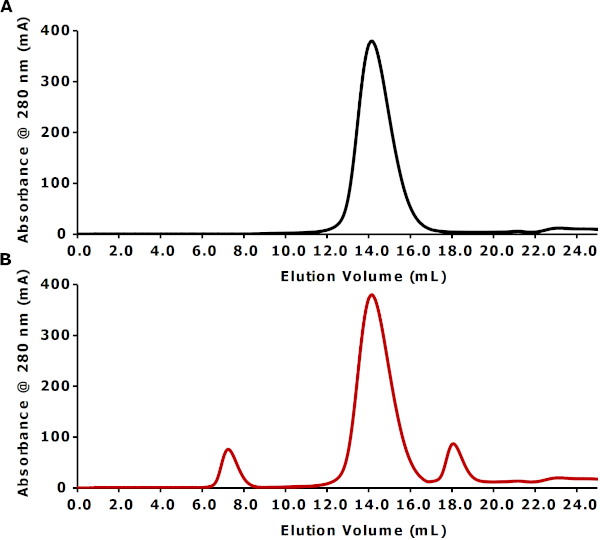
Figure 3: Experimental and theoretical SEC profiles representing optimal and suboptimal reconstitutions, respectively. (A) Experimental SEC profile of PeptiQuick reconstituted FhuA (~82 kDa) in Bio-Peptidiscs. IMAC elution fractions F3−F7 were pooled and concentrated using a 30 kDa cut-off centrifugal concentrator to ~1 mL. This concentrated sample was injected at 0.25 mL/min onto a gel filtration S200 (10/300) column in TSG buffer. (B) Theoretical SEC profile of a suboptimal PeptiQuick reconstitution. Please click here to view a larger version of this figure.

Figure 4: Investigating ColM interactions with FhuA reconstituted in Bio-Peptidiscs. (A) Raw data sensorgram with reference sensor trace in yellow. (B,C) Top: association and dissociation steps with partial 1:1 binding curve fitting. Bottom: residual views depicting the difference between experimental data and computational fitting. (C) Replotting of (B) with the exclusion of the highest concentration of ColM. (D) Observed association and dissociation rates (kon and koff, respectively) and the dissociation constants (Kd). (E) Comparison of FhuA-ColM dissociation constants obtained by peptidisc and BLI (in this experiment), peptidisc and microscale thermophoresis (Saville, unpublished data), and nanodisc and isothermal titration calorimetry16. Error bars represent one SD of uncertainty, while n.s. denotes no significant difference at the 95% confidence level. Please click here to view a larger version of this figure.
| M9 Media (per liter) |
| 200 mL M9 salt |
| 800 mL dH2O |
| 10 mL 40% Glucose |
| 80 µL 1 M CaCl2 |
| 2.5 mL 1 M MgSO4 |
| 300 µL 15 mg/mL Thiamine |
| TSG Buffer |
| 50 mM Tris-HCl, pH 7.8 |
| 50 mM NaCl |
| 10% Glycerol |
| IMAC Wash Buffer |
| 50 mM Tris-HCl, pH 7.8 |
| 50 mM NaCl |
| 10% glycerol |
| 0.04% LDAO |
| 5 mM Imidazole |
| Bio-Peptidisc Solution |
| Dissolve the ready-to-use Bio-Peptidisc (>95% purity) in sterile dH2O. The concentration and volume of the peptide solution depends on the step in the reconstitution process. |
| 50 mM Tris-HCl, pH 7.8 |
| 50 mM NaCl |
| NOTE: This Bio-Peptidisc peptide stock is stable at 4 °C for over a month. |
| IMAC Elution Buffer |
| 50 mM Tris-HCl, pH 7.8 |
| 50 mM NaCl |
| 10% Glycerol |
| 600 mM Imidazole |
| Kinetics Buffer |
| 50 mM Tris-HCl, pH 7.8 |
| 50 mM NaCl |
| 0.002% Tween-20 |
| 0.1% BSA |
Table 1: Recipes for preparation of media and solutions.
Supplementary Figure 1: 4%–16% clear native gel analysis of the elution fractions collected from the PeptiQuick workflow. About 10 µL of sample was loaded into each lane and run for 40 min at a constant current of 30 mA. The gel was stained with Coomassie blue, destained, and visualized on a scanner. Please click here to download this figure.
Supplementary Figure 2: Ligand concentration optimization using a single pin. (A) The six different concentrations of FhuA in Bio-Peptidisc tested for binding to a single streptavidin coated pin. This was set up in a 96 well plate with buffer in the wells between ligand concentrations (see Supplemental File 1 for setup protocol). (B) Raw data sensorgram for the ligand optimization experiment. The pin gives the largest response and additionally reaches saturation at concentration number 4 (or 2.5 µg/mL). Please click here to download this figure.
Supplemental File 1. Please click here to view this file (Right click to download).
Discussion
While detergents remain the simplest method to extract and purify membrane proteins, these surfactants can have many undesired effects on protein stability, function, and downstream analyses1,2,3,4,5,6,7,8,9. These difficulties have motivated the development of membrane mimetics, which strive to minimize the presence of detergents and replicate the native membrane environment as much as possible2,3,4,5,6. The majority of reconstitution methods, however, require significant optimization of the reconstitution conditions and often require additional purification steps, which decrease the final yield7,8. The peptidisc spontaneously adapts to the target membrane protein and comparatively, requires little optimization and downstream purification9,10. In this protocol, PeptiQuick is presented as a simple means to streamline the reconstitution protocol for downstream protein-protein interaction analysis.
Although straightforward, there are several experimental caveats that can lead to unsuccessful reconstitution. Among these, the most common is due to protein aggregation. It is therefore critical to perform size exclusion chromatography to monitor the reconstitution process. For example, a size exclusion peak eluting at the void volume is indicative of protein aggregates (Figure 3B)17,18. Membrane protein aggregates typically form upon prolonged exposure to sub-optimal detergent conditions prior to reconstitution. In particular, it has been found that membrane proteins in detergent tend to form aggregates when concentrated by ultrafiltration on centrifugal devices. In this case, sensitive membrane proteins may be concentrated using vacuum ultra-filtration, a gentler and more homogeneous method of concentration since adsorption of proteins to the filter is diminished.
In general, to avoid protein concentration, the eluted IMAC fractions should be pooled, and an aliquot injected onto a size exclusion column to check its reconstitution quality. It should be noted that unincorporated free peptide elutes just after the main peptidisc peak (Figure 3B). The free scaffold does not necessarily impede downstream experiments. However, if needed, this excess can be removed by the size exclusion chromatography. Alternatively, increasing the wash volume during the reconstitution, and prior to elution from the IMAC resin, is enough to effectively remove most of the free peptidisc peptide. Therefore, size exclusion chromatography is recommended as a quick and simple means to check reconstitution quality.
The BLI experiment requires careful optimization of both ligand and analyte concentrations. Ligand binding must be sufficient to obtain a clear signal, but overloading will cause signal saturation, which results in data artefacts from overcrowding and steric hindrance on the tip surface. Therefore, both the concentration of the ligand and length of time the tip spends in the ligand solution must be optimized for each protein sample (Supplementary Figure 2). The analyte concentration must also be optimized. If the dissociation constant is known, this step becomes easier, since the concentration range can be approximated. A good starting point for this analysis is using protein concentrations between 0.1- and 20-fold the expected Kd19.
Following BLI data acquisition, careful data analysis must be performed to avoid misinterpretation. The calculation of the dissociation constant is dependent on the fit of a binding curve. Unless binding stoichiometry is already known, a classical 1:1 bimolecular interaction model should be used for the initial fitting. It should be noted that a heterogeneous binding curve is often the result of artefacts and non-ideal behaviour caused by high analyte concentration, which can be misinterpreted as a complex binding model. Therefore, lowering the analyte concentration until the sensorgram profile displays 1:1 binding stoichiometry can help differentiate heterogeneous binding from more complex interactions. Any residual heterogeneous binding data is then discounted as shown in Figure 420.
In this report, a dissociation constant of 2.28 ± 0.74 nM for the FhuA-ColM interaction is measured. This value is consistent with the dissociation constant previously determined in our group with nanodisc or peptidisc using ITC or MST, respectively (Figure 4E)16. This consistency provides confidence about the peptidisc reconstitution and BLI analysis as a means to determine interaction kinetics. Importantly, it should be noted that proteins are usually immobilized on streptavidin biosensors either through biotin chemical cross-linking or site-specific addition using the E. coli biotin ligase BirA21. Evidently, biotinylating the peptidisc scaffold, instead of the target membrane protein, has many advantages. Scaffold biotinylation saves time and minimizes the potential to disrupt important protein binding sites. We have also found that PeptiQuick is applicable to a broad range of protein target classes, including G-protein-coupled receptors (GPCRs), ion channels, and β-barrels membrane proteins. In general, it should be noted that the initial detergent extract of membrane proteins into an aggregate-free state is critical, and that immediate reconstitution in peptidisc decreases downstream aggregation problems. Given the simplicity, it is envisioned that PeptiQuick will be extended to other streptavidin-based binding assays, such as surface plasmon resonance (SPR), ELISA assays, and affinity pull-downs using streptavidin beads.
Disclosures
FD is founder of Peptidisc Biotech to distribute peptidisc peptides to the academic community. Peptidisc Biotech is also partnering with industrial biotech and pharma companies to implement peptidisc in their discovery workflows. Open Access publication of this article was sponsored by FortéBio.
Acknowledgements
We thank the Natural Sciences and Engineering Research Council of Canada. JS holds a CGS-M CIHR scholarship. LT was supported by the Biotechnology and Biological Sciences Research Council-funded South West Biosciences Doctoral Training Partnership [training grant reference BB/M009122/1]. FD is a Tier II Canada Research Chair.
Materials
| Name | Company | Catalog Number | Comments |
|---|---|---|---|
| 30 kDa cut-off centrifugal concentrator | Millipore Sigma | C7715 | - |
| Ampicillin | BioShop | 69-52-3 | Sodium Salt |
| Bio-Peptidisc Peptide | Peptidisc Biotech | https://peptidisc.com | - |
| Bovine Serum Albumin (BSA) | Sigma | 9048-46-8 | Lyophilized powder |
| CaCl2 | Fisher Chemical | 10035-04-8 | Certified ACS |
| EDTA | BioShop | 6381-92-6 | Biotechnology Grade |
| Ettan LC (AKTA) | Amersham Pharmacia Biotech | 18-1145-58 | - |
| Glucose | BioShop | 50-99-7 | Anhydrous, Reagent Grade |
| Glycerol | Fisher Chemical | 56-81-5 | Certified ACS |
| Imidazole | BioShop | 288-32-4 | Biotechnology Grade |
| Lauryldimethylamine oxide (LDAO) | Sigma | 101822204 | ~30% in H2O |
| MgSO4 | Fisher Chemical | 10034-99-8 | Certified ACS |
| Microfluidizer | Microfluidics | M-110L | Fit with F20Y 75µ diruption chamber |
| Ni-NTA Resin | Gold Biotechnology | H-320-50 | - |
| Non-binding 96well BLI Plate | Greiner Bio-one | 655076 | Microplate, PS, 96 well, F-Bottom (chimney well), Black, Fluotrac, Med. Binding |
| Octet Red96 | FortéBio | OCTET RED96E-GxP | Octet RED96e instrument, Octet CFR software, desktop computer, LC monitor, accessory kit, IQ/OQ kit, PQ Kits and one-year warranty |
| Phenylmethanesulfonylfluoride (PMSF) | Sigma | P-7626 | - |
| Protein Assay Dye - Reagent Concentrate | Bio-Rad | 5000006 | Used in the bradford assay to determine protein concentration - 5x concentration |
| Sodium Chloride (NaCl) | BioShop | 7647-14-5 | Biotechnology Grade |
| Streptavidin (SA) Biosensors | ForteBio | 18-5019 | One tray of 96 biosensors coated with streptavidin for quantitation, screening, or kinetic applications. |
| Superdex S200 (300/10) | Amersham Pharmacia Biotech | 175175-01 | - |
| Thiamine | Merck | 69271 | - |
| Tris-HCl | BioShop | 77-86-1 | Reagent Grade |
| Triton X-100 | BioShop | 900998-1 | Biotechnology Grade |
| Tween-20 | BioShop | 56-40-6 | Reagent Grade |
| Ultra centrifuge | Beckman Coulter | 365668 | - |
References
- Rawlings, A. E. Membrane proteins: always an insoluble problem. Biochemical Society Transactions. 44 (3), 790-795 (2016).
- Popot, J. L. Amphipols, Nanodiscs, and Fluorinated Surfactants: Three Non Conventional Approaches to Studying Membrane Proteins in Aqueous Solutions. Annual Review of Biochemistry. 79, 737-775 (2010).
- Lee, S. C., et al. A Method for Detergent-Free Isolation of Membrane Proteins in their Local Lipid Environment. Nature Protocols. 11, 1149-1162 (2016).
- Frauenfeld, J., et al. A Saposin-Lipoprotein Nanoparticle System for Membrane Proteins. Nature Methods. 13, 345-351 (2016).
- Bayburt, T. H., Grinkova, Y. V., Sligar, S. G. Assembly of Single Bacteriorhodopsin Trimers in Bilayer Nanodiscs. Archives of Biochemistry and Biophysics. 450, 215-222 (2006).
- Denisov, I. G., Grinkova, Y. V., Lazarides, A. A., Sligar, S. G. Directed Self-Assembly of Monodisperse Phospholipid Bilayer Nanodiscs with Controlled Size. Journal of the American Chemical Society. 126, 3477-3487 (2004).
- Denisov, I. G., Sligar, S. G. Nanodiscs for Structural and Functional Studies of Membrane Proteins. Nature Structural, Molecular Biology. 23, 481-486 (2016).
- Hagn, F., Etzkorn, M., Raschle, T., Wagner, G. Optimized Phospholipid Bilayer Nanodiscs Facilitate High-Resolution Structure Determination of Membrane Proteins. Journal of the American Chemical Society. 135, 1919-1925 (2013).
- Carlson, M. L., et al. The Peptidisc, A Simple Method for Stabilizing Membrane Proteins in Detergent-Free Solution. eLife. 7, 34085(2018).
- Carlson, M. L., et al. Profiling the E. coli Membrane Interactome Captured in Peptidisc Libraries. eLife. 8, 46615(2019).
- Serdakowski, A., et al. A novel method to determine residual detergent in biological samples post endotoxin reduction treatment and evaluation of strategies for subsequent detergent removal. International Immunopharmacology. 37, 16-22 (2016).
- Smith, S. M. Strategies for the Purification of Membrane Proteins. Protein Chromatography. 681, 485-496 (2011).
- Lin, S. H., Guidotti, G. Purification of Membrane Proteins. Methods in Enzymology. 463, 619-629 (2009).
- Wolfe, A. J., Gugel, J. F., Chen, M., Movileanu, L. Kinetics of Membrane Protein-Detergent Interactions Depend on Protein Electrostatics. Journal of Physical Chemistry B. 122 (41), 9471-9481 (2018).
- Montigny, C., et al. Slow Phospholipid Exchange between a Detergent-Solubilized Membrane Protein and Lipid-Detergent Mixed Micelles: Brominated Phospholipids as Tools to Follow Its Kinetics. PLoS ONE. 12 (1), 0170481(2017).
- Mills, A. T., Le H, T., Coulton, J. W., Duong, F. FhuA Interactions in a Detergent-Free Nanodisc Environment. Biochimica et Biophysica Acta - Biomembranes. 1838 (1), 364-371 (2014).
- Hong, P., Koza, S., Bouvier, E. S. P. Size-Exclusion Chromatography for the Analysis of Protein Biotherapeutics and their Aggregates. Journal of Liquid Chromatography Related Technologies. 35 (20), 2923-2950 (2012).
- Mahler, H. C., Friess, W., Grauschopf, U., Kiese, S. Protein aggregation: Pathways, induction factors and analysis. Journal of Pharmaceutical Sciences. 98 (9), 2909-2934 (2009).
- FortéBio. Octet System Data Acquisition User Guide, Release 7.1. . , Available from: http://www.biophysics.bioc.cam.ac.uk/wp-content/uploads/2014/01/Data-Acquisition-Octet.pdf (2014).
- FortéBio. Octet System Data Analysis User Guide, Release 7.1. . , Available from: http://www.biophysics.bioc.cam.ac.uk/wp-content/uploads/2011/02/Data-Analysis-Octet.pdf (2011).
- Trinkle-Mulcahy, L. Recent advances in proximity-based labeling methods for interactome mapping. F1000Research. 8, 135(2019).
Reprints and Permissions
