A protocol is presented combining tissue clearing with light sheet fluorescence microscopy (LSFM) to obtain three-dimensional and cellular resolution images of the lymphatic vessels and lymph nodes (LNs) collecting the cerebrospinal fluid (CSF) and spinal epidural fluid.
Method Article
Three-Dimensional Imaging of the Vertebral Lymphatic Vasculature and Drainage using iDISCO+ and Light Sheet Fluorescence Microscopy
* These authors contributed equally
In This Article
Summary
Abstract
The lymphatic system associated with the central nervous system (CNS) includes the lymphatic vasculature that spins around the brain, the spinal cord, and its associated LNs. The CNS-associated lymphatic system is involved in the drainage of CSF macromolecules and meningeal immune cells toward CNS-draining LNs, thereby regulating waste clearance and immune surveillance within CNS tissues. Presented is a novel approach to obtain three-dimensional (3D) and cellular resolution images of CNS-associated lymphatics while preserving the integrity of their circuits within surrounding tissues. The iDISCO+ protocol is used to immunolabel lymphatic vessels in decalcified and cleared whole mount preparations of the vertebral column that are subsequently imaged with light sheet fluorescence microscopy (LSFM). The technique reveals the 3D structure of the lymphatic network connecting the meningeal and epidural spaces around the spinal cord to extravertebral lymphatic vessels. Provided are 3D images of the drainage circuits of molecular tracers previously injected into either the CSF via the cisterna magna or the thoracolumbar spinal parenchyma. The iDISCO+/LSFM approach brings unprecedented opportunities to explore the structure and function of the CNS-associated lymphatic system in neurovascular biology, neuroimmunology, brain and vertebral cancer, or vertebral bone and joint biology.
Introduction
The CNS is surrounded by the CSF and overlaying layers of meninges, epidural tissue, and bones. Altogether, the CSF provides physical protection to the soft brain and spinal cord. It is mainly secreted by the choroid plexus and the meningeal membranes (i.e., the pia mater, the arachnoid, and the dura mater). The CSF-meningeal complex also establishes a functional interface between the CNS tissues and the rest of the body, thereby contributing to CNS homeostasis. First, the CSF penetrates the CNS parenchyma through the CNS para-arterial spaces and interacts dynamically with the interstitial fluid (ISF)1 via the glymphatic (glia-lymphatic) system, which consists of the paravascular spaces and the astrocyte end-feet membranes around the CNS vessels2,3,4. Metabolic waste and excess fluid are then ultimately cleared by intramural perivascular drainage directly from the brain parenchyma toward the systemic circulation3, as well as the paravenous spaces toward the CSF and via brain-draining lymphatic vessels, according to the glymphatic model2,4. CSF outflow is mainly via the lymphatic system, through the cribriform plate and associated extracranial lymphatic vessels5,6,7, as well as by the meningeal lymphatic vessels, which converge at the brain-draining LNs8,9,10,11,12 (Figure 1). An important, although secondary, role in CSF outflow is taken by the cranial arachnoid villi, which penetrate the lacuna of meningeal venous sinuses13.
The CFS drainage circuits have been extensively investigated through experimental approaches based on the injection of colored/fluorescent tracers into the CNS or CSF, followed by the imaging of the tracers’ pattern inside the CNS and throughout the body organs and tissues at different timepoints after injection13. For a long time, the outflow of CSF was considered to be exclusively and directly taken in charge by the blood circulation, through arachnoid villi projecting into dural venous sinuses13. However, the CSF outflow is predominantly performed by the lymphatic vasculature, as recently shown by near-infrared (NIR) dynamic imaging of CSF-injected tracer transport in mice9,10. The CSF-draining lymphatic vessels then return lymph to the bloodstream via the right subclavian vein. Complementary approches have detected both extracranial6,7,13 and intracranial9,10,11,12 lymphatic exits of CSF-injected tracers and suggest that the CSF is absorbed by two lymphatic pathways, one external and the other one internal to the skull and vertebral column. The main part of CSF drainage rapidly occurs through lymphatic vessels located rostrally, outside of the skull in the nasal mucosa, through channels of the cribriform plate of the ethmoid bone3,6,13 and, caudally, outside of lumbosacral vertebral bones through dorsolateral routes that are not yet fully characterized7,14. In addition, in the meninges of the skull, lymphatic capillaries of the dura mater directy absorb CSF and meningeal immune cells toward dural lymphatic collectors that cross the skull bones and connect to CNS-draining LNs12,14. These meningeal lymphatic vessels play important roles in CNS pathophysiology, because brain meningeal lymphatics are altered upon aging and also impact the outcome of neurological brain diseases, including neurodegeneration, neuroinflammation, and brain cancer15,16,17. Therefore, the CNS-associated lymphatic vasculature (i.e., the dural and peripheral lymphatic vessels draining the CSF) may be a promising novel target to combat CNS diseases in humans.
Convergent studies performed with immunohistology and high-resolution magnetic resonance imaging demonstrated that the meningeal lymphatic vasculature also exists in primates, including common marmoset monkeys and humans7,11,13. Moreover, meningeal lymphatic vessels are not restricted to the skull, but extend within the vertebral column to the surface of spinal ganglia and rami13,18. Three-dimensional (3D) imaging of the vertebral column lymphatics preserving the overall anatomy of labeled vertebral and spinal samples, including overlying bones, muscles, ligaments, as well as neighboring visceral tissues, was recently performed14. The iDISCO+ protocol19,20 was used to immunolabel decalcified and cleared preparations of the whole vertebral column with lymphatic-specific antibodies against either the membrane receptor LYVE121 or the transcription factor PROX122. Image acquisition and analysis were then carried out with light sheet fluorescence microscopy (LSFM) and the Imaris software. LSFM allows for rapid and minimally invasive 3D imaging of large specimens by axial confinement of illumination, which results in reduced photobleaching and phototoxicity23.
The iDISCO+/LSFM approach allows characterization of the distinct layers of dural and epidural lymphatic vessels, and the connection of this vasculature to the extravertebral lymphatic circuits and the LNs neighboring the vertebral column. The protocol was applied to tissues previously injected with fluorescent tracers to demonstrate vertebral canal drainage. The present paper provides details on the iDISCO+/LSFM methodology to image the vertebral lymphatic vasculature and illustrates its relevance to CSF and epidural fluid drainage investigation.
Protocol
All in vivo procedures used in this study complied with all relevant ethical regulations for animal testing and research, in accordance to the European Community for experimental animal use guidelines (L358-86/609EEC). The study received ethical approval by the Ethical Committee of INSERM (n°2016110111126651) and the Institutional Animal Care and Use Committee of ICM (Institut du Cerveau et de la Moelle épinière).
1. Preparation
- Prepare the following dissection tools for surgery: scalpel (1), microforceps (2), forceps (1), dissection scissors, and Michel suture clips. Prepare 26 G needles (0.45 mm x 13 mm), 1 mL syringe, and 10 µL microsyringe.
- Pull microcapillaries with a single-step protocol at 67.5 °C with a glass micropipette puller. Prepare two microcapillaries per injection.
- Prepare reagents for imaging lymphatic drainage (Table 1): Ovalbumin Alexa Fluor 555 conjugate (OVA-A555, 2 mg/mL in 1x phosphate buffered saline [PBS]) and anti-LYVE1 antibody (1 mg/mL in 1x PBS).
- Prepare antibodies (Table 1) for iDISCO+. For primary antibodies, use anti-LYVE1 rabbit polyclonal antibody (1:1,600) and anti-PROX1 goat polyclonal IgG antibody (1:2,000). For secondary antibodies, use Alexa Fluor donkey anti-rabbit-568, donkey anti-rabbit-647, and donkey anti-goat-647 (1:2,000).
2. Surgery procedures for intra-cisterna magna (ICM) and thoracolumbar (ThLb) injections
- Preparation of the animal for surgery
- Use adult male and female C57BL6/J mice, 8–12-weeks-old.
- Inject the mouse intraperitoneally (IP) with 0.015 mg/mL buprenorphine solution diluted in 0.9% sodium chloride at 0.1 mg/kg, 15 min before surgery.
- Anesthetize the mouse in an induction box with 2–3% isoflurane gas.
- Preparation of anesthetized animal for tracer injection
- Place the anesthetized mouse and its heating pad on the stereotaxic apparatus. Use ear bars to hold the mouse's head, and lay down the body at a ~135° angle to the head or immobilize the spinal cord at the ThLb vertebral level (Th12-L1) with a spinal adaptor. Pinch the tail or the paw with the forcep to check the efficiency of anesthesia.
- Inject IP 200 µL of 0.9% sodium chloride for mouse hydration.
- Using a scalpel blade, make a skin incision, either in the occipital region toward the cervical region for ICM injection, or at the ThLb vertebral level (Th10-L3) for injection into the ThLb spinal parenchyma.
- Tracer injection
- Discard paracervical and paraspinal muscles covering the neck and the column to visualize the surface of the dura mater, the outermost layer of the meninges.
- Carefully punctate the central area of the dura mater and underlaying arachnoid with a 26 G needle.
- Microcapillary implantation
- Cut 2 mm of the glass capillary tip (see step 1.2), then use the microcapillary connected to a cannula linked to a 10 µL syringe to aspirate 2−8 µL of the OVA-A555 or LYVE1 antibody.
- Introduce the microcapillary in the medial region of the dura mater at a 30° angle for ICM injections or 10° angle for ThLb spinal injections, and push it in to 1.5 mm below the dura mater.
NOTE: The ligament is punctured, but no laminectomy is performed. - Add 10 µL of surgical glue to close the incision around the glass capillary and wait for it to dry.
- Slowly inject the fluorescent tracer at 1 µL/min. Once the injection volume has been delivered, maintain the capillary in place for 1 min. Retract the microcapillary and add surgical glue to close the injection hole.
- Postinjection, close the skin incisions with suture clips. Remove the mouse from the stereotaxic apparatus and place it in a postsurgery warming chamber at 37 °C until it recovers.
3. Perfusion and tissue dissection
- At either 15 min or 45 min after CSF tracer injection, inject IP a lethal dose (100 µL) of sodium pentobarbital. Pinch the tail or the paw to verify that there is no reflex.
- With dissection scissors, cut the skin and open the peritoneal layer from the lower abdomen region toward the thoracic cage. Open the thoracic cage with scissors to have access to the heart.
- Insert the 26 G needle in the left ventricule of the heart and start to perfuse with 20 mL of ice-cold 4% paraformaldehyde (PFA) in 1x PBS at 2 mL/min. Use scissors to rapidly cut the right atrium and release the perfusion fluid stream.
- Completely remove the skin with forceps and cut the four legs with scissors. Remove all the internal organs but be careful to preserve the LNs intact.
NOTE: Mandibular LNs are superficial, so take care to not remove them when cutting off the skin. Deep-cervical LNs (dcLNs) are located on each side of the trachea, in contact with the lateral surface of the internal jugular veins and close to the stereomastoid muscles. - Cut the ribs to remove the vertebral column with the spinal cord inside from the cervical to the lumbar segments.
- Immerse the dissected tissues in ice-cold 4% PFA in 1x PBS in a 50 mL tube overnight (~18 h) at 4 °C. Wash the fixed tissues 3x in 50 mL of 1x PBS for 5 min.
4. Fluorescence macroscopy of a vertebral segment
- Position the sample under the fluorescence stereozoom microscope with a camera (Table of Materials). Take an overview of the sample or zoom on a specific region.
5. Sample preparation for whole mount immunostaining
- Using a microtome blade, transversally cut the head-and-vertebral column at the occipital and cervical levels.
NOTE: This dissection allows isolation of the head and the cervical vertebral region from the rest of the vertebral column. - With a microtome blade, cut the cervical, thoracolumbar, and sacral regions of the vertebral column transversally into segments of 2−4 vertebrae, about 0.5 cm size each.
- Isolate each segment in the order it was separated from the vertebral axis, along the entire length of the cervical and thoracic regions of the vertebral column. Preserve each sample in a tube of 2 mL 1x PBS.
6. iDISCO+ whole mount immunostaining of a vertebral segment
NOTE: The detailed description of the iDISCO+ protocol is accessible at http://www.idisco.info.
- Day 1: Tissue dehydration
- Dehydrate vertebral tissue samples (i.e., a vertebral segment) by successive immersion in 20%, 40%, 60%, 80%, and 100% methanol in 1x PBS for 1 h with agitation.
- Incubate the samples overnight in a solution of 33% methanol/66% dichloromethane (DCM) at room temperature (RT) with agitation.
- Day 2: Tissue bleaching
- Wash samples 2x with 100% methanol for 1 h at RT. Incubate the samples in 5% H2O2 in methanol (30% H2O2 and methanol 1:5 v/v) at 4 °C overnight.
- Day 3: Decalcification and permeabilization step
- Rehydrate the samples gradually in 80%, 60%, 40%, 20% methanol, then in 1x PBS (1 h in each solution) at RT with agitation.
- Decalcify the vertebrae by incubating samples in Morse’s solution (10% trisodium citrate and 45% formic acid 1:1 v/v) for 30 min at RT to preserve the bone structure.
- Rinse the samples 2x with 1x PBS and incubate 2x for 1 h in PTx2 solution (0.2% Triton X-100 in 1x PBS, renew for the second incubation) at RT with agitation. Then incubate the pretreated samples in permeabilization solution (PTx2 with 20% dimethyl sulfoxide [DMSO] and 2.3% w/v glycine) at 37 °C for 24 h.
- Day 4: Blocking step
- Incubate samples in blocking solution (PTx2 with 6% donkey serum and 10% DMSO) at 37 °C for 24 h.
- Days 5−16: Whole mount immunolabeling
- Incubate samples in primary antibody diluted in PTwH (1x PBS containing 0.2% Tween-20 and 0.1% heparin at 10 mg/mL in 1x PBS) with 5% DMSO/3% donkey serum at 37 °C for 6 days. Wash samples 4−5x in PTwH at RT with agitation overnight.
- Incubate samples in secondary antibody dilutions in PTwH with 3% donkey serum at 37 °C for 4 days. Wash samples in PTwH 4−5x at RT under agitation overnight before clearing.
- Days 17 and 18: iDISCO+ tissue clearing
- Dehydrate samples gradually by successive immersion in 1x PBS, then 20%, 40%, 60%, 80%, and 2x in 100% methanol (1 h in each solution). Incubate each sample overnight in a solution of 33% methanol/66% DCM.
- Wash 2x in 100% DCM for 15 min to remove the methanol. Incubate in dibenzyl ether (DBE) without shaking until cleared (4 h) and then store in DBE at RT before imaging.
7. LSFM imaging
- Image cleared samples in a transversal plane with the LSFM equipped with a 4x/0.3 objective.
- Use a single sided three sheet illumination configuration, fixed x position (no dynamic focusing). Use LED lasers tuned to 561 nm, 100 mW; and 639 nm, 70 mW. Set the light sheet numerical aperture to 30%.
- Use different emission filters: 595/40 for Alexa Fluor-568 or -555, and -680/30 for Alexa Fluor-647.
- Fill the microscope chamber with DBE.
- Aquire stacks with 2.5 μm z steps and a 30 ms exposure time per step with the camera (Table of Materials). Use the x2 optical zoom for an effective magnification of (x8), 0.8 µm/pixel, and perform the mosaic acquisitions with a 10% overlap on the full frame.
- Acquire images in .tif format with acquisition software and convert them into 3D format with a file conversion software.
- Reconstruct mosaics aquisition with stitcher software (Table of Materials). Open the images and move manually to reconstitute the whole mosaic picture, using the 10% overlap between images as a guideline.
- Use the 3D software (Table of Materials) to generate orthogonal projections of data, as shown in Figure 1, Figure 2, Figure 3, and Figure 4, and add a color code attribute to the lymphatic vessels and the other anatomical structures on display. Set a gamma correction of 1.47 to the raw data obtained from the LSFM according to the manufacturer’s instructions.
Results
3D imaging of the vertebral lymphatic vasculature
Figure 1 presents the steps of the iDISCO+/LSFM procedure and a LSFM image of lymphatic circuits inside the vertebral canal of iDISCO+-treated ThLb vertebrae. The combination of iDISCO+ with LSFM preserved the vertebral anatomy and captured a view of the lymphatic vascular network (i.e., the intravertebral vessels connected with the extravertebral vessels exiting dorsally and laterally from the vertebral body) within the surrounding bones, ligaments, muscles, and nerve ganglia.
Fluorescence macroscopy imaging of dcLN drainage
In order to image macromolecule drainage in the CNS-associated lymphatic system, macromolecular tracers were administrated in vivo by injection into either the CSF or the spinal parenchyma. A macromolecular tracer can be easily delivered into the CSF at the cisterna magna. The cisterna magna is located between the cerebellum and the dorsal surface of the medulla oblongata, above the foramen magnum. Macromolecular tracer can also be injected into the spinal parenchyma by stereotactic surgery at different levels along the vertebral column.
The macromolecular tracers used were either directly labeled with a fluorophore or detected postmortem by immunohistochemistry with specific antibodies. Figure 2A illustrates the experimental plan for tracking OVA-A555, a red fluorescent and small molecular weight tracer (around 45 kDa), that was injected into either the CSF (Figure 2B) or the ThLb region of the spinal cord (Figure 2C).
At 45 min after the macromolecular tracer injection, the mice were sacrificed, perfused with 4% PFA, and processed to isolate dissected segments of the brain stem region of the head and the vertebral column that were decalcified and clarified. Macromolecule drainage was then readily assessed by fluorescence macroscopy imaging of the LNs that collect the CSF and epidural fluids. As shown in Figure 2, OVA-A555 injection into either the CSF (Figure 2B) or the ThLb (Figure 2C) region of the spinal cord resulted in OVA-A555 accumulation into the dcLNs at 45 min after injection. This observation indicates the uptake and drainage of fluorescent tracer by the lymphatic system; it is a prerequisite before pursuing the iDISCO+/LSFM procedure to image the vertebral lymphatic drainage.
3D imaging of macromolecule drainage in the vertebral lymphatic system
Based on the detection of OVA-A555 labeling in dcLNs, the iDISCO+/LSFM procedure could be applied to decalcified and precleared vertebral samples isolated from OVA-A555-injected mice. This approach allowed the creation of a 3D map of the lymphatic drainage of CSF and spinal epidural fluid at a specific time point after tracer injection. This 3D mapping could be performed by imaging successive CNS segments, at each level of vertebral column, from the injection point.
Figure 3A shows the experimental design for OVA-A555 injection into the ThLb spinal parenchyma and the resulting 3D pattern of OVA-A555 distribution in a cervical and a thoracic vertebral segment, in conjunction with the lymphatic vasculature. At 45 min after OVA-A555 injection, OVA-A555 accumulation was detected in spinal cord tissues and dcLNs (white arrows in Figure 3B), in agreement with microscope observations illustrated in Figure 2. It was not detected, however, in the cervical and thoracic lymphatic vasculature labeled with anti-LYVE1 antibodies. The absence of CSF-injected tracer in the vertebral lymphatic vessels may be due to either a short persistence time of tracer inside lymphatic vessels or a lack of uptake of the tracer by the lymphatic vessels (Figure 3C).
To test the first hypothesis, the rabbit anti-LYVE1 antibody was used as a lymphatic endothelial cell tag to bind CNS-associated lymphatic vessels. The injected rabbit anti-LYVE1 antibody was thereafter detected by immunohistochemistry with an anti-rabbit secondary antibody, while lymphatic endothelial cells were immunolabeled with anti-PROX1 antibodies. Figure 4 represents the experimental design of anti-LYVE1 injection into the ThLb spinal parenchyma (Figure 4A), and the resulting 3D distribution pattern of LYVE1 antibodies in a ThLb segment close to the injection site, with respect to PROX1+ lymphatics (Figure 4B). Both vertebral lymphatics and their extravertebral lymphatic connections were labeled by injected anti-LYVE1 antibodies, which substantiated the tracer uptake by vertebral lymphatic vessels and the lymphatic drainage toward the extravertebral lymphatic system. LNs were lacking in the ThLb region and, thus, could not be visualized in the imaged segment. Furthermore, the discontinuous pattern of LYVE1 marker observed along lymphatic vessels likely reflected the discontinuous expression of LYVE1 in the lymphatic vasculature, as reported in previous studies14,21. Altogether, the results of the present study demonstrated that, at 45 min after tracer injection, LYVE1 antibody, but not OVA-A555, allowed detection of local vertebral lymphatic uptake and was preferrable to OVA-A555 as a persistent marker of local vertebral lymphatic drainage.
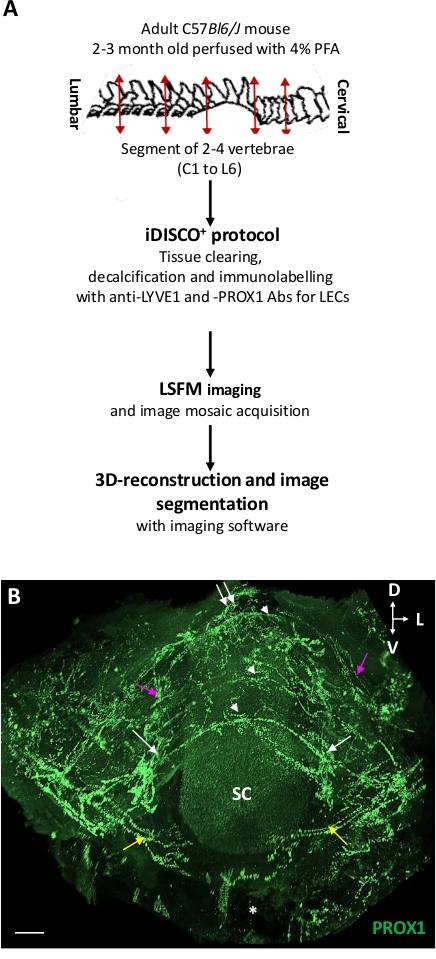
Figure 1: Three-dimensional view of the vertebral lymphatic vasculature. (A) Schematic representation of the protocol. (B) Planar projection of a 3D view of the ThLb vertebral lymphatic vasculature from a dorsofrontal perspective. Lymphatic vessels were immunolabeled with the anti-PROX1 antibody (green) using the iDISCO+ protocol and then imaged by LSFM. Note the metameric-like pattern of the vasculature within the vertebral canal of three successive vertebrae (white arrowheads). In addition to semicircular dorsal vessels (white arrowheads), each vertebral network included ventral branches (yellow arrows), bilateral lateral exit pathways along the spinal rami and ganglia (white arrows), as well as a dorsal exit route at the midline (white double arrow). Vertebral networks were interconnected with a longitudinal vessel (purple arrows). For a complete description, see Jacob L. et al.18 SC = spinal cord; Asterisk = ventral vertebral body; D = dorsal; L = lateral; V = ventral; Scale bars = 300 µm. Please click here to view a larger version of this figure.

Figure 2: dcLNs collected OVA-A555-labeled CSF Fluids. (A) Scheme of the experimental design. OVA-A555 was injected into either the ICM or the ThLb spinal parenchyma, then mice were sacrificed 45 min after injection. The samples were cleared and observed by fluorescence macroscope imaging (B,C). Fluorescence macroscope images of cervival vertebrae from ICM- (B) and ThLb- (C) injected mice. Note that OVA-A555 accumulated in the dcLNs (B,C, white arrowheads), the pial and paravascular spaces of the cervical spinal cord (B,C) and after ICM injection, in ventrolateral exit routes, likely along cervical nerves (B, white arrows). SC = spinal cord. Asterisk = ventral vertebral body; D = dorsal; L = lateral; V = ventral; Scale bars in B and C = 2 mm. Please click here to view a larger version of this figure.
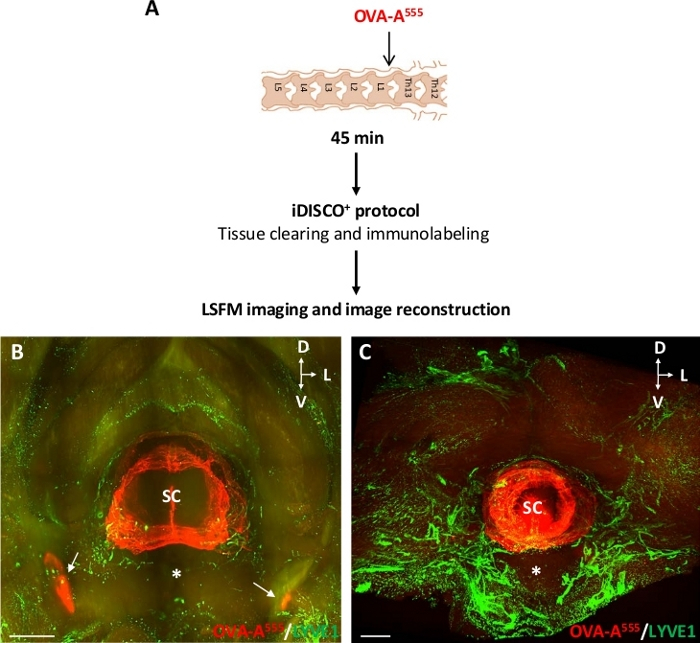
Figure 3: Detection of OVA-A555-labeled CSF fluids in the vertebral lymphatic system. (A) Scheme of the experimental design. OVA-A555 was injected into the ThLb spinal parenchyma, then mice were sacrificed at 45 min after injection. The samples were treated with the iDISCO+ protocol and imaged with a LSFM. (B,C) Planar projections of LSFM-captured frontal 3D views of cervical (B) and thoracic (C) spine segments. OVA-A555 accumulation (red) was detected in spinal cord tissues and dcLNs (B, white arrow), as illustrated in Figure 2, but not in the cervical and thoracic lymphatic vasculature immunolabeled here with anti-LYVE1 antibodies (green). SC = spinal cord; Asterisk = ventral vertebral body; D = dorsal; L = lateral; V = ventral; Scale bars = 1 mm (B), 300 µm (C). Please click here to view a larger version of this figure.
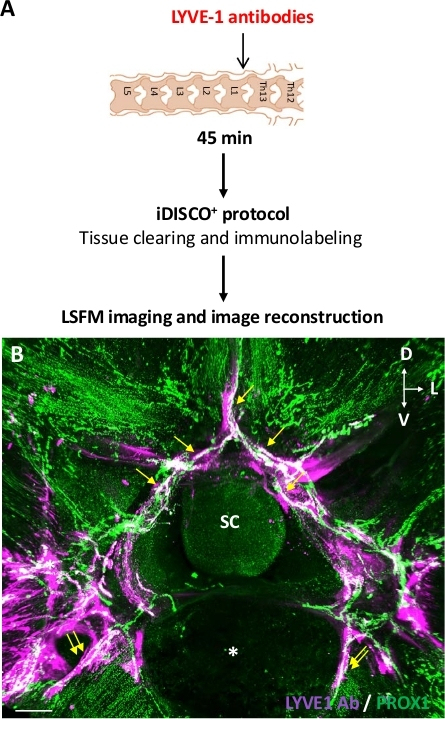
Figure 4: Detection of vertebral lymphatic drainage after intraspinal injection of anti-LYVE1 antibodies. (A) Scheme of the experimental design. Anti-LYVE1 antibodies were injected into the ThLb spinal parenchyma, then mice were sacrificed 45 min after injection. The samples were treated with the iDISCO+ protocol and imaged with a LSFM. (B). Planar projections of frontal 3D views of a ThLb (B) spine segment, captured with a LSFM. Anti-LYVE1 antibodies were detected with anti-rabbit antibodies (purple) and the lymphatic vasculature with anti-PROX1 antibodies (green). White vessels are PROX1+ lymphatics colabeled with anti-LYVE1 antibodies (B); these include vertebral (yellow arrows) and extravertebral (double yellow arrows) lymphatics. SC = spinal cord; Asterisk = ventral vertebral body; D = dorsal; L = lateral; V = ventral; Scale bars = 300 µm (B). Please click here to view a larger version of this figure.
| Reagents | Target | Figure | Protocol step | Comment |
| OVA-A555 | CSF tracer | Figure 2 and Figure 3 | 2. ICM or ThLb injection 7. LSFM imaging. | Water soluble, easy to inject and high intense fluorescence |
| Anti-Lyve1 antibody | Membrane marker of LVs cells | Figure 3 | 6. iDISCO+ whole mount immnunostaining. 7. LSFM imaging. | Efficient antibody to whole mount immnunostaining |
| Tracer drainage of the dural and epidural LVs | Figure 4 | 2. ICM or ThLb injection 6. iDISCO+ whole mount immnunostaining 7. LSFM imaging | ||
| Anti-Prox1 antibody | Nuclear marker of LVs cells | Figure 1 and Figure 4 | 6. iDISCO+ whole mount immnunostaining 7. LSFM imaging | Efficient antibody to whole mount immnunostaining |
Table 1: Antibodies and tracers used in the study.
| Problem | Possible reason | Solution | |
| Surgery for tracer injection | Unwanted CNS tissue lesion | 1. Lack of control of glass capillary insertion 2. Incorrect depth of glass capillary insertion | 1. Punctate with care, but fully, the dura mater with a 26 G needle before glass capillary insertion. 2. Reduce the deepness of glass capillary insertion (<1.5 mm from the dura mater). 3. Reduce the glass capillary diameter. |
| Unwanted defilement of injected tracer into the epidural or extra-vertebral spaces | Incorrect injection of tracer | 1. Check if the glass micro capillary has been well inserted into the punctate the dura mater. 2. Add surgical glue between glass microcapillary and the surrounded tissue before injecting tracer. | |
| Excessive volume of injected tracer | Reduce the volume of injected tracer (<2 µL). | ||
| iDISCO+ immunostaining | Absence, heterogeneity or excessive background of labeling in the tissue | 1. Issues with the concentration of the primary antibody 2. Insufficient permeabilization 3. Insufficient washing 4. Insufficient clearing | Increase the number and/or the time of incubation steps: permebilization, whashing, primary antibody and clearing. See http://www.idisco.info (FAQ AND TROUBLESHOOTING). |
| Insufficient decalcification | Use a more stringent decalcification treatment of sample with EDTA21 or Morse solution for head tissues especially. | ||
| iDISCO+ clearing | Samples are opaque or brown-colored | Insufficient bleaching | Use fresh H2O2 solution, increase volume and/or incubation time. |
| Presence of oxidation | Fill the tube completely to avoid the presence of air. | ||
| Insufficient clearing | Increase volume and/or incubation time. See http://www.idisco.info (FAQ AND TROUBLESHOOTING). | ||
| Tracer detection | Undetectable tracer | Incorrect combination of the selected tracer | Alexa 555, 594 and 647 fluorochromes are resistant to iDISCO+ protocol5,6,7,8,9,10. However, this is not the case for FITC, GFP, RFP fluorochromes. |
| Sacrifice timepoint after injection | Prefer OVA-A555 for short-term (15 min) drainage analysis in local vertebral lymphatics. For lymph nodes drainage analysis, OVA-A555 and Lyve1 antibody can be used for longer term (>45 min) analysis. | ||
| Imaging: capture and analysis | Captured images of the lymphatic circuit are not satisfactory | Dissection issue (lymph nodes are missing) | Include carefully the vertebral/skull neighboring tissues in your dissected sample, according to the lymphatic circuit that you want to image. |
| Imaging issue | 1. Modify the acquisition parameters of the LSFM: laser intensity, light-sheet numerical aperture, thickness of light-sheet, exposition time. 2. Place the sample in the support to reduce the path travelled by light through the tissue until the objective. 3. Be sure that there are no bubbles inside the tissue sample during acquisition. |
Table 2: Troubleshooting advice for each step of the protocol, including possible issues and solutions.
Discussion
The iDISCO+/LSFM protocol provides unprecedented 3D views of the CNS-associated lymphatic network within its surrounding tissues at a cellular resolution level. This protocol is well adapted to medium size samples, not exeeding 1.5 cm3, due to the limitations of the LSFM optical system, the reduced working distance, and the large size of commercial objective lenses for high-resolution microscopy23. This limitation prevents capturing the whole brain-associated lymphatic system. It is important to note that the area of investigation has to be cautiously delimited and the tissues surrounding the CNS have to be carefully dissected in order to include the extracranial lymphatic vessels and LNs that contribute to the whole lymphatic circuitry (Table 2).
In addition to size and anatomical considerations, the complexity of surrounding mesenchymal tissues varies along the skull and vertebral column, which requires adaptation of the decalcification and preclearing treatment in order to obtain a homogeneous sample clarification and allow light beam propagation within a soft isotropic biological tissue. In the absence of bones, LFSM imaging of the brain or spinal cord tissues does not necessitate the decalcification step, and the final resolution of the captured images is optimal19. The above described protocol, which includes a mild decalcification step with Morse’s solution, is well adapted for LSFM imaging of the vertebral column as illustrated in Figure 1 and Figure 4. In contrast, the neck region displays a particularly complex bone anatomy in addition to multiple layers of muscles, fat, and glandular tissues, which reduce the quality of captured LSFM images, as reflected in Figure 3B. LSFM imaging of the neck and cervical area may thus be improved by a more stringent treatment of tissues; for example, with EDTA, as previously reported24. The decalcification step is therefore critical and decalcification conditions have to be previously tested for each antibody used before starting the full iDISCO+ protocol (Table 2).
While the iDISCO+/LSFM protocol allows generation of a 3D view of connecting circuits between the meningeal and epidural spaces and associated LNs, the direct quantitative analysis of lymphatic vasculature from LSFM-captured images is not feasible for the following reasons: 1) delineation of lymphatic vessel circuits is unreliable due to the discontinuous pattern of lymphatic marker expression, because membranar LYVE1 is hereterogenously distributed21 and PROX1 has a nuclear expression pattern22; 2) the heterogenous penetration of antibodies, as well as the anisotropy that may persist in the biological tissue due to incomplete and heterogenous decalcification and preclearing. LSFM imaging thus needs to be extended by virtual reality tools that enable interactive visualization and thus facilitate quantification of the lymphatic vasculature (www.syglass.io). It is also noteworthy that the precise description of the CNS-associated circuitry requires backing up LSFM information with high-resolution confocal data obtained by conventional immunolabeling on thin (5–10 µm) cryostat or paraffin-embedded tissue sections, especially to precisely localize the position of lymphatic vessels with regards to the dura mater and the CSF, as reported previously11,14,18.
The iDISCO+/LSFM protocol allows three-dimensional visualization of the macromolecular drainage in the CNS-associated lymphatic system, as illustrated in Figure 3 and Figure 4. However, the functional assessment of lymphatic drainage requires, in addition to the recommendations on the iDISCO+/LSFM protocol detailed above, following a rigorous procedure, as the final outcome depends on the quality of the injection surgery, the choice of the delivery site, the type and injected volume of macromolecule marker used, and the time of sacrifice after tracer administration (Table 2). Due to variations of the tracer pattern between injected animals, the characterization of lymphatic drainage circuits requires large experimental groups (>10 by injection condition). In the protocol presented, 1) the dura mater must be punctured before injection to prevent unwanted lesions and penetration into the CNS tissues; 2) the injected volume has to be less than 2 µL to limit unwanted diffusion through the injection hole, along the injection capillary, into the epidural space or extravertebral tissues; 3) the deepness of injection capillary insertion has to be limited to 2 mm below the dura mater to avoid CNS injury or mistargeting in ICM and intraspinal injections, respectively. Note also that a complementary high-resolution confocal analysis of neighboring vertebral segments needs to be performed, as indicated above, to assess the presence of injected tracer inside of the lymphatic vessels. This analysis requires establishing the intensity profile plots for the tracer and the lymphatic marker on cross sections of marker-labeled lymphatic vessels. This approach has been previously used to demonstrate OVA555 uptake by ThLb lymphatics at 15 min after injection (Supplementary Figure 5F in Jacob et al.14). However, it has not been illustrated for the anti-LYVE1 tracer in the present study (Figure 4).
Among possible CSF tracers, OVA-A555 is an excellent option as it is resistant to the iDISCO+ protocol treatments and maintains high fluorescence for LSFM imaging. However, note that the type of tracer must be chosen in accordance with the analysis time point (Table 1 and Table 2). As reported above, OVA-A555 labeling of local vertebral lymphatic vessels is observed at 15 min after injection14. However, OVA-A555 is no longer detected in these local lymphatic circuits at 45 min after injection (Figure 3) in contrast to the anti-LYVE1 antibody (Figure 4).
To conclude, the iDISCO+/LSFM protocol is well adapted for investigating the 3D structure and drainage of the CNS-associated lymphatic system in physiological and pathological conditions such as CNS and vertebral column cancers, or vertebral bone and joint diseases. Although the full procedure is long and requires methodological rigor, it provides valuable, unique information when used with complementary analysis using virtual reality tools and high-resolution confocal imaging.
Disclosures
The authors have nothing to disclose.
Acknowledgements
This work was supported by Institut National de la Sante et de la Recherche Medicale, Agence Nationale Recherche (ANR-17-CE14-0005-03), Federation pour la Recherche sur le Cerveau (FRC 2017), Carnot Maturation (to L.J.), Universidade Federal de Rio de Janiero (UFRJ for J.B.), NIH (R01EB016629-01) and the Yale School of Medicine. We acknowledge the ICM platforms: ICM-QUANT for cellular imaging and ICM-histomics for immunohistochemistry. All animal work was conducted at the PHENO-ICMice facility. The Core is supported by 2 “Investissements d’avenir” (ANR-10- IAIHU-06 and ANR-11-INBS-0011-NeurATRIS) and the “Fondation pour la Recherche Médicale”. We acknowledge Nicolas Renier for methodological advice and manuscript reading.
Materials
| Name | Company | Catalog Number | Comments |
|---|---|---|---|
| Consumables | |||
| Centrifuge tubes: 0.2ml | Eppendorf | 30124359 | |
| Centrifuge tubes: 2ml | Eppendorf | 30120094 | |
| Conical centrifuge tubes: 15ml | Falcon | 352096 | |
| Conical centrifuge tubes: 50ml | Falcon | 352070 | |
| Microtome blade 80mm | Microm Microtech France | F/MM35P | |
| Needles 26G (0.45x13 mm) | Terumo | AN*2613R1 | |
| Syringe 1ml | Terumo | SS+01H1 | |
| Microscopes and imaging softwares | |||
| AxioZoom.V16 fluorescence stereo zoom microscope, equipped with an ORCA-Flash 4.0 digital sCMOS camera (Hamamatsu Photonics) or an OptiMOS sCMOS camera | Zeiss | ||
| Imspector Microscope controller software, Version v144 (acquisiton software) | Abberior instruments | ||
| Imaris File Converter x64 9.2.0(file convertion software) , Imaris stitcher software 9.2.0 (stitcher software), Imaris x64 9.2.0 (3D software) | OXFORD instruments | ||
| LED lasers (OBIS) LVBT Laser module 2nd generayion | COHERENT | ||
| Ultramicroscope II equipped with a sCMOS camera (Andor Neo) and a 4 × /0.3 objective lens (LVMI-Fluor WD6) | LaVision Biotec | ||
| Reagents | |||
| Alexa Fluor 568 Donkey anti Rabbit | Thermo Fisher | A10042 | |
| Alexa Fluor 647 Donkey anti goat | Jackson ImmunoResearch | 705-605-147 | |
| Alexa Fluor 647 Donkey anti Rabbit | Jackson ImmunoResearch | 711-605-152 | |
| Anti-LYVE1 polyclonal antibody | Angiobio | #11-034 | |
| Anti-PROX1 goat polyclonal IgG antibody | R&D systems | #AF2727 | |
| Buprenorphine Injection Ampoules (Buprecare solution, 0.3mg/ml) | Animalcare | Ampule 1ml | |
| Dibenzyl Ether 100% (DBE) | Sigma Aldrich | 108014 | |
| Dichloromethane 100% (DCM) | Sigma Aldrich | 270997 | |
| Formic acid 99% | CARLO ERBA | 405793 | |
| Glycine | Sigma Aldrich | G.7126 | |
| Heparine sodium salt from porcine | Sigma Aldrich | H4784 | |
| Hydrogen peroxide solution (H2O2 30%) | Sigma Aldrich | H1009 | |
| Isoflurane (Iso-Vet 100%) | Piramal | NDC 66794-013-10 | |
| Methanol 100% | Sigma Aldrich | 322415 | |
| Ovalbumin Alexa Fluor 555 Conjugate | Invitrogen | 11549176 | |
| Phosphate Buffer Solution PBS (stock solution 10X) | Euromedex | ET330-A | |
| Sodium Pentobarbital (Euthasol 400mg/mL) | Dechra | 08718469445110 | |
| Tri-sodium citrate | VWR | 6132-04-3 | |
| Surgical tools and equipments | |||
| Anaesthesia system | Univentor | Univentor 410 Anaesthesia Unit | |
| Glass micropipette puller | Narishige | PC-10 | |
| Heating pad | CMA Microdialysis AB | CMA 450 Temperature controller | |
| Microcapillaries (Glass Capillaries) | Harvard Apparatus | GC120-15 | |
| Microforceps, forceps,dissection scissors and Michel Suture Clips (7.5 × 1.75mm) | Fine Science Tool | 12040-01 | |
| Scalpel (sterile disposable scalpel 23) | Swann-Norton | 0510 | |
| Stereotaxic apparatus | KOPF | Model 940 | |
| Syringe Hamilton 10µl 701N | Hamilton | 28618-U | |
| Warm air System | Vet-Tech LTD | HE011 |
References
- Plog, B. A., Nedergaard, M. The Glymphatic System in Central Nervous System Health and Disease: Past, Present, and Future. Annual Review of Pathology. 13, 379-394 (2018).
- Iliff, J. J., Goldman, S. A., Nedergaard, M. Implications of the discovery of brain lymphatic pathways. The Lancet Neurology. 14 (10), 977(2015).
- Engelhardt, B., et al. Vascular, glial, and lymphatic immune gateways of the central nervous system. Acta Neuropathologica. 132, 317-338 (2016).
- Benveniste, H., et al. The Glymphatic System and Waste Clearance with Brain Aging: A Review. Gerontology. , 1-14 (2018).
- Louveau, A., Da Mesquita, S., Kipnis, J. Lymphatics in Neurological Disorders: A Neuro-Lympho-Vascular Component of Multiple Sclerosis and Alzheimer's Disease. Neuron. 91 (5), 957-973 (2016).
- Ma, Q., Ineichen, B. V., Detmar, M., Proulx, S. T. Outflow of cerebrospinal fluid is predominantly through lymphatic vessels and is reduced in aged mice. Nature Communications. 8 (1), 1434(2017).
- Ma, Q., Decker, Y., Müller, A., Ineichen, B. V., Proulx, S. T. Clearance of cerebrospinal fluid from the sacral spine through lymphatic vessels. The Journal of Experimental Medicine. 216 (11), 2492-2502 (2019).
- Louveau, A., et al. Understanding the functions and relationships of the glymphatic system and meningeal lymphatics. The Journal of Clinical Investigation. 127 (9), 3210-3219 (2017).
- Louveau, A., et al. Structural and functional features of central nervous system lymphatic vessels. Nature. 523 (7560), 337-341 (2015).
- Aspelund, A., et al. A dural lymphatic vascular system that drains brain interstitial fluid and macromolecules. The Journal of Experimental Medicine. 212 (7), 991-999 (2015).
- Antila, S., et al. Development and plasticity of meningeal lymphatic vessels. The Journal of Experimental Medicine. 214 (12), 3645-3667 (2017).
- Ahn, J. H., et al. Meningeal lymphatic vessels at the skull base drain cerebrospinal fluid. Nature. 572 (7767), 62-66 (2019).
- Pollay, M. The function and structure of the cerebrospinal fluid outflow system. Cerebrospinal Fluid Research. 7, 9(2010).
- Jacob, L., et al. Anatomy and function of the vertebral column lymphatic network in mice. Nature Communications. 10 (1), 1-16 (2019).
- Louveau, A., et al. CNS lymphatic drainage and neuroinflammation are regulated by meningeal lymphatic vasculature. Nature Neuroscience. 21 (10), 1380-1391 (2018).
- Da Mesquita, S., et al. Functional aspects of meningeal lymphatics in ageing and Alzheimer's disease. Nature. 560 (7717), 185-191 (2018).
- Song, E., et al. VEGF-C-driven lymphatic drainage enables immunosurveillance of brain tumours. Nature. 577 (7792), 689-694 (2020).
- Absinta, M., et al. Human and nonhuman primate meninges harbor lymphatic vessels that can be visualized noninvasively by MRI. eLife. 6, 29738(2017).
- Renier, N., et al. iDISCO: a simple, rapid method to immunolabel large tissue samples for volume imaging. Cell. 159 (4), 896-910 (2014).
- Renier, N., et al. Mapping of Brain Activity by Automated Volume Analysis of Immediate Early Genes. Cell. 165 (7), 1789-1802 (2016).
- Jackson, D. G., Prevo, R., Clasper, S., Banerji, S. LYVE-1, the lymphatic system and tumor lymphangiogenesis. Trends in Immunology. 22 (6), 317-321 (2001).
- Wigle, J. T., Oliver, G. Prox1 function is required for the development of the murine lymphatic system. Cell. 98 (6), 769-778 (1999).
- Olarte, O. E., Andilla, J., Gualda, E. J., Loza-Alvarez, P. Light-sheet microscopy: a tutorial. Advances in Optics and Photonics. 10 (1), 111-179 (2018).
- Jing, D., et al. Tissue clearing of both hard and soft tissue organs with the PEGASOS method. Cell Research. 28 (8), 803-818 (2018).
Reprints and Permissions
