Here, we describe the preparation of rhinal cortex-hippocampus organotypic slices. Under a gradual and controlled deprivation of serum, these slices depict evolving epileptic-like events and can be considered an ex vivo model of epileptogenesis. This system represents an excellent tool for monitoring the dynamics of spontaneous activity, as well as for assessing the progression of neuroinflammatory features throughout the course of epileptogenesis.
Method Article
A Model of Epileptogenesis in Rhinal Cortex-Hippocampus Organotypic Slice Cultures
* These authors contributed equally
In This Article
Summary
Abstract
Organotypic slice cultures have been widely used to model brain disorders and are considered excellent platforms for evaluating a drug’s neuroprotective and therapeutic potential. Organotypic slices are prepared from explanted tissue and represent a complex multicellular ex vivo environment. They preserve the three-dimensional cytoarchitecture and local environment of brain cells, maintain the neuronal connectivity and the neuron-glia reciprocal interaction. Hippocampal organotypic slices are considered suitable to explore the basic mechanisms of epileptogenesis, but clinical research and animal models of epilepsy have suggested that the rhinal cortex, composed of perirhinal and entorhinal cortices, play a relevant role in seizure generation.
Here, we describe the preparation of rhinal cortex-hippocampus organotypic slices. Recordings of spontaneous activity from the CA3 area under perfusion with complete growth medium, at physiological temperature and in the absence of pharmacological manipulations, showed that these slices depict evolving epileptic-like events throughout time in culture. Increased cell death, through propidium iodide uptake assay, and gliosis, assessed with fluorescence-coupled immunohistochemistry, was also observed. The experimental approach presented highlights the value of rhinal cortex-hippocampus organotypic slice cultures as a platform to study the dynamics and progression of epileptogenesis and to screen potential therapeutic targets for this brain pathology.
Introduction
Epilepsy, one of the most prevalent neurologic disorders worldwide, is characterized by the periodic and unpredictable occurrence of synchronized and excessive neuronal activity in the brain. Despite the various antiepileptic drugs (AEDs) available, one-third of patients with epilepsy are refractory to therapy1 and continue to experience seizures and cognitive decline. Furthermore, available AEDs hamper cognition due to their relatively generalized actions upon neuronal activity. Epileptogenesis is hard to study in humans, due to the multiple and heterogeneous epileptogenic injuries, long latent periods lasting months to decades, and the misleading effects of anticonvulsant treatment after the first spontaneous seizure.
The identification of potential therapeutic agents for the treatment of epilepsy has become possible due to animal models of epilepsy: 1) genetic models, which use genetically predisposed animals in which seizures occur spontaneously or in response to a sensory stimulus; 2) models of electrical stimulation-induced seizures; and 3) pharmacological models of seizure induction that use pilocarpine (a muscarinic receptor agonist), kainate (a kainate receptor agonist) or 4-aminopyridine (a potassium channel blocker), among others. These models were crucial in the understanding of the behavioral changes, as well as molecular and cellular mechanisms underlying epilepsy, and they have led to the discovery of many AEDs2.
Ex vivo preparations are also a powerful tool to explore the mechanisms underlying epileptogenesis and ictogenesis. Acute hippocampal slices, which enable electrophysiological studies of living cells over a 6-12 h period, and organotypic hippocampal slices that can be preserved in an incubator over a period of days or weeks have been extensively used in studies of epileptiform activity3.
Organotypic brain slices are prepared from explanted tissue and represent a physiological three-dimensional model of the brain. These slices preserve the cytoarchitecture of the region of interest and include all brain cells and their intercellular communication4. The most used region for long-term organotypic cultures is the hippocampus, as this region is affected by neuronal loss in multiple neurodegenerative conditions. They have been widely used to model brain disorders and are considered excellent tools for assessing a drug’s neuroprotective and therapeutic potential5,6. Models of epileptogenesis, stroke and Aβ-induced toxicity were described in hippocampal organotypic slices7,8,9,10. Parkinson’s disease was explored in ventral mesencephalon and striatum, as well as cortex-corpus callosum-striatum-substantia nigra, organotypic slices11. Organotypic cerebellar slice cultures mimic many aspects of axon myelination and cerebellar functions and are a widespread model for investigating novel therapeutic strategies in multiple sclerosis12.
However, clinical research and animal models of epilepsy have suggested that the rhinal cortex, composed by perirhinal and entorhinal cortices, plays a role in seizure generation13. Thus, a model of epileptogenesis in rhinal cortex-hippocampus organotypic slices was established14. Under a gradual and controlled deprivation of serum, rhinal cortex-hippocampus organotypic slices depict evolving epileptic-like events, unlike analogous slices always kept in a serum-containing medium.
In epilepsy, as in many acute and chronic diseases of the central nervous system, the neurocentric vision fails to elucidate the mechanisms underlying disease onset and progression. Clinical and experimental evidence point to brain inflammation, in which microglia and astrocytes play a relevant role, as one of the key players contributing to the epileptic process. Pharmacological experiments in animal models of epilepsy suggest that antiepileptogenic effects can be achieved by targeting pro-inflammatory pathways, and nowadays neuroinflammation is regarded as a novel option for the development of therapeutic approaches for epilepsy15.
Here, we thoroughly describe the preparation of rhinal cortex-hippocampus organotypic slice cultures, as well as the details for recording spontaneous epileptiform activity from them. We highlight that this system mimics several neuroinflammatory aspects of epilepsy, being thus suitable to explore the role of glial cells and neuroinflammation in this pathology. Furthermore, it represents an easy-to-use platform for the screening of potential therapeutic approaches for epilepsy.
Protocol
The Portuguese law and European Union guidelines (2010/63/EU) were respected in all procedures regarding the protection of animals for scientific purposes. All methods described here were approved by the iMM’s Institutional Animal Welfare Body (ORBEA-iMM) and the National competent authority (DGAV – Direção Geral de Alimentação e Veterinária).
1. Preparation of rhinal cortex-hippocampus slices
NOTE: The preparation of rhinal cortex-hippocampus slices uses P6-7 Sprague-Dawley rats.
- Culture setup and medium preparation
- On the day before the culture, prepare the required media and place them at 4 °C.
- Prepare dissection medium: 25 mM glucose in Gey's Balanced Salt Solution (GBSS).
- Prepare culture medium: 50% Opti-MEM, 25% HBSS, 25% Horse Serum (HS), 25 mM glucose, 30 µg/mL Gentamycin.
- Prepare maintenance medium: Neurobasal-A (NBA), 2% B27, 1 mM L-glutamine, 30 µg/mL Gentamycin, HS (15%, 10%, 5% and 0%).
- Brain harvesting
- Just before starting the culture, add 1.1 mL of culture medium to each well of the 6-well plate with a P1000 pipette and place it at 37 °C.
- Place all the equipment (dissection microscope, tissue chopper, dissecting lamp, dissecting tools, electrodes, plates, inserts and filter papers) inside the biological safety cabinet and sterilize under UV light for 15 minutes.
- Adjust slice thickness to 350 µm.
- Withdraw the GBSS from the fridge. Add 5 mL of GBSS to six Petri dishes. Six Petri dishes will be required per animal.
- Euthanize the rat pup. Perform decapitation by using a sharp scissor at the base of the brain stem of the animal.
- Wash the animal head three times in cold GBSS and take it inside the safety cabinet.
- Tissue isolation and preparation of slices
- Firmly insert sharp forceps into the eye sockets to hold the head.
- Using a thin scissor cut the skin/scalp along the midline starting from the vertebral foramen towards the frontal lobes and put it aside.
- Cut in the same way the skull and along the cerebral transverse fissure (space between brain and cerebellum). With curved long forceps, move it apart.
- Discard the olfactory bulbs with a spatula. Remove the brain from the head and place it in ice-cold GBSS with the dorsal surface faced up (Figure 1A).
- Insert the fine forceps into the cerebellum and go along the midline with the spatula opening each hemisphere very carefully (Figure 1B).
- With short curve forceps, carefully remove the excess tissue that covers the hippocampi, without touching the hippocampal structure. Then with a spatula, cut below each hippocampus (Figure 1C).
- Pick up one hemisphere and place it, with hippocampus facing up, onto a filter paper. Repeat the procedure with the other hemisphere and place it parallel to the first one, in the filter paper. Put the filter paper on the tissue chopper, with the hemispheres perpendicular to the blade, and cut the hemispheres in 350 μm slices (Figure 1D).
- Place the sliced tissue into a Petri dish with cold GBSS (Figure 1E).
- Carefully separate the slices using the round tip electrodes (Figure 1F). Keep only the slices with a structurally intact rhinal cortex and hippocampus. DG and CA areas should be perfectly defined, as well as the entorhinal and perirhinal cortex (Figure 1G).
- Place each slice onto the insert (Figure 1H-I), with a spatula and a round tip electrode. Remove excess dissection medium around each slice with a P20 pipette (Figure 1J). Four rhinal cortex-hippocampus slices can be cultured in a single insert (Figure 1K).
- Culture maintenance
- Change the medium every other day.
- Warm up the medium at 37 °C.
- Take the plates from the incubator. Pick up each insert by holding the plastic edge with forceps (Figure 1L).
- Use a free hand to aspirate the medium from the well. Place the insert back into the well and add 1 mL, with a P1000 pipette, of fresh warmed medium (Figure 1M). Repeat for all the inserts. Make sure no air bubbles are trapped between the membrane and the medium.
NOTE: Epileptic-like slices undergo a gradual and controlled deprivation of serum in the medium. From 9 Days In Vitro (DIV) on, slices are maintained in NBA without HS14.
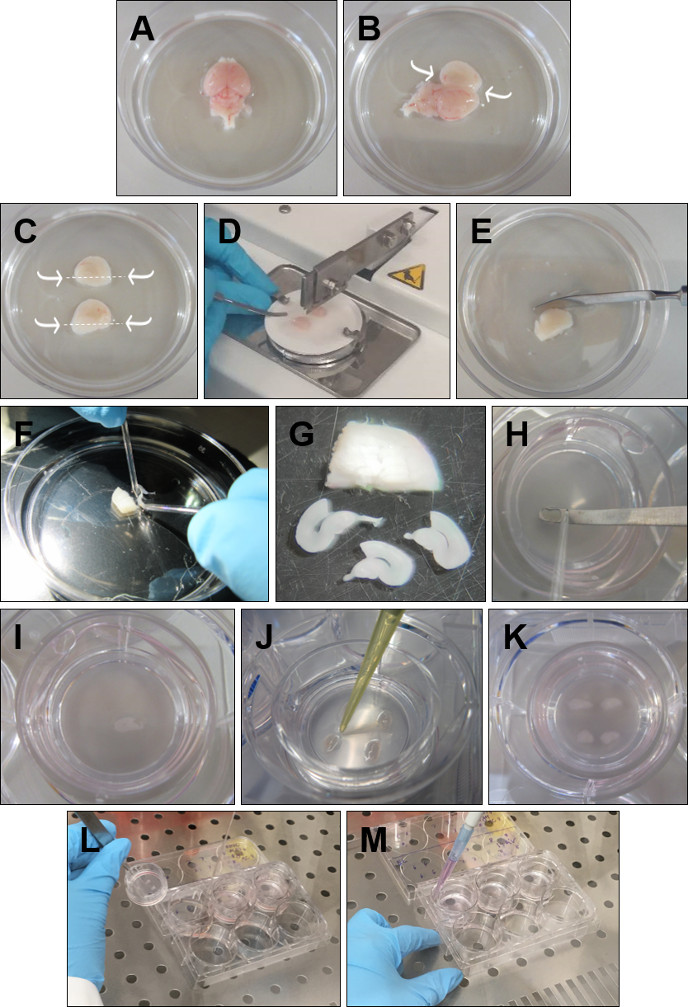
Figure 1: Detailed procedure for the preparation of rhinal cortex-hippocampus organotypic slices. (A) Remove the brain from the head and place it in ice-cold GBSS with the dorsal surface faced up. (B) Insert the forceps into the cerebellum. Open the brain through the midline and remove the excess tissue over the hippocampus. (C) With a spatula cut below the hippocampus, as indicated by the arrows. (D) Place both hippocampi facing up and parallel to each other onto the filter paper and cut 350 µm slices on the tissue chopper. (E) Place the sliced hippocampus in ice-cold GBSS. (F) Separate the slices with the help of round tipped glass electrodes. (G) Choose only the slices that depict an intact rhinal cortex and hippocampus. (H, I) With the help of a round tipped glass electrode push each slice to the spatula and place it on the insert. (J) Remove the GBSS surrounding the slice. (K) Place four slices per insert. (L) To change the medium, lift the insert and aspirate the medium with a glass pipette. (M) Add fresh medium by placing the pipette between the insert and the walls of the 6-wells plate. Make sure there are no air bubbles beneath the slices. Please click here to view a larger version of this figure.
2. Electrophysiological recordings
NOTE: Electrophysiological recordings were performed in rhinal cortex-hippocampus organotypic slices at 7, 14 and 21 DIV in an interface-type chamber. Recordings were obtained with an amplifier, digitized and analyzed with software. All recordings were band-pass filtered (eight-pole Bessel filter at 60 Hz and Gaussian filter at 600 Hz).
- Setup preparation
- Prepare 50 mL of NBA medium with 1 mL of B27 and 250 μL of L-Glutamine. Warm up at 37 °C.
- Set the electrophysiology setup in close circuit. Verify if the flow rate is 2 mL/min.
- Open the carbox (5% CO2/95% O2) valve and check the water level in the system.
- Put the filter paper in the interface recording chamber to drain excess medium and the lens cleaning paper beneath the frame to supply medium to the slice.
- Turn on the temperature controller, the amplifiers, and the micromanipulator.
- Let the temperature in the interface chamber stabilize at 37 °C before starting the recordings.
- Prepare artificial cerebrospinal fluid (aCSF: 124 mM NaCl, 3mM KCl, 1.2 mM NaH2PO4, 25 mM NaHCO3, 10 mM glucose, 2 mM CaCl2, 1 mM MgSO4 with pH 7.4) and use it to fill the glass electrode with a syringe. Place it in the receiving electrode.
- Recordings of spontaneous activity
- Once the temperature is stable, remove the plate from the incubator and cut one slice from the insert with a highly sharp blade. Place it in a 60 mm plate with a drop of medium. Take it to the interface recording chamber.
- Place the slice in the interface chamber with the hippocampus to the bottom right. Place the receiving electrode in the CA3 pyramidal cell layer.
- Proceed to the continuous acquisition protocol and record for 30 min.
3. PI uptake assay
NOTE: Cell death was assessed by monitoring the cellular uptake of the fluorescent dye propidium iodide (PI). PI is a polar compound, which enters cells with damaged cell membranes and interacts with DNA emitting red fluorescence (absorbance 493 nm, emission 630 nm). Since PI is not permeant to live cells, it is used to detect dead cells in a population.
- PI incubation
- Prepare, in culture medium, a fresh 1:10 dilution of PI stock.
- For PI uptake assay remove the plate from the incubator and carefully raise the insert. Add 13 µL of PI to the medium, with a P20 pipette, obtaining a final concentration of 2 µM. Agitate slowly the plate before putting the insert back in place. Make sure there are no bubbles beneath the slices.
- Put the slices back in the 37 °C incubator for 2 h.
- Proceed with the immunohistochemistry protocol, as described in the next section. Cover the plates with aluminium, since PI is light sensitive.
4. Immunohistochemistry
NOTE: In immunohistochemistry a neuron specific antibody, as well as antibodies able to discriminate resting and reactive phenotypes of microglia and astrocytes, were used to evaluate the extend of neuronal death and gliosis in rhinal cortex-hippocampus epileptic-like organotypic slices.
- Tissue fixation
- Remove the plate from the incubator and aspirate the medium. Fix the slices with 4% paraformaldehyde (PFA) for 1 h at RT, by adding 1 mL of PFA beneath and above the slices, with a P1000 pipette.
- Remove the PFA and add 1 mL of PBS. Also add PBS beneath and above the slices.
- Keep the slices at 4 °C, in PBS, until further use. Always put parafilm around the plates to avoid drying.
- Immunostaining steps
- Wash twice, 10 min each time, with 1 mL of PBS.
- Prepare permeabilization/blocking solution containing 1% Triton-X100, 10% HS and 10% BSA in PBS. Prepare 5% BSA solution.
- Draw two rectangles with the hydrophobic pen (Figure 2A). Cut the slices from the insert (Figure 2B) with a highly sharp blade. Put two slices per slide (Figure 2C) and add 140 µL of permeabilization/blocking solution on the top of each slice, using a P200 pipette. Incubate for 3 h at RT.
- Dilute the primary antibodies to the working dilution in 5% BSA in PBS. Incubate with the primary antibodies overnight at 4 °C.
- Incubate with the secondary antibodies for 4 h at RT. From this step on, protect the plate from light since fluorophores are being worked with.
- Place a 50 μL drop of Hoechst solution on the top of each slice and incubate for 20 min at RT.
- Wash between incubations. Always wash three times, for 10 min each time, with PBS-T.
- Remove Hoechst and wash as recommended.
- Add 50 μL of mounting medium on the top of each slice. Cover with a glass coverslip and surround with nail polish (Figure 2D).
- Let it dry at RT for 24 h.
- Visualize the immunostaining under a confocal microscope. Keep the stained slices at -20 °C.
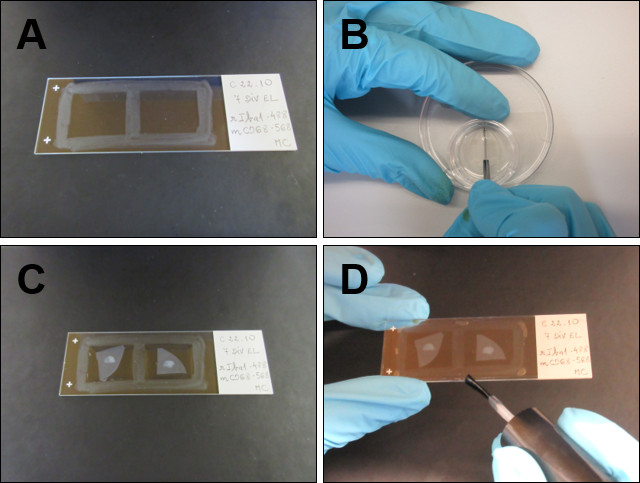
Figure 2: Specific procedure for the immunohistochemistry assay. (A) With the hydrophobic pen draw two squares in the slide. (B) Cut the piece of insert that contains the slice. (C) Place each slice in the squares drawn with the hydrophobic pen and start the permeabilization/blocking step. (D) After concluding the protocol, finish by mounting the slices in mounting medium, covering with a glass coverslip and surrounding it with nail polish. Please click here to view a larger version of this figure.
Results
Based on previous descriptions of epileptic signal analysis in organotypic hippocampal slices, interictal epileptiform discharges are here defined as paroxysmal discharges that are clearly distinguished from background activity, with an abrupt change in polarity and occurring at low frequency (<2 Hz). Paroxysmal discharges lasting more than 10 s and occurring at higher frequency (≥2 Hz) are characterized as ictal epileptiform activity. If an ictal event occurs within 10 s after the previous one, these two events are considered as only one ictal event.
Rhinal cortex-hippocampus organotypic slices at 7 DIV (Figure 3A) depict mixed interictal and ictal-like activity. At 14 DIV (Figure 3B), spontaneous activity is characterized by ictal discharges, which evolve to an overwhelming ictal activity at 21 DIV, with ictal events lasting >1 min (Figure 3C).

Figure 3: Spontaneous epileptiform activity of rhinal cortex-hippocampus organotypic slices. Representative electrographic seizure-like events, recorded from CA3 area in an interface-type chamber, after (A) 7 DIV, (B) 14 DIV and (C) 21 DIV. Seizure details are shown in lower traces. Please click here to view a larger version of this figure.
PI uptake assay followed by immunohistochemistry against the neuronal marker NeuN aimed at identifying neuronal death. PI uptake by granular and pyramidal neurons was observed in 7 DIV slices (arrows in Figure 4A), but the number of PI+ neurons increased at 14 DIV (arrows in Figure 4B), corroborating an increased neuronal death with epileptogenesis progression.

Figure 4: Representative images of NeuN and PI stained rhinal cortex-hippocampus organotypic slices. Images of NeuN stained mature neurons and PI-positive cells were acquired at (A) 7 DIV and (B) 14 DIV, on a confocal laser microscope with a 20x objective. Magnified images of the dashed areas are shown. Arrows point to death neurons (in orange). Scale-bar, 50 μm. Please click here to view a larger version of this figure.
A double staining of Iba1, together with CD68, was used to evaluate microglia phenotype. Iba1 is a microglia/macrophages marker, while CD68 is a lysosomal protein expressed in high levels by reactive microglia and in low levels by resting microglia. At 7 DIV slices, ramified microglia with a low CD68 expression (arrows in Figure 5A) are more abundant than Iba1+/CD68+ reactive microglia (arrowheads in Figure 5A), whereas at 14 DIV, in all areas of the hippocampus, Iba1+/CD68+ bushy/amoeboid M1 microglia (arrowheads in Figure 5B) exceed microglia with a low CD68 expression (arrows in Figure 5B). At 14 DIV some Iba1+/CD68+ cells with a hyper-ramification appearance can be pinpointed (open arrowheads in Figure 5B), which might suggest the occurrence of the M2 anti-inflammatory phenotype of microglia. However, this matter requires further study.
Recent studies demonstrated that different initiating CNS injuries can elicit at least two types of reactive astrocytes, A1 and A2, with A1 astrocytes being neurotoxic16. A1 subtype of astrocytes is characterized by an increased expression of Complement C316,17,18. Complement C3, which plays a central role in the activation of the complement system, generates C3b, which is further degraded to iC3b, C3dg and C3d19. Thus, a double staining of GFAP and C3d was employed to assess astrogliosis. At 7 DIV the expression of C3d is barely detectable (Figure 6A), while in 14 DIV slices hypertrophic GFAP+/C3d+ astrocytes can be observed (arrowheads in Figure 6B), suggesting a progressive activation of A1 astrocytes.
Results demonstrate a progressive activation of microglia and astrocytes throughout the course of epileptogenesis, mimicking the events described in patients with epilepsy and in animal models of this pathology.

Figure 5: Representative images of Iba1 and CD68 stained rhinal cortex-hippocampus organotypic slices. Images of Iba1 and CD68 stained microglia, and Hoechst stained nuclei, were acquired at (A) 7 DIV and (B) 14 DIV, on a confocal laser microscope with a 20x objective. Magnified images of the dashed areas are shown. Arrows point to Iba1+/CD68- resting microglia, arrowheads indicate Iba1+/CD68+ bushy/amoeboid microglia and open arrowheads reveal Iba1+/CD68+ hyper-ramified microglia. Scale-bar, 50 μm. Please click here to view a larger version of this figure.
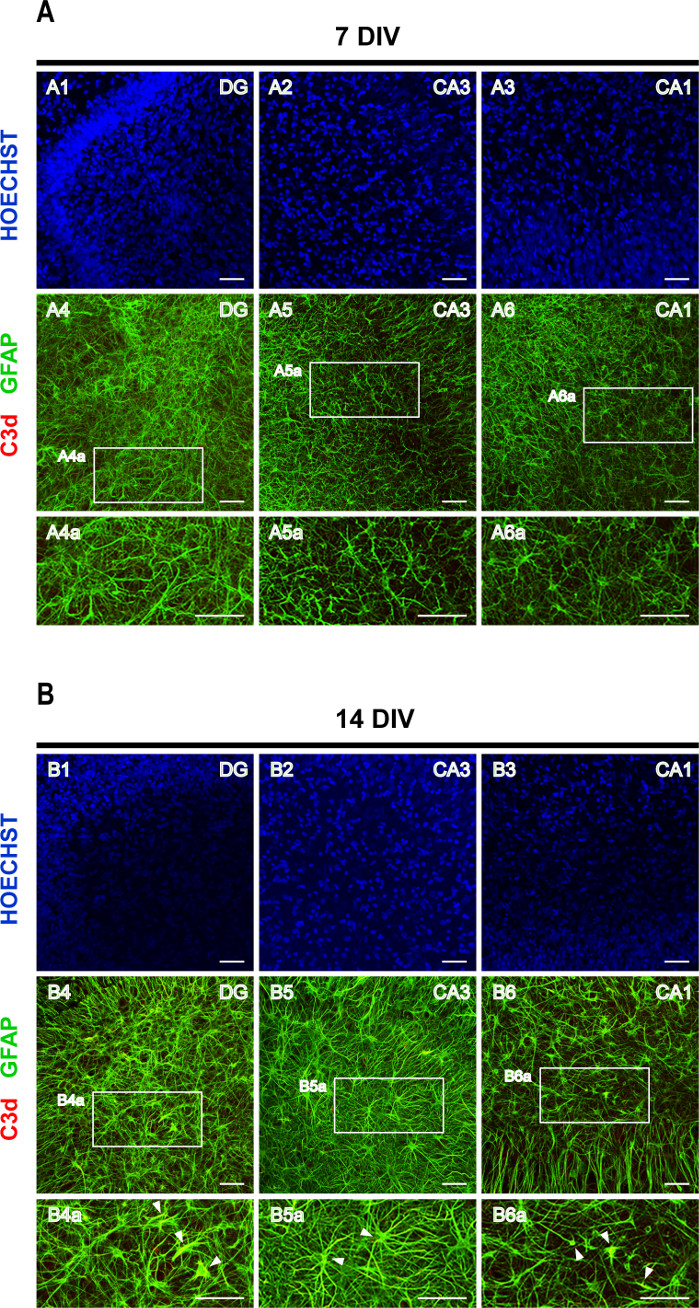
Figure 6: Representative images of GFAP and C3d stained rhinal cortex-hippocampus organotypic slices. Images of GFAP and C3d stained astrocytes, and Hoechst stained nuclei, were acquired at (A) 7 DIV and (B) 14 DIV, on a confocal laser microscope with a 20x objective. Magnified images of the dashed areas are shown. Arrowheads point to GFAP+/C3d+ reactive A1 astrocytes (in yellow). Scale-bar, 50 μm. Please click here to view a larger version of this figure.
Discussion
Animal models of epilepsy have been crucial for the discovery of many AEDs, however they require many animals and most of them are time-consuming due to the latent period for seizure onset. The low-magnesium induction of epileptiform activity in hippocampal acute slices has also been thoroughly revised in the literature3, but acute slices have a 6-12 h viability making it impossible to assess long-term changes. Organotypic slices can be maintain in culture from days to weeks, allowing to overcome the short viability time of acute slices, and models of epileptogenesis in organotypic hippocampal slices have been proposed3,7,8.
Here we describe the preparation of organotypic slices, comprising the rhinal cortex and the hippocampus. These slices take 15-20 min to prepare per animal, starting from animal sacrifice until placement of slices onto the inserts, and 6-8 slices per hemisphere can be obtained. Extra care must be taken when opening the hemisphere to expose the hippocampus and when removing the tissue from the filter paper after slicing. Excess tissue above the hippocampus can also compromise the slice integrity during slicing.
Rhinal cortex-hippocampus organotypic slices depict an evolving epileptic-like activity resembling in vivo epilepsy. After one week in culture, most slices depict mixed interictal and ictal-like activity, which progresses to solely ictal-like events with time in culture. So far, we have recorded few interictal discharges in slices with 2-3 weeks. In this system, epileptic-like activity appears to develop faster than in organotypic hippocampal slices. This might be attributed to the presence of the rhinal cortex, which preserves most of the functional input to the hippocampus. To fully address this issue, a complete characterization of the epileptic signals displayed by these slices throughout time in culture, such as number and duration of ictal events, together with their amplitude and frequency, is currently being performed.
This system can be maintained in culture for more than three weeks, and mimics many molecular correlates of epilepsy, such as neuronal death, activation of microglia and astrocytes and increased production of pro-inflammatory cytokines14, allowing a long-term characterization of these aspects. It also represents an easy-to-use screening platform, where pharmacological interventions targeting specific cellular pathways can be implemented and potential therapeutic targets can be tested. Undoubtedly, the system herein presented can help to further enlighten the mechanisms of epileptogenesis.
Disclosures
The authors have nothing to disclose.
Acknowledgements
The authors would like to acknowledge the Bioimaging Unit of Instituto de Medicina Molecular João Lobo Antunes, for all the suggestions concerning image acquisition.
This project has received funding from the European Union’s Horizon 2020 research and innovation programme under grant agreement Nº 952455, Fundação para a Ciênciae Tecnologia (FCT) through Project PTDC/MEDFAR/30933/2017, and Faculdade de Medicina da Universidade de Lisboa.
Materials
| Name | Company | Catalog Number | Comments |
|---|---|---|---|
| 50 mL Centrifuge Tube, Conical Bottom | Corning | 430829 | |
| 70% Ethanol | Manuel Vieira, Lda | UN1170 | |
| Amplifier | Axon Instruments | Axoclamp 900A | |
| Amplifier | Axon Instruments | Digidata 1440A | |
| Anti-C3d (goat) | R&D Systems | AF2655 | Dilute at a ratio 1:1000 |
| Anti-CD68 (mouse) | Abcam | ab31630-125ug | Dilute at a ratio 1:250 |
| Anti-GFAP (mouse) | Millipore SAS | MAB360 | Dilute at a ratio 1:500 |
| Anti-Iba1 (rabbit) | Abcam | ab108539 | Dilute at a ratio 1:600 |
| Anti-NeuN (rabbit) | Werfen | 16712943S | Dilute at a ratio 1:500 |
| Artificial cerebrospinal fluid (aCSF) | Homemade | ||
| B-27™ Supplement (50X), serum free | Thermo Fisher Scientific | 17504-044 | |
| Blades for scalpel handle | Fine Science Tools | 10011-00 | |
| Bovine Serum Albumin (BSA) | NZYTech | MB04602 | 5% BSA is used to dilute the primary antibodies. Add 0.5g BSA in 10 mL PBS. |
| Brain/Tissue Slice Chamber System | Warner Instruments | ||
| Calcium chloride dihydrate | Merck Millipore | 1.02382.0500 | |
| Cell culture inserts, 30 mm, hydrophilic PTFE | Millipore SAS | PICM03050 | |
| Cold light source | SCHOTT | KL 300 LED | |
| Confocal laser microscope | Zeiss | LSM 710 | |
| Conventional incubator | Thermo Scientific Heraeus | BB15, Function Line | Set to 37 °C and 5% CO2 |
| D(+)-Glucose monohydrate | Merck Millipore | 1.08342.1000 | |
| D-(+)-Glucose solution, 45% in water | Sigma | G8769 | |
| di-Sodium hydrogen phosphate dihydrate | Merck Milipore | 1.06580.1000 | |
| Dissecting microscope/magnifier | MEIJI TECHNO CO. LTD | 122285 | |
| Donkey anti-goat IgG (H+L) coupled to Alexa Fluor 568 | Invitrogen | A11057 | Dilute at a ratio 1:200 |
| Donkey anti-mouse IgG (H+L) coupled to Alexa Fluor 488 | Invitrogen | A21202 | Dilute at a ratio 1:200 |
| Donkey anti-mouse IgG (H+L) coupled to Alexa Fluor 568 | Invitrogen | A10037 | Dilute at a ratio 1:200 |
| Donkey anti-rabbit IgG (H+L) coupled to Alexa Fluor 488 | Invitrogen | A21206 | Dilute at a ratio 1:500 |
| Donkey anti-rabbit IgG (H+L) coupled to Alexa Fluor 568 | Invitrogen | A10042 | Dilute at a ratio 1:500 |
| Dumont #5 Fine Forceps Biologie Inox | Fine Science Tools | 11254-20 | |
| Dumont #5 Forceps Standard Inox | Fine Science Tools | 11251-20 | |
| Dumont #7 Forceps Standard Dumoxel | Fine Science Tools | 11271-30 | |
| Dumont Medical #7S Forceps Short Curve Inox | Fine Science Tools | 11273-22 | |
| Gentamycin stock solution, 50 mg/mL | Thermo Fisher Scientific | 15750-037 | |
| Gey’s Balanced Salt Solution (GBSS) | Biological Industries | 01-919-1A | |
| Glass Electrodes | Science Products | GB150F-10 | Round tips homemade |
| Glass Pasteur pipettes, 230 mm | VWR International | 612-1702 | |
| Hank’s Balanced Salt Solution (HBSS) | Thermo Fisher Scientific | 24020-091 | |
| Hoechst 33342 | Invitrogen | H1399 | Stock solution at 2 mg/mL in PBS |
| Horse Serum, Heat Inactivated (HS) | Thermo Fisher Scientific | 26050-088 | |
| Hydrochloric acid | Merck Milipore | 1.09057.1000 | |
| Hydrophobic Pen | Dako | S200230-2 | |
| INCU-Line IL10 | VWR | 390-0384 | |
| Interface chamber | Warner Instruments | BSC-HT Haas Top | |
| Iris Spatula Curved | Fine Science Tools | 10092-12 | |
| Labculture Class II Biological Safety Cabinet | HERASafe | HS 12 | |
| Lens Cleaning Paper | TIFFEN | ||
| L-Glutamine solution 200 mM (Q) | Thermo Fisher Scientific | 25030-024 | |
| Magnesium sulfate heptahydrate | Merck Millipore | 1.05886.0500 | |
| Micro tube 0.5 mL, PP | SARSTEDT | 72,699 | |
| Micro tube 1.5 mL, PP | SARSTEDT | 72.690.001 | |
| Micro tube 2.0 mL, PP | SARSTEDT | 72.691 | |
| Micromanipulators | Sutter Instrument | MP-285 | |
| Miroscope Cover Glasses, 24 mm x 60 mm | Marienfeld | 102242 | |
| Nail polish | Cliché | ||
| Neurobasal-A Medium (NBA) | Thermo Fisher Scientific | 10888-022 | |
| Opti-MEM® I Reduced-Serum Medium | Thermo Fisher Scientific | 31985-047 | |
| Paraformaldehyde, powder | VWR Chemicals | 2,87,94,295 | |
| Peristaltic pump | Gilson | M312 | |
| Phosphate saline buffer (PBS) | Homemade. PBS with 0.5% Tween-20 (PBS-T) is used to wash slices during the immunohistochemistry assay. | ||
| Phosphate standard solutions, PO43- in water | BDH ARISTAR | 452232C | |
| Pipette set | Gilson | P2, P10, P20, P100, P200, P1000 | |
| Platinum 5 blades | Gillette | ||
| Potassium chloride | Sigma-Aldrich | P5405-250g | |
| Propidium iodide (PI) | Sigma-Aldrich | P4170-25MG | Stock solution at 1 mg/mL in water. |
| Qualitative Filter Paper, Cellulose, Grade 1, 55 mm | Whatman | 1001-055 | Medium retention 11µm |
| Qualitative Filter Paper, Cellulose, Grade 1, 90 mm | Whatman | 1001-090 | Medium retention 11µm |
| Scalpel handle | Fine Science Tools | 91003-12 | |
| Slip Tip Insulin Syringe without Needle 1 mL | SOL-M | 161000 | |
| Sodium chloride | VWR Chemicals | 27800.360 | |
| Sodium dihydrogen phosphate monohydrate | Merck Millipore | 1.06346.1000 | |
| Sodium hydrogen carbonate | Merck Millipore | 1.06329.1000 | |
| Sodium Hydroxide | Merck Milipore | 535C549998 | |
| Stimulator | Astro Med Inc GRASS Product Group | S48 Stimulator | |
| Student Scissors Straight SharpSharp 12cm | Fine Science Tools | 91402-12 | |
| SuperFrost Plus™ Adhesion slides | Thermo Fisher Scientific | J1800AMNZ | |
| TC-Treated Sterile 60 x 15mm Tissue Culture Dish | Corning | CORN430166 | |
| TC-Treated Sterile 6-Wells Plates | Corning | CORN3516 | |
| Temperatue controller | MEDICAL SYSTEMS CORP. | TC-102 | |
| Tissue Chopper | The Mickle Laboratory Engineering CO. LTD. | MTC/2 | Set to 350 μm |
| Triton X-100 | BDH | 14630 | |
| Tween-20 | Sigma | P2287 |
References
- Fisher, R. S., et al. Electrical stimulation of the anterior nucleus of thalamus for treatment of refractory epilepsy. Epilepsia. 51, 899-908 (2010).
- Loscher, W. Critical review of current animal models of seizures and epilepsy used in the discovery and development of new antiepileptic drugs. Seizure. 20, 359-368 (2011).
- Heinemann, U., Kann, O., Schuma, S. An overview of in vitro seizure models in acute and organotypic slices. Models of seizures and epilepsy. Pitkänen, A., Schwartzkroin, P. A., Moshé, S. L. , Elsevier Academic Press. Cambridge. 35-44 (2006).
- Sundstrom, L., Morrison, B., Bradley, M., Pringle, A. Organotypic cultures as tools for functional screening in the CNS. Drug Discovery Today: Targets. 10, 993-1000 (2005).
- Holopainen, I. E. Organotypic hippocampal slice cultures: a model system to study basic cellular and molecular mechanisms of neuronal cell death, neuroprotection, and synaptic plasticity. Neurochemical Research. 30, 1521-1528 (2005).
- Noraberg, J., et al. Organotypic hippocampal slice cultures for studies of brain damage, neuroprotection and neurorepair. CNS Neurological Disorders Drug Targets. 4, 435-452 (2005).
- Dyhrfjeld-Johnsen, J., Berdichevsky, Y., Swiercz, W., Sabolek, H., Staley, K. J. Interictal spikes precede ictal discharges in an organotypic hippocampal slice culture model of epileptogenesis. Journal of Clinical Neurophysiology. 27, 418-424 (2010).
- Chong, S. A., et al. Intrinsic Inflammation Is a Potential Anti-Epileptogenic Target in the Organotypic Hippocampal Slice Model. Neurotherapeutics. 15, 470-488 (2018).
- Li, Q., Han, X., Wang, J. Organotypic hippocampal slices as models for stroke and traumatic brain injury. Molecular Neurobiology. 53 (6), 4226-4237 (2016).
- Cho, S., Wood, A., Bowlby, M. R. Brain slices as models for neurodegenerative disease and screening platforms to identify novel therapeutics. Current Neuropharmacology. 5, 19-33 (2007).
- Humpel, C. Organotypic brain slice cultures: a review. Neuroscience. 305, 86-98 (2015).
- Doussau, F., Dupont, J. L., Neel, D., Schneider, A., Poulain, B., Bossu, J. L. Organotypic cultures of cerebellar slices as a model to investigate demyelinating disorders. Expert Opinion on Drug Discovery. 12 (10), 1011-1022 (2017).
- Vismer, M. S., Forcelli, P. A., Skopin, M. D., Gale, K., Koubeissi, M. Z. The piriform, perirhinal, and entorhinal cortex in seizure generation. Frontiers in Neural Circuits. 9, 27(2015).
- Magalhães, D. M., Pereira, N., Rombo, D. M., Beltrão-Cavacas, C., Sebastião, A. M., Valente, C. A. Ex vivo model of epilepsy in organotypic slices - a new tool for drug screening. Journal of Neuroinflammation. 15, 203(2018).
- Ravizza, T., Balosso, S., Vezzani, A. Inflammation and prevention of epileptogenesis. Neuroscience Letters. 497 (3), 223-230 (2011).
- Liddelow, S. A., et al. Neurotoxic reactive astrocytes are induced by activated microglia. Nature. 541, 481-487 (2017).
- Wu, T. Complement C3 is activated in human AD brain and is required for neurodegeneration in mouse models of amyloidosis and tauopathy. Cell Reports. 28 (8), 2111-2123 (2019).
- Hartmann, K., et al. Complement 3+-astrocytes are highly abundant in prion diseases, but their abolishment led to an accelerated disease course and early dysregulation of microglia. Acta Neuropathologica Communications. 7, 83(2019).
- Nilsson, U. R., Funke, L., Nilsson, B., Ekdahl, K. N. Two conformational forms of target-bound iC3b that distinctively bind complement receptors 1 and 2 and two specific monoclonal antibodies. Upsala Journal of Medical Sciences. 116, 26-33 (2011).
Reprints and Permissions
