This protocol is designed to assist clinicians to measure regional tissue oxygenation at different body sites in infants and children. It can be used in situations where tissue oxygenation is potentially compromised, particularly during cardiopulmonary bypass, when using non-pulsatile cardiac-assist devices, and in critically ill neonates, infants and children.
Method Article
How to Administer Near-Infrared Spectroscopy in Critically ill Neonates, Infants, and Children
In This Article
Summary
Abstract
Near infrared spectroscopy (NIRS) calculates regional tissue oxygenation (rSO2) using the different absorption spectra of oxygenated and deoxygenated hemoglobin molecules. A probe placed on the skin emits light that is absorbed, scattered, and reflected by the underlying tissue. Detectors in the probe sense the amount of reflected light: this reflects the organ-specific ratio of oxygen supply and consumption - independent of pulsatile flow. Modern devices enable the simultaneous monitoring at different body sites. A rise or dip in the rSO2 curve visualizes changes in oxygen supply or demand before vital signs indicate them. The evolution of rSO2 values in relation to the starting point is more important for interpretation than are absolute values.
A routine clinical application of NIRS is the surveillance of somatic and cerebral oxygenation during and after cardiac surgery. It is also administered in preterm infants at risk for necrotizing enterocolitis, newborns with hypoxic ischemic encephalopathy and a potential risk of impaired tissue oxygenation. In the future, NIRS could be increasingly used in multimodal neuromonitoring, or applied to monitor patients with other conditions (e.g., after resuscitation or traumatic brain injury).
Introduction
Near-infrared spectroscopy (NIRS) noninvasively measures the regional tissue oxygen saturation (rSO2) in brain, muscle, kidneys, liver or intestines1,2,3,4,5,6,7,8,9. It is applied in intensive care and cardiac surgery to monitor “real-time” oxygen consumption and somatic tissue saturation10.
A probe on the skin emits near-infrared light (700 - 1000 nm)11 that penetrates tissue and bone up to a depth of approximately 1-3 cm, thereby being scattered, absorbed and reflected12. Detectors in the probe sense the amount of reflected light – representing the relative amount of deoxygenated haemoglobin – and calculate a numerical value that indicates the regional oxygenation saturation in percent (%)2. Unlike pulse oximetry (which reflects systemic oxygen supply and requires pulsatile flow), NIRS reflects venous oxygen saturation and does not require pulsatile flow, thus making it suitable for low-flow situations such as cardiopulmonary bypass7.
The rSO2 reflects the balance between oxygen supply and consumption in the tissue – changes in either become visible even before alterations become otherwise clinically evident. Changes relative to the baseline are more important than the absolute measured values themselves10,13,14,15,16. Measuring rSO2 helps clinicians monitor patients during heart surgery, cardiopulmonary bypass, and in the intensive care unit; it can also assist in guiding oxygen therapy in preterm infants and monitor kidney, splanchnic, and systemic perfusion12,17,18,19,20,21.
NIRS is a safe, feasible22, and simple way to monitor tissue oxygenation continuously. Combined with other cerebral biomarkers and neuromonitoring techniques (e.g., continuous or amplitude-integrated EEG), NIRS will likely play a role in future (multimodal) monitoring in neonates and children23,24. In this article, we show clinicians how to set up NIRS monitoring for different organ systems, explain how rSO2 values evolve corresponding to changes in physiology, and present typical results from different clinical settings.
Protocol
NIRS is conducted as part of the hospital’s clinical routine. It is recommended in pediatric cardiac surgery interventions within the scope of quality assurance from the Competence Network for Congenital Heart Defects (http://www.kompetenznetz-ahf.de), the Pediatric Cardio Anesthetic Working Group and the German Society for Cardiovascular Engineering25. The protocol follows the guidelines of the institution's human research ethics committee. We obtained written informed consent regarding filming and publication of the material from both parents of each infant appearing in the video. The protocol we present corresponds to the clinical practice in the hospital and applies to infants and children of any age. If there are special concerns for a specific age group, we indicate this in a note in the protocol.
1. Preparation
- Plug in and turn on the NIRS device. Enter the patient’s data according to the device’s setup.
- Select the proper probe according to the patient’s weight and intended site of use. The weight range is given on the probe’s packaging and depends on the manufacturer (see Table 1 for an overview of the weight ranges in common manufacturers).
- Make sure the patient’s skin is clean and dry for optimum adhesion. Dry the skin with a swab if necessary. Be very careful or omit cleaning if the skin is vulnerable.
2. Place the probe
- After identifying the correct probe position, carefully bend the center of the probe toward the side of the white cover until it starts to come off. Gently peel off the cover without touching the probe’s sticky surface.
- Place the sensor on the skin from the center of the probe to the sides. Make sure the edges of the probe are firmly connected to the skin. If the probe disconnects, wrong NIRS values will be obtained. Disconnection in a bright environment causes false high values; disconnection in a dark environment causes false low values.
NOTE: To avoid skin lesions, do not place the probe on very immature or vulnerable skin. If the probe must be placed on vulnerable skin, use a layer of cellophane between the skin and the probe, or leave the cover on. When fixing the probe, avoid putting pressure on it (e.g., via an infant flow cap or headband) as this can impair skin perfusion and cause an erroneous measurement.
3. Select the probe position
- Cerebral: Place the NIRS probe in the supra-orbital region on the forehead below the hairline to obtain values from the frontal cortex. Do not place the probe above hair, the frontal sinus, the temporal muscle, nevi, the superior sagittal sinus, intracranial hemorrhages or other anomalies, as that can alter the measurement and the values obtained will not represent regional tissue oxygenation. Placement of two probes, one on each forehead allows selective analysis of both hemispheres if the clinical setting requires this. Neighboring probes emit and measure signals alternately to avoid interference.
NOTE: The rSO2 value only reflects the oxygenation status of the tissue underneath the probe – for a large organ like the brain, obtained values do not reflect the entire organ‘s oxygenation status. - Somatic: Select a position above the region of interest. Avoid fat deposits, hair, and bones. Do not place the probe above nevi, hematoma, and injured skin. Always remember that the depth of the NIRS signal is approximately 2.5 cm - if the organ of interest is farther away from the probe, it cannot be analyzed. For renal or hepatic NIRS, use ultrasound to ensure correct placement.
- Kidneys: Locate the kidney via dorsal sagittal sonogram before placing the probe. Make sure that the skin-to-organ-distance does not exceed the maximum depth of the probe.
NOTE: The use of ultrasound may interfere with the minimal-handling principle (e.g., in very preterm infants). - Intestines: Place the probe in the region of interest (e.g., below the umbilicus or in the right or left lower quadrant).
NOTE: Free air or liquid in the abdomen can make measuring the desired organ’s tissue oxygenation impossible. - Liver: Place the probe exactly above the liver. If possible, confirm its position by ultrasound. To avoid measuring the wrong organ, make sure the liver tissue underneath the probe is at least as deep as the emitted light penetrates (1-3 cm, according to the probe selected).
- Foot: Place the probe on the plantar portion of the foot. Measuring NIRS in the most distant part of the body gives information about peripheral perfusion during hypothermia, in patients with shock or in any situation where pulse oximetry does not work.
- Muscle: Place the probe over the muscle of interest.
- Kidneys: Locate the kidney via dorsal sagittal sonogram before placing the probe. Make sure that the skin-to-organ-distance does not exceed the maximum depth of the probe.
4. Set the baseline
- 1-2 minutes after placing the probe, set the baseline by pushing the corresponding button on the device. The baseline reflects the starting point of the measurement. The evolution of tissue perfusion in each monitored area can be observed and interpreted individually by relying on the change from the baseline value.
5. Check for problems with the device or clinical complications
- If the device indicates bad recording quality or values are implausible, confirm that all the aforementioned steps have been taken correctly. If necessary, replace the probe and preamplifer, and check all electrical plug contacts.
- Check for external light sources that might affect the sensor and contact. Cover the probe light-tight if disturbing light sources cannot be eliminated.
- After ruling out technical problems, check the patient for clinical complications.
Results
The measured rSO2 value results from the ratio between oxygen supply and consumption (Figure 1A); differing metabolic characteristics lead to slightly different normal values depending on age and organ (Table 2). Note that - except for the brain – scientifically evaluated reference values exist only for preterm infants and newborns26,27,28,29,30,31 and most of the protocol steps rely on manufacturers’ recommendations, personal experience, and expert opinion (Table 3). This is due to the fact the values depend on the device and sensors used and reveal high inter-individual variability30,32. Critically low values and critical changes relative to the baseline originate from experience and expert opinion.
If the oxygen supply and demand are balanced at physiological values, tissue oxygenation is within normal range. Changes in either oxygen supply or consumption cause the rSO2 value to fall or rise (Figure 1B,1C). A typical curve revealing normal cerebral and renal NIRS values is displayed in Figure 2 from the beginning until 14:25 pm.
In the following, we provide examples to show how changes in underlying physiologic conditions affect rSO2. During heart surgery, doctors manipulate circulation in a controlled manner - therefore the effects on rSO2 are easy to observe. For example, clamping the descending aorta causes cerebral perfusion and the corresponding rSO2 to rise; perfusion of the lower body results in an rSO2 decrease (Figure 2). Another – non-surgical - cause of increased cerebral blood flow and elevated cerebral rSO2 is hyperdynamic shock in conjunction with high cardiac output (Figure 3).
In cold shock, a dropping renal rSO2 together with stable cerebral rSO2 can be the first sign; a decrease in both renal and cerebral rSO2 can occur later in the course23. Combined cerebral and renal NIRS can help identify early stages of shock in which cerebral perfusion is maintained at a normal level, but somatic perfusion is already impaired23.
When using two cerebral NIRS probes, values from the right and left sides should be similar - dissonance between the right and left channel NIRS can be caused by the NIRS sensor’s incomplete adhesion (Figure 4, red star) or indicate a complication: During some heart surgeries, the brain is perfused selectively via one carotid artery, making use of intracerebral collaterals (the circle of Willis) to supply the opposite side. Throughout this procedure, dissonance between the two cerebral NIRS channels can help diagnose a dysfunctional circle of Willis (Figure 5).
Another example of a complication discovered by NIRS is a dislocated vena cava superior cannula during cardiopulmonary bypass leading to venous stasis and lowered cerebral oxygen supply (Figure 6). The use of NIRS can help to identify impaired cerebral perfusion that would otherwise remain undetected and result in severe brain damage.
Besides heart surgery and cardiac intensive care, rSO2 measurements can also facilitate “standard” pediatric intensive care – complications and changes in therapy can be accompanied by changes in cerebral rSO2 (Figure 7).
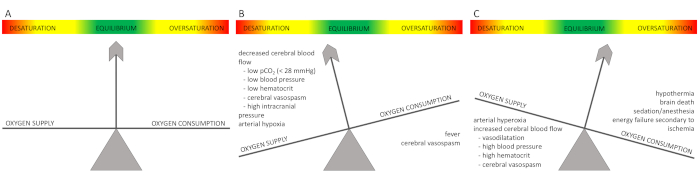
Figure 1: Balancing the ratio between oxygen supply and demand.
(A) Under physiologic conditions, oxygen supply and consumption are balanced, and regional tissue oxygenation is within normal range. (B) A decreasing cerebral rSO2 results from either increased oxygen consumption or decreased oxygen supply. Reasons for low or decreasing cerebral NIRS values are illustrated in the figure. For example, fever increases cerebral oxygen consumption by 10-13% per 1 °C increase in body temperature. Cerebral spasms can increase oxygen consumption by up to 150-250%. (C) An increase in cerebral rSO2 results from reduced oxygen consumption or increased oxygen supply. Reasons for high or rising cerebral NIRS values are provided in the figure. A cerebral rSO2 above 80%, caused by high cerebral blood flow after the loss of cerebral vascular autoregulation, is also called "luxury perfusion". Please click here to view a larger version of this figure.
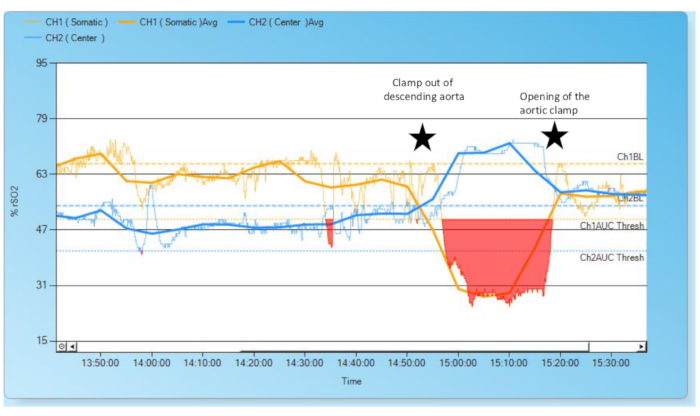
Figure 2: Evolution of cerebral and renal rSO2 during clamp out of the descending aorta.
Initially, cerebral (blue) rSO2 is lower than renal rSO2 (yellow), as in physiological conditions. During clamp-out of the descending aorta, cerebral blood flow increases while the lower half of the body is undersupplied. Thus, cerebral rSO2 rises and renal rSO2 drops. The red area indicates that renal rSO2 values are critically low because they decreased more than 25% below the baseline. After removing the aortic clamp and establishing reconstruction of the aorta and establishing normal circulation, both rSO2 curves normalize. Please click here to view a larger version of this figure.
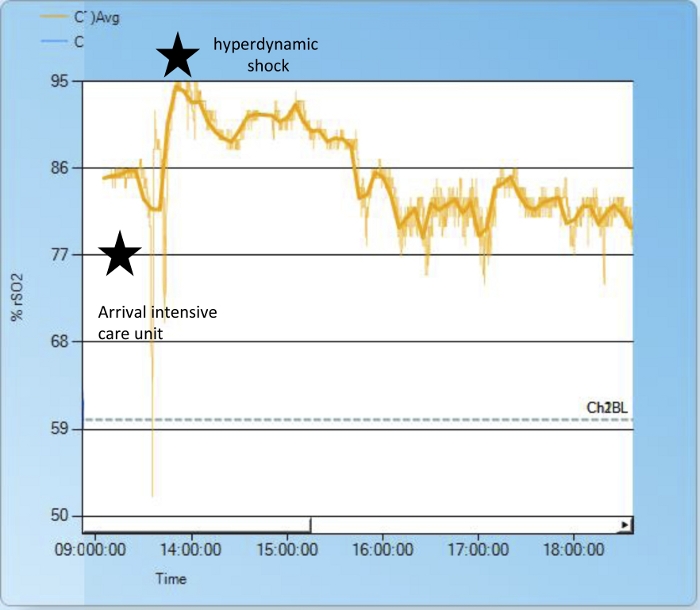
Figure 3: Hyperdynamic shock.
After arriving at the intensive care unit after cardiac surgery and changing respirator tubes, we experienced severe problems with mechanical ventilation (reaching only low tidal volumes at high ventilation pressures due to a defective filter). The patient developed hyperdynamic shock and respiratory acidosis with increased central venous saturation of 90% and increasing cerebral rSO2 up to 92%. After changing the filter, fluid resuscitation, and vasopressor treatment, the patient stabilized quickly and cerebral rSO2 normalized. Please click here to view a larger version of this figure.

Figure 4: Evolution of NIRS values during hypothermia and deep hypothermic cardiac arrest.
This figure illustrates how cerebral and renal NIRS values change under hypothermia, adjustment of cardiopulmonary bypass flow and in deep hypothermic cardiac arrest (arterial switch surgery in a patient with transposition of the great arteries and ventricular septal defect). The patient’s baselines rSO2 values are 59% (left, yellow) and 64% (right, blue) for the brain and 32% (green) for the left kidney. The blood supply to the lower half of the body depends on the ductus arteriosus. Intraoperatively-induced hypothermia reduces oxygen consumption, which leads to rising NIRS values, especially in the kidney. With increasing NIRS values we reduced the flow rate of cardiopulmonary bypass. Due to falling NIRS values caused by an altered metabolic situation (e.g., due to insufficiently deep anesthesia), the flow was adjusted again. During deep hypothermic cardiac arrest, renal and cerebral rSO2 fell to critically low values and rose again immediately after reestablishing physiological circulation. The red star with arrows shows two dips in the right cerebral NIRS curve due to incomplete probe adhesion. After gently remolding the sensor onto the skin, the values again run parallel to the left side’s. Please click here to view a larger version of this figure.
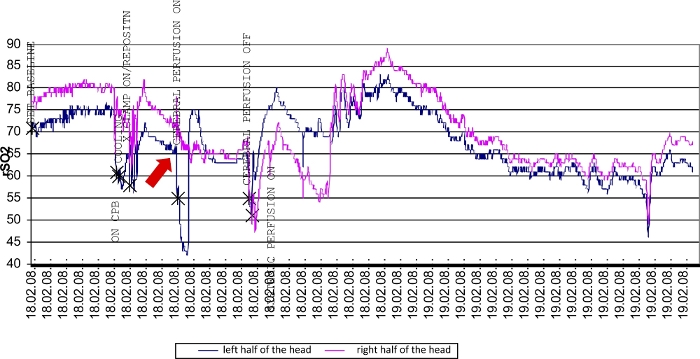
Figure 5: Dysfunctional circle of Willis during aortic arch surgery.
As soon as the brain is selectively perfused via the right carotid artery (red arrow), the rSO2 measured on the left side (dark blue) decreases because the intracerebral collaterals via the circle of Willis are insufficient. After placing an additional cannula in the left carotid artery, sufficient perfusion of both hemispheres and thus normal NIRS values are achieved. Please click here to view a larger version of this figure.
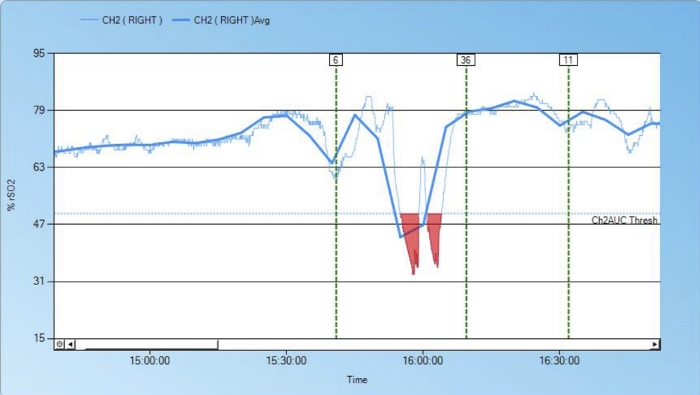
Figure 6: Detection of upper vena cava obstruction caused by a dislocated cardiopulmonary bypass cannula.
Shortly after the start of cardiopulmonary bypass (for closure of an atrial septal defect), cerebral NIRS values dropped. Troubleshooting showed that the venous cardiopulmonary bypass cannula had become dislocated, leading to occlusion of the superior vena cava and obstructed cerebral venous drainage. This caused a cerebral undersupply of oxygen, which was only detected through the low rSO2 value. After repositioning the superior vena cava cannula, venous flow was restored and NIRS values normalized. No. 6: start cardiopulmonary bypass; No. 36 aorta clamped; No. 11 end of ischemia. Please click here to view a larger version of this figure.
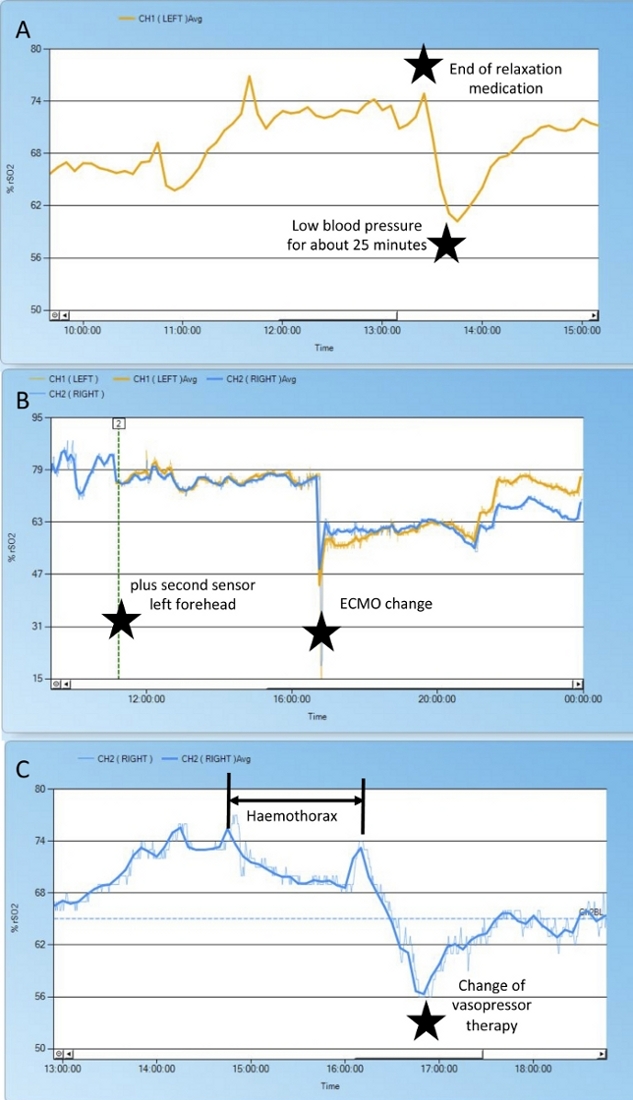
Figure 7: Changes in cerebral rSO2 in a pediatric patient.
After near drowning, this patient was put on extracorporeal membrane oxygenation. Due to side differences in arterial blood gas analyses, we put a second cerebral NIRS sensor in place (yellow). The end of muscle relaxation (A), change of extracorporeal membrane oxygenation system (B), blood pressure fluctuations (A, C), and the effect of a hemothorax (C) are reflected by changes in the NIRS curves. Please click here to view a larger version of this figure.

Figure 8: Placing the NIRS probe over hair.
(A) This patient has a lot of hair on the forehead. (B) The NIRS probe was still put in place. (C) The device indicates that the signal intensity is suboptimal. (D) The NIRS curve values and the course of the curve follow the actions during the surgical procedure (reconstruction surgery in Ebstein’s anomaly). Please note that the absolute values cannot be interpreted, even if they seem normal. Please click here to view a larger version of this figure.
| Manufacturer | Device | Age group | ||
| Neonates | Infants/Children | Adult | ||
| Casmed | Fore-Sight Elite | < 8 kg | ≥ 3 kg | ≥ 40 kg |
| Masimo | Root with O3 Oximetry | < 40 kg | < 40 kg | ≥ 40 kg |
| Medtronic | INVOS 5100C | < 5kg | 5-40 kg | > 40 kg |
| Medtronic | INVOS 7100C | - | - | > 40 kg |
| Nonin | SenSmart Model X-100 | < 40 kg | < 40 kg | > 40 kg |
Table 1: NIRS probes by manufacturer and weight range.
| Organ | Age group | Approximate values under physiologic conditions [%] | Critically low values | Critically high values | Critical relative change to baseline [%]E |
| [%] E | [%]E | ||||
| Brain | Preterm infants | 60 – 9026,27,30 | < 45 | > 90 | > 25 |
| Newborns | 60 – 9026,29,E | < 45 | > 80 | > 25 | |
| Infants/Children | 60 – 8026,E | < 45 | > 80 | > 25 | |
| Kidneys | Preterm infants | 70 – 9028,30 | < 40 | Not defined | > 25 |
| Newborns | 80 – 9526,29 | < 40 | > 25 | ||
| Infants/Children | Not defined, tend to be 5-15 % higher than cerebral values26,31,E | < 40 | > 25 | ||
| Intestines | Preterm infants | 18 – 8026,30 | Not defined | Not defined | Not defined |
| Newborns | 55 – 8026,29 | ||||
| Infants/Children | Not defined, tend to be 5-15 % higher than cerebral values26,E | ||||
| Liver | Not defined | Not defined | Not defined | Not defined | |
| Muscle | Not defined | Not defined | Not defined | Not defined | |
| EExperience/expert opinion | |||||
| Absolute values depend on the device and the sensors used, on the metabolic state, and show high interindividual variability. They should be interpreted with caution – if in doubt, the change relative to the baseline is more meaningful. | |||||
Table 2: Typical rSO2 values by organs and age group.
| Step | Level of evidence* | |
| Cleaning the skin before placing the NIRS probe | 5 | |
| Use of NIRS in neonates, infants and children of different ages | 1-5 | |
| Use of two NIRS sensors on the forehead | 5 | |
| Use of ultrasound to ensure correct placement of NIRS probes | 5 | |
| Placing NIRS probe in different positions (brain, liver, intestine, kidney, foot, muscles) | (1-)2-5 | |
| Interpreting NIRS values with respect to reference values | 2-5 | |
| *According to the Oxford Center of Evidence Based Medicine Evidence Levels: 1 – Systematic reviews of randomized controlled trials/randomized controlled trials with narrow confidence interval; 2 – Systematic reviews of cohort studies/individual cohort study or low quality randomized controlled trials; 3 – Systematic review of case-control studies/individual case-control studies; 4 – Case series and poor quality cohort and case-control studies; 5 – Expert opinion. | ||
Table 3: Levels of evidence of the protocol steps.
Discussion
This article illustrates how cerebral and somatic NIRS is set up in infants and children. Cerebral NIRS is used for monitoring purposes during procedures such as patent ductus arteriosus closure, surfactant administration, heart surgery and cardiopulmonary bypass; it is also used to monitor critically ill patients in intensive care, to predict necrotizing enterocolitis in preterm infants, and to predict outcome after hypoxic ischemic encephalopathy2,5,6,33,34,35,36,37,38,39,40. Further, NIRS can assist in guiding oxygen therapy in preterm infants17,18,19. Somatic NIRS helps to monitor kidney, splanchnic, and systemic perfusion12,20,21 and may also be valuable to detect complications during or after liver transplantation8,41,42. The simultaneous use of multiple probes (multisite NIRS) facilitates the detection of systemic hypoperfusion23,43.
For the NIRS measurement to function accurately, selecting the appropriate probe and position is crucial. Vulnerable skin may require the use of non-adhesive probes (for example by leaving the cover or attaching a layer of cellophane to the sticky side). However, the entire probe must be in firm contact with the skin; otherwise, the sensors will not provide reliable values (Figure 4 and Figure 8). A bright environment causes false high and dark environment false low values if the probe is not firmly attached to the skin. In case of poor recording quality (indicated by the device) or implausible values, troubleshooting starts by checking whether the above-mentioned essential steps have been carried out. If the problem persists, the probe and preamplifier should be replaced and all electrical plug contacts checked. External light sources acting on the sensor can also trigger incorrect values; covering the probes with a light-impermeable cover will remedy this. If abnormal NIRS values persist, the patient must be examined to rule out complications. The following parameters should be assessed and optimized: arterial blood pressure, systemic oxygenation, pH, hemoglobin, cerebral oxygen return (when the patient is on cardiopulmonary bypass)44.
To modify the standard use, there is no limit to the possible applications. It is possible to place a NIRS probe on any site of interest provided the skin is intact. Deriving values simultaneously from several sites enables a great variety of setups according to each specific clinical or scientific question. For example, NIRS and multisite NIRS can be used outside of critical care and even during exercise12.
Despite its ease of application and use, measuring rSO2 has some limitations that must be considered when interpreting values and curves. The values measured depend on the device and sensors used32. Absolute values should therefore be interpreted with caution - reference values cannot be transferred easily between devices and setups32. rSO2 values for organs other than the brain vary highly between individuals30. But even within one recording, values can fluctuate by up to 6% if a probe becomes detached and is then reattached45. Additionally, NIRS values depend on the individual’s metabolic state, which is altered by interventions such as therapeutic hypothermia and medication24.
Changes in tissue boundary conditions – for example the entry of blood or air due to surgery – also yield incorrect NIRS values46. In preterm infants’ first days of life, the transition from meconium to regular stool alters the fecal absorption spectra and can affect the measured intestinal rSO2 values47. Placing a NIRS probe over tissue other than the intended location produces inaccuracies in absolute values, but may still be helpful for monitoring trends7.
Despite its limitations, NIRS is a good means of noninvasively and continuously monitoring the oxygenation of a specific region in real time. Alternative methods for assessing global tissue perfusion are invasive and discontinuous: arterial blood draws, serum lactate concentration, central venous saturation or oxygen saturation of the jugular bulb. These can be particularly problematic in preterm infants, who frequently develop iatrogenic anemia due to repeated blood draws and whose cerebral rSO2 is impaired during arterial blood drawing48. In cases of low cardiac output, during extracorporeal membrane oxygenation or when non-pulsatile cardiac assist devices are in use, NIRS still functions – in contrast to pulse oximetry – as it does not require pulsatile flow and can even selectively monitor areas at risk for hypoxia7,49. rSO2 changes in these regions can serve as early signs of reduced cardiac output7. By these features, NIRS provides essential clinical information that currently cannot be obtained from other measures of tissue saturation.
The scope of applying rSO2 monitoring in neonatal and pediatric intensive care is likely to expand in the future. One potential application is monitoring cerebral hemodynamics after traumatic brain injury, which is already being investigated in adults50,51,52,53,54,55. In preterm infants, goal-directed oxygen supplementation may lead to better neurodevelopmental outcomes by reducing cerebral hypoxemia17,18,19. The combination of cerebral NIRS with other cerebral biomarkers may also be promising. For example, combining amplitude-integrated EEG and NIRS can help to determine prognosis in moderate hypoxic ischemic encephalopathy56. Possible further applications for this combination include compromised hemodynamics or seizures23.
In summary, NIRS is a promising technology with the potential for even broader application. Correctly applied and interpreted, rSO2 measurements help to detect complications or deteriorated clinical conditions at an early stage and guide therapy in various clinical settings. This protocol provides clinicians with the tools to set up and interpret rSO2 measurements at different body sites, and to interpret those results.
Disclosures
The authors have nothing to disclose.
Acknowledgements
We thank Carole Cürten for language editing. No funding was received for this video. NB received an internal research grant (IFORES) from the medical faculty of the University of Duisburg-Essen.
Materials
| Name | Company | Catalog Number | Comments |
|---|---|---|---|
| cotton swab | for skin cleaning | ||
| INVOS (Adult Regional Saturation Sensor) | Covidien/Medtronic | SAFB-SM | The adult regional saturation sensor Model SAFB_SM has been designed for cerebral-somatic monitoring of site-specific regional oxygen saturation (rSO2) in adult patients > 40 kg. |
| INVOS (Pediatric Regional Saturation Sensor) | Covidien/Medtronic | SPFB | The pediatric regional saturation sensor Model SPFB has been designed for cerebral-somatic monitoring of site-specific regional oxygen saturation (rSO2) in pediatric patients < 40 kg. |
| INVOS (preamplifier with Cable) | Covidien/Medtronic | 5100C- PA (Ch 1&2) | Amplifier connects NIRS sensors (Canal 1&2) to monitor 5100C. |
| INVOS (preamplifier with Cable) | Covidien/Medtronic | 5100C- PB (Ch 3&4) | Amplifier connects NIRS sensors (Canal 3&4) to monitor 5100C. |
| INVOS (Reusable Sensor Cable) | Covidien/Medtronic | RSC-1 - RSC-4 | The Reusable Sensor Cables are intended for multiple use. For use with SomaSensor SAFB-SM and SPFB. |
| INVOS 5100C Monitor (Cerebral/Somatic Oximeter) | Covidien/Medtronic | 5100C | Monitor for displaying and recording NIRS data. |
| INVOS Analytics Tool | Covidien/Medtronic | Version 1.2 | Evaluation and display of "Real Time" and Case History data. |
| OxyAlert NIRSensor (Cerebral/somatic -Neonatal) | Covidien/Medtronic | CNN/SNN | OxyAlert NIRSensors disposable sensor has a small adhesive pad with a gentle hydrocolloid adhesive for use with peadiatric, infant an neonatal patientes. Suitable for patients <5kg. |
| USB Flash Drive | Covidien/Medtronic | 5100C-USB | Collects and transfers Date to INVOS Analytics Tool |
References
- Yu, Y., et al. Cerebral near-infrared spectroscopy (NIRS) for perioperative monitoring of brain oxygenation in children and adults. The Cochrane Database of Systematic Reviews. 1 (6), 10947(2018).
- Schat, T. E., et al. Early cerebral and intestinal oxygenation in the risk assessment of necrotizing enterocolitis in preterm infants. Early Human Development. 131, 75-80 (2019).
- Ruf, B., et al. Intraoperative renal near-infrared spectroscopy indicates developing acute kidney injury in infants undergoing cardiac surgery with cardiopulmonary bypass: a case-control study. Critical Care. 19 (1), London, England. 27(2015).
- Kim, M. B., et al. Estimation of jugular venous O2 saturation from cerebral oximetry or arterial O2 saturation during isocapnic hypoxia. Journal of Clinical Monitoring and Computing. 16 (3), 191-199 (2000).
- Ricci, Z., et al. Multisite Near Infrared Spectroscopy During Cardiopulmonary Bypass in Pediatric Patients. Artificial Organs. 39 (7), 584-590 (2015).
- Hüning, B. M., Asfour, B., König, S., Hess, N., Roll, C. Cerebral blood volume changes during closure by surgery of patent ductus arteriosus. Archives of Disease in Childhood. Fetal and Neonatal Edition. 93 (4), 261-264 (2008).
- Mittnacht, A. J. C. Near infrared spectroscopy in children at high risk of low perfusion. Current Opinion in Anaesthesiology. 23 (3), 342-347 (2010).
- Shiba, J., et al. Near-infrared spectroscopy might be a useful tool for predicting the risk of vascular complications after pediatric liver transplants: Two case reports. Pediatric Transplantation. 22 (1), 13089(2018).
- Jöbsis, F. F. Noninvasive, infrared monitoring of cerebral and myocardial oxygen sufficiency and circulatory parameters. Science. 198 (4323), New York, N.Y. 1264-1267 (1977).
- Evans, K. M., Rubarth, L. B. Investigating the Role of Near-Infrared Spectroscopy in Neonatal Medicine. Neonatal Network. 36 (4), 189-195 (2017).
- Sakudo, A. Near-infrared spectroscopy for medical applications: Current status and future perspectives. Clinica Chimica Acta; International Journal of Clinical Chemistry. 455, 181-188 (2016).
- Schröer, S., et al. Multisite measurement of regional oxygen saturation in Fontan patients with and without protein-losing enteropathy at rest and during exercise. Pediatric Research. 85 (6), 777-785 (2019).
- Cerbo, R. M., et al. Cerebral and somatic rSO2 in sick preterm infants. The Journal of Maternal-Fetal & Neonatal Medicine. 25, Suppl 4 97-100 (2012).
- Koch, H. W., Hansen, T. G. Perioperative use of cerebral and renal near-infrared spectroscopy in neonates: a 24-h observational study. Paediatric Anaesthesia. 26 (2), 190-198 (2016).
- Nicklin, S. E., Hassan, I. A. A., Wickramasinghe, Y. A., Spencer, S. A. The light still shines, but not that brightly? The current status of perinatal near infrared spectroscopy. Archives of disease in childhood. Fetal and Neonatal Edition. 88 (4), 263-268 (2003).
- Sood, B. G., McLaughlin, K., Cortez, J. Near-infrared spectroscopy: applications in neonates. Seminars in Fetal & Neonatal Medicine. 20 (3), 164-172 (2015).
- Hyttel-Sorensen, S., et al. Cerebral near infrared spectroscopy oximetry in extremely preterm infants: phase II randomised clinical trial. BMJ (Clinical research ed). 350, 7635(2015).
- Plomgaard, A. M., et al. Early biomarkers of brain injury and cerebral hypo- and hyperoxia in the SafeBoosC II trial. PloS One. 12 (3), 0173440(2017).
- Pichler, G., et al. Cerebral Oxygen Saturation to Guide Oxygen Delivery in Preterm Neonates for the Immediate Transition after Birth: A 2-Center Randomized Controlled Pilot Feasibility Trial. The Journal of Pediatrics. 170, (2016).
- Kaufman, J., Almodovar, M. C., Zuk, J., Friesen, R. H. Correlation of abdominal site near-infrared spectroscopy with gastric tonometry in infants following surgery for congenital heart disease. Pediatric Critical Care Medicine. 9 (1), 62-68 (2008).
- DeWitt, A. G., Charpie, J. R., Donohue, J. E., Yu, S., Owens, G. E. Splanchnic near-infrared spectroscopy and risk of necrotizing enterocolitis after neonatal heart surgery. Pediatric Cardiology. 35 (7), 1286-1294 (2014).
- Fuchs, H., et al. Brain oxygenation monitoring during neonatal resuscitation of very low birth weight infants. Journal of Perinatology. 32 (5), 356-362 (2012).
- Variane, G. F. T., Chock, V. Y., Netto, A., Pietrobom, R. F. R., Van Meurs, K. P. Simultaneous Near-Infrared Spectroscopy (NIRS) and Amplitude-Integrated Electroencephalography (aEEG): Dual Use of Brain Monitoring Techniques Improves Our Understanding of Physiology. Frontiers in Pediatrics. 7, 560(2020).
- Garvey, A. A., Dempsey, E. M. Applications of near infrared spectroscopy in the neonate. Current Opinion in Pediatrics. 30 (2), 209-215 (2018).
- Deutsche Gesellschaft für Anästhesiologie und Intensivmedizin. Neuromonitoring in der Kardioanasthesie. Zeitschrift fur Herz-, Thorax- und Gefaschirurgie. 28 (6), 430-447 (2014).
- Alderliesten, T., et al. Reference values of regional cerebral oxygen saturation during the first 3 days of life in preterm neonates. Pediatric Research. 79 (1-1), 55-64 (2016).
- Lemmers, P. M. A., Toet, M., van Schelven, L. J., van Bel, F. Cerebral oxygenation and cerebral oxygen extraction in the preterm infant: the impact of respiratory distress syndrome. Experimental Brain Research. 173 (3), 458-467 (2006).
- Petrova, A., Mehta, R. Near-infrared spectroscopy in the detection of regional tissue oxygenation during hypoxic events in preterm infants undergoing critical care. Pediatric Critical Care Medicine. 7 (5), 449-454 (2006).
- Bernal, N. P., Hoffman, G. M., Ghanayem, N. S., Arca, M. J. Cerebral and somatic near-infrared spectroscopy in normal newborns. Journal of Pediatric Surgery. 45 (6), 1306-1310 (2010).
- McNeill, S., Gatenby, J. C., McElroy, S., Engelhardt, B. Normal cerebral, renal and abdominal regional oxygen saturations using near-infrared spectroscopy in preterm infants. Journal of Perinatology. 31 (1), 51-57 (2011).
- Dodge-Khatami, J., et al. Prognostic value of perioperative near-infrared spectroscopy during neonatal and infant congenital heart surgery for adverse in-hospital clinical events. World Journal for Pediatric & Congenital Heart Surgery. 3 (2), 221-228 (2012).
- Wolf, M., Naulaers, G., van Bel, F., Kleiser, S., Greisen, G. A Review of near Infrared Spectroscopy for Term and Preterm Newborns. Journal of Near Infrared Spectroscopy. 20 (1), 43-55 (2012).
- Roll, C., Knief, J., Horsch, S., Hanssler, L. Effect of surfactant administration on cerebral haemodynamics and oxygenation in premature infants--a near infrared spectroscopy study. Neuropediatrics. 31 (1), 16-23 (2000).
- Toet, M. C., Lemmers, P. M. A., van Schelven, L. J., van Bel, F. Cerebral oxygenation and electrical activity after birth asphyxia: their relation to outcome. Pediatrics. 117 (2), 333-339 (2006).
- Schat, T. E., et al. Near-Infrared Spectroscopy to Predict the Course of Necrotizing Enterocolitis. PloS One. 11 (5), 0154710(2016).
- Schat, T. E., et al. Abdominal near-infrared spectroscopy in preterm infants: a comparison of splanchnic oxygen saturation measurements at two abdominal locations. Early Human Development. 90 (7), 371-375 (2014).
- Lemmers, P. M. A., et al. Cerebral oxygenation and brain activity after perinatal asphyxia: does hypothermia change their prognostic value. Pediatric Research. 74 (2), 180-185 (2013).
- Peng, S., et al. Does near-infrared spectroscopy identify asphyxiated newborns at risk of developing brain injury during hypothermia treatment. American Journal of Perinatology. 32 (6), 555-564 (2015).
- Greisen, G. Cerebral blood flow and oxygenation in infants after birth asphyxia. Clinically useful information. Early Human Development. 90 (10), 703-705 (2014).
- Howlett, J. A., et al. Cerebrovascular autoregulation and neurologic injury in neonatal hypoxic-ischemic encephalopathy. Pediatric Research. 74 (5), 525-535 (2013).
- Hu, T., et al. Preliminary Experience in Combined Somatic and Cerebral Oximetry Monitoring in Liver Transplantation. Journal of Cardiothoracic and Vascular Anesthesia. 32 (1), 73-84 (2018).
- Perez Civantos, D. V., et al. Utility of Basal Regional Oximetry as an Early Predictor of Graft Failure After Liver Transplant. Transplantation Proceedings. 51 (2), 353-358 (2019).
- Hanson, S. J., Berens, R. J., Havens, P. L., Kim, M. K., Hoffman, G. M. Effect of volume resuscitation on regional perfusion in dehydrated pediatric patients as measured by two-site near-infrared spectroscopy. Pediatric Emergency Care. 25 (3), 150-153 (2009).
- Desmond, F. A., Namachivayam, S. Does near-infrared spectroscopy play a role in paediatric intensive care. BJA Education. 16 (8), 281-285 (2015).
- Greisen, G. Is near-infrared spectroscopy living up to its promises. Seminars in Fetal & Neonatal Medicine. 11 (6), 498-502 (2006).
- Ajayan, N., Thakkar, K., Lionel, K. R., Hrishi, A. P. Limitations of near infrared spectroscopy (NIRS) in neurosurgical setting: our case experience. Journal of Clinical Monitoring and Computing. 33 (4), 743-746 (2019).
- Isler, H., et al. Absorption spectra of early stool from preterm infants need to be considered in abdominal NIRS oximetry. Biomedical Optics Express. 10 (6), 2784-2794 (2019).
- Roll, C., Hüning, B., Käunicke, M., Krug, J., Horsch, S. Umbilical artery catheter blood sampling volume and velocity: impact on cerebral blood volume and oxygenation in very-low-birthweight infants. Acta Paediatrica. 95 (1), Oslo, Norway. 68-73 (2006).
- Fenik, J. C., Rais-Bahrami, K. Neonatal cerebral oximetry monitoring during ECMO cannulation. Journal of Perinatology. 29 (5), 376-381 (2009).
- Peters, J., Van Wageningen, B., Hoogerwerf, N., Tan, E. Near-Infrared Spectroscopy: A Promising Prehospital Tool for Management of Traumatic Brain Injury. Prehospital and Disaster Medicine. 32 (4), 414-418 (2017).
- Adelson, P. D., Nemoto, E., Colak, A., Painter, M. The use of near infrared spectroscopy (NIRS) in children after traumatic brain injury: a preliminary report. Acta Neurochirurgica. Supplement. 71, 250-254 (1998).
- Zeiler, F. A., et al. Continuous Autoregulatory Indices Derived from Multi-Modal Monitoring: Each One Is Not Like the Other. Journal of Neurotrauma. 34 (22), 3070-3080 (2017).
- Dekker, S. E., et al. Relationship between tissue perfusion and coagulopathy in traumatic brain injury. The Journal of Surgical Research. 205 (1), 147-154 (2016).
- Llompart-Pou, J. A., et al. Neuromonitoring in the severe traumatic brain injury. Spanish Trauma ICU Registry (RETRAUCI). Neurocirugia. , Asturias, Spain. (2019).
- Trehan, V., Maheshwari, V., Kulkarni, S. V., Kapoor, S., Gupta, A. Evaluation of near infrared spectroscopy as screening tool for detecting intracranial hematomas in patients with traumatic brain injury. Medical Journal, Armed Forces India. 74 (2), 139-142 (2018).
- Goeral, K., et al. Prediction of Outcome in Neonates with Hypoxic-Ischemic Encephalopathy II: Role of Amplitude-Integrated Electroencephalography and Cerebral Oxygen Saturation Measured by Near-Infrared Spectroscopy. Neonatology. 112 (3), 193-202 (2017).
Reprints and Permissions
