We describe a simple protocol to develop mucociliary epithelial organoids from deep ectoderm cells isolated from Xenopus laevis embryos. The multipotent progenitors regenerate epithelial goblet cell precursors and allow live tracking of the initiation and progression of the cell transitions on the surface of organoids.
Method Article
Mucociliary Epithelial Organoids from Xenopus Embryonic Cells: Generation, Culture and High-Resolution Live Imaging
In This Article
Summary
Abstract
Mucociliary epithelium provides the first line of defense by removing foreign particles through the action of mucus production and cilia-mediated clearance. Many clinically relevant defects in the mucociliary epithelium are inferred as they occur deep within the body. Here, we introduce a tractable 3D model for mucociliary epithelium generated from multipotent progenitors that were microsurgically isolated from Xenopus laevis embryos. The mucociliary epithelial organoids are covered with newly generated epithelium from deep ectoderm cells and later decorated with distinct patterned multiciliated cells, secretory cells, and mucus-producing goblet cells that are indistinguishable from the native epidermis within 24 h. The full sequences of dynamic cell transitions from mesenchymal to epithelial that emerge on the apical surface of organoids can be tracked by high-resolution live imaging. These in vitro cultured, self-organizing mucociliary epithelial organoids offer distinct advantages in studying the biology of mucociliary epithelium with high-efficiency in generation, defined culture conditions, control over number and size, and direct access for live imaging during the regeneration of the differentiated epithelium.
Introduction
Injury, infection, and disease of mucociliary epithelium are associated with impaired production and clearance of mucus which is often found in pulmonary disorders such as chronic obstructive pulmonary disease, asthma, cystic fibrosis, bronchiectasis, and primary ciliary dyskinesia1,2,3,4. A recent advance in organoid technology, for instance, the basal cell derived lung organoid called tracheosphere that recapitulates the regeneration of mucociliary epithelium arise as a promising model with therapeutic potential1,5,6. However, its use is currently limited, in part because of lack of the defined culture conditions and low efficiency in organoid productions. Mucociliary epithelium in the human airway and frog epidermis are remarkably similar in tissue morphology, cellular composition, and its function7,8,9,10,11,12. In both organisms, mucociliary epithelium provides first-line defense by secreting mucus and antimicrobial substances and clears harmful particles and pathogens through the synchronized action of cilia.
Here, we describe a simple protocol to generate mucociliary epithelial organoids using the multipotent progenitors of Xenopus laevis embryos13,14. Previously, we reported14 that in the absence of exogenous growth factors and the extracellular matrix, the microsurgically isolated deep cells from the early gastrula stage ectoderm spontaneously assemble into aggregates, regenerate epithelium on its surface, and mature into mucociliary epithelium by intercalating multiciliated and other accessory cells within 24 h. In addition to the rapid development, this protocol offers a distinct opportunity for directly accessing the transitions of multipotent deep ectoderm cells into epithelial goblet cell progenitors that recapitulate the regeneration steps of a disrupted epithelium14 which are not available from intact embryos and ectoderm (also known as the animal cap)15,16,17. The number and size of the organoids produced are scalable with high efficiency by controlling the starting materials from Xenopus embryos. Organoids in floating culture can be easily sorted and transferred at the desired stage for further analyses, including high-resolution imaging, mechanical testing, drug treatment, and genetic characterization14. This spontaneous, tissue mechanics-driven regeneration of the epithelium on the surface of embryonic cell aggregates results in mucociliary epithelial organoids and provide a novel three-dimensional (3D) model to study the biology of the mucociliary epithelium.
Protocol
Animal use and experimental protocols were approved by the institutional animal care and use committee (IACUC) of the Institute for Basic Science (IBS 18-01) and Korea Advanced Institute of Science and Technology (KA2017-22).
1. Embryos
- Obtain X. laevis embryos using a standard procedure: manually collect eggs from stimulated female frogs and perform in vitro fertilization18,19.
- De-jelly the fertilized embryos with gentle agitation for about 5 min in 2% cysteine in 1/3x modified Barth’s saline (MBS; see the recipe for 1X MBS below) at pH 819.
- Optional step for live imaging: to fluorescently label specific proteins and observe their dynamics in the organoid, proceed to section 5.
- (Optional) To monitor the contamination of superficial ectoderm cells within organoids, label the apical surface of the embryos with NHS-rhodamine at stage 914. Incubate embryos in 1 mg/mL NHS-Rhodamine in 1/3x MBS (pH 9.0) for 30 min with gentle nutation. Wash embryos three times by transferring to a Petri dish filled with 1/3x MBS for 15 min.
- Culture the embryo in 1/3x MBS at the preferred temperature (14–26 °C) until the first signs of stage 10 are detected (i.e., the appearance of dark pigmented cells around the blastopore at the vegetal view).
2. Preparation of microsurgical tools, solutions, and culture vessels
- Prepare the tools needed including a pair of surgical grade forceps and hair tools (hair loop and hair knife) for microsurgery20.
- Prepare the following culture media for embryos: 1/3X MBS, where 1X MBS is made with NaCl (88 mM), KCl (1 mM), NaHCO3 (2.4 mM), MgSO4 (0.82 mM), Ca(NO3)2 (0.33 mM), CaCl2 (0.41 mM), and HEPES (10 mM). Adjust pH to 7.4 with 10 M NaOH.
NOTE: Optional: add drops of phenol red to indicate pH. - Prepare the following culture media for embryonic tissues and organoids: Danilchik’s for Amy (DFA)21 supplemented with fresh 1% antibiotic and antimycotic solution. Prepare DFA with NaCl (53 mM), Na2CO3 (5 mM), potassium gluconate (4.5 mM), sodium gluconate (32 mM), CaCl2 (1 mM), and MgSO4 (1 mM). Adjust pH to 8.3 with granular Bicine. Filter DFA (0.2 μm bottle-top filter), aliquot and store it at -20 °C.
- Prepare calcium- and magnesium-free DFA for separating deep cells from ectoderm by using the recipe above and omitting CaCl2 and MgSO4. Aliquot and store at-20 °C.
- Prepare non-adhesive PCR tubes for embryonic cell aggregation.
- To induce spontaneous aggregation of the isolated embryonic cells, prepare non-adhesive PCR tubes by coating round-bottomed PCR tubes with 200 μL of 1% BSA (1 g of BSA in 100 mL of distilled water) overnight at 4 °C or for 2 h at room temperature. Each tube will be used to assemble one organoid.
- Rinse BSA-coated PCR tubes with DFA three times to remove any residual BSA.
- Fill PCR tubes with 200 μL of DFA.
3. Isolation of deep ectoderm cells
- Select and gather embryos as they reach early stage 10 using hair tools under a stereoscope.
- Using a disposable transfer pipette, transfer the selected embryos into a DFA-filled Petri dish.
- Remove the vitelline membrane of the embryos using sharp forceps from the vegetal side without disrupting the animal side of the embryo.
NOTE: Be careful to avoid exposing embryos to the air. Introducing air bubbles into the solution or bringing embryos to the surface will cause the embryo to burst. - To isolate the animal cap, position the animal side of the embryo up.
- Visually estimate the extent of the animal cap to be excised and make the first incision along the edge of the animal cap with a hair knife. Pull the hair knife outward to make a cut.
- Repeat step 3.5 to create a chain of small cuts to excise the animal cap.
- Trim the thick-layered edge of the animal cap using a hair knife to prevent the inclusion of mesoderm precursors.
NOTE: To prevent the healing and aggregation of isolated animal caps, proceed to the next step within 10 min. Typically, we isolate 5–10 animal caps at a time to assemble multiple organoids. - To separate deep ectoderm cells from the animal cap, transfer the excised animal caps to a Petri dish filled with calcium- and magnesium-free DFA with a disposable transfer pipette. Be careful not to introduce any air bubbles during the transfer.
- To keep enough space for the next steps, using the hair tools, position the animal caps to face the animal-side up and maintain a generous distance from other explants.
- Wait for 5–10 min and then monitor the explants under a stereoscope. Once loosened deep cells have been found from the edge of the dark-pigmented superficial layer, begin lifting the superficial layer away from the light-colored deep ectoderm cells using a hair knife under the stereoscope.
- Carefully detach (peel-off) the superficial layer with a hair knife, starting at the edge.
- Collect the deep ectoderm cells with minimum aspiration (10‒15 μL) to limit the amount of calcium- and magnesium-free DFA that is transferred to the aggregation media in the next step.
NOTE: Detached superficial cells can be removed from the media to prevent contaminating the remaining deep ectoderm cells.
4. Generation of mucociliary epithelial organoids
- Transfer collected deep ectoderm cells to a non-adhesive PCR tube containing 200 μL of DFA. Gently pipette the media (2‒3 times) to disperse transferred cells in the PCR tube.
NOTE: The timing designated as hours post aggregation (hpa) starts at this step. The size of the resulting organoids is controlled by the number of deep ectoderm cells added to a PCR tube. Deep ectoderm cells from one or more animal caps can be used, depending on the desired size of the organoid. - Close the PCR tube. Keep PCR tubes upright to induce spontaneous aggregation at the bottom.
- Monitor the aggregation process under a stereoscope. Cells typically gather at the bottom of the PCR tube within an hour and assemble into spherical aggregates within 2–3 h, depending on the size.
- To conduct live imaging or drug testing during the development of the mucociliary epithelial organoids, collect aggregates at 2 hpa using a 200 µL pipette fitted with enlarged tips (cut with sterilized scissor) to avoid causing damage to the aggregates during collection.
- To allow aggregates to develop into the mucociliary epithelial organoid in culture, collect spherical aggregates from the PCR tube at 5 hpa and transfer them to a DFA-filled Petri dish.
- Position the aggregates far from others to prevent them from fusing. Within 24 h of culture at room temperature without any added factors, mature mucociliary epithelial organoids can be observed to be rotating with the action of beating cilia covering the surface of the differentiated epithelium
5. (Optional) High-resolution live imaging of developing organoids
- Prepare mRNA for microinjection.
- To visualize the epithelialization that occurs at the initial stage of organoid formation, prepare mRNA for the epithelial-specific zonula occludens protein-1 (ZO-1) and for outlining the cell membranes by amplifying pCS2-ZO1-RFP and pCS2-mem-GFP plasmids (a gift from Lance Davidson).
- Extract and linearize the plasmid DNA, and then transcribe the capped mRNA using an SP6/T7 in vitro transcription kit.
- Aliquot the transcribed mRNA and store it at -80 °C.
- Microinject the mRNA into a fertilized embryo
- Place fertilized embryos in 3% Ficoll in 1x MBS.
- Load 3–4 μL of mRNA using a micro-loader tip into a pulled glass needle (a long and fine tapered needle tip with inner diameter of 10‒30 µm).
- Attach the needle to a microinjector and adjust the time and pressure to deliver a constant volume of mRNA for microinjection.
- Inject the mRNA just under the apical surface of the animal pole. A distinct pale-colored circular patch that is caused by the expansion of the cortex is visible at the time of microinjection.
- Transfer the injected embryos to 1/3X MBS and culture them to stage 9.5.
- Collect the fluorescently labeled embryos under a fluorescence stereoscope (excitation/emission settings for GFP (488/510) and RFP (532/588)).
- Proceed with step 1.3.
- Assemble and culture the organoid (sections 3 and 4) until the desired stage of development.
- Perform live imaging.
- Prepare a glass-bottom imaging chamber by gluing a cover glass to a custom-milled acrylic chamber using silicon grease.
NOTE: Tightly seal the chamber to prevent leakage of the culture media. - Fill the imaging chamber with DFA.
- Pick one hexagonal transmission electron microscopy (TEM) grid (75 mesh) from a container using forceps and apply a tiny amount of grease to the edge of the grid.
NOTE: The size of the mesh should be smaller than the diameter of the aggregate so that the aggregate sits on the grid. - Press down lightly to secure the TEM grid to the bottom of the imaging chamber.
- Transfer the aggregates to the imaging chamber and position them within the grid.
NOTE: Avoid positioning the aggregates next to the grease. Throughout the experiment, the aggregates should sit on the TEM grid without contacting the bottom of the chamber to prevent physical compression. - Fill up the imaging chamber with DFA and seal it with a cover glass and grease.
NOTE: The chamber should be airtight with no air bubbles to prevent any turbulence or movement during imaging. - To follow the progression of mucociliary epithelial organoid formation, collect time-lapse z-stack images of aggregates (from 2 hpa) using a confocal microscope.
NOTE: We typically collect ~120 µm-thick z-stacks every 15 min using a 20X objective to follow the dynamic cell behaviors, but these specifications should be optimized for the goal of experiments.
- Prepare a glass-bottom imaging chamber by gluing a cover glass to a custom-milled acrylic chamber using silicon grease.
6. (Optional) Imaging developing organoids by fixation and immunostaining
- Fix organoids at the desired stage of development by transferring them to a glass vial filled with a fixative solution.
NOTE: Add a volume of fixative solution that is >20 times that of the samples to ensure complete fixation. Perform the following processes on a nutator unless otherwise noted. In general, organoids are fixed with 4% paraformaldehyde (PFA) in PBS. However, different fixatives may be required to detect specific proteins. For example, we used 4% PFA with 0.25% glutaraldehyde in PBS to detect F-actin and acetylated tubulin. To detect intelectin (ITLN) and ZO-1, organoids are fixed with ice-cold Dent’s solution (4:1 methanol:dimethyl sulfoxide) for overnight at -20 °C. Dent’s fixed organoids should be serially dehydrated before washing (step 6.3). Duration for antibody incubation and washing can be optimized for specific needs. - Fix organoids for 15 min at room temperature (RT) or overnight at 4 °C.
- Wash 3 times with PBST (PBS with 0.1% Triton X-100) for 15 min at RT.
- Block unspecific binding with 10% goat serum in PBST (PBSGT) for 1 h at RT.
- Incubate with primary antibody (1:200) in PBSGT overnight at 4 °C.
- Wash 3 times with PBST for 15 min at RT.
- Incubate with secondary antibody (1:200) in PBSGT overnight at 4 °C.
- Wash 3 times with PBST for 15 min at RT.
- Transfer the fixed and immunostained organoids to an imaging chamber and proceed with confocal imaging.
Results
This standardized protocol generates a mucociliary epithelial organoid from multipotent progenitors isolated from the early gastrula stage X. laevis embryos within 24 h of cultivation14. Collected deep ectoderm cells self-assemble to form an aggregate in a non-adhesive PCR tube and undergo surface epithelialization and goblet cell differentiation. The newly epithelialized surface of aggregates provides a substrate similar to the native epithelium found in vivo for intercalating inner cells (e.g., multiciliated and other accessory cells) and develops to form mucociliary epithelial organoids (Figure 1A,B). Within 24 h after aggregation, self-organized mucociliary epithelial organoids regenerate a mature epidermis that is indistinguishable from the epidermis of a tadpole. The organoids comprise fully differentiated epithelium (keratin), mucus-secreting goblet cells (ITLN), multiciliated cells (acetylated tubulin), and small secretory cells (peanut agglutinin, PNA) (Figure 1C).
In addition to confirming the development of different cell types with immunostaining, the dynamics of organoid development can be followed by live imaging (Figure 2A). To examine the epithelialization that emerges at the early stage of organoid formation (Figure 1B), we labeled embryos by expressing fluorescently tagged tight junction proteins (ZO-1-RFP) and membrane localizing proteins (mem-GFP). With dual-labeling, the sequential steps of ZO-1-positive tight junction formation can be marked and quantitatively analyzed during epithelialization (Figure 2). For example, for cells (Figure 2B, green-colored) at different stages of epithelialization (at 0 min), some regions of cell-cell adhesion have scattered puncta of ZO-1 (Figure 2B, green arrows). In contrast, other areas have fully assembled, contiguous ZO-1 expression (Figure 2B, yellow arrows). Over time, the puncta coalesce and connect to form contiguous tight junctions (Figure 2B, green arrows), and contiguous tight junctions maintain their morphology even during cell division (Figure 2B, yellow arrows). As the tight junctions mature, cells dynamically move in and out of the surface along the apical planes of the organoids (Figure 2C,D). Furthermore, by tracking cells spatiotemporally on the surface of differentiating organoids (Figure 2B, color-coded cells), multi-scale analysis is possible, ranging from individual puncta to contiguous tight junctions, cell-cell boundaries, and subsets of cell populations within organoids.

Figure 1: Generation of mucociliary epithelial organoids.
(A) A schematic showing the protocol to assemble deep ectoderm aggregates from X. laevis embryos. (B) A schematic for a model of mucociliary epithelial organoid formation originating from multipotent deep ectoderm cells (cross-sectional view). Surface-positioned cells transit into epithelial cells and differentiate into goblet cells. Differentiating ciliated cells, secretory cells, and ionocytes radially intercalate into the surface and regenerate a mature epidermis. (C) Maximum z-projection of mucociliary epithelium immunostained for ITLN (mucus-producing goblet cells), acetylated tubulin (ciliated cells), PNA (small secretory cells), and keratin (epithelial cells) in organoids at 24 hpa (upper panel) and tadpole epidermis (lower panel). Scale bar = 30 μm. Please click here to view a larger version of this figure.
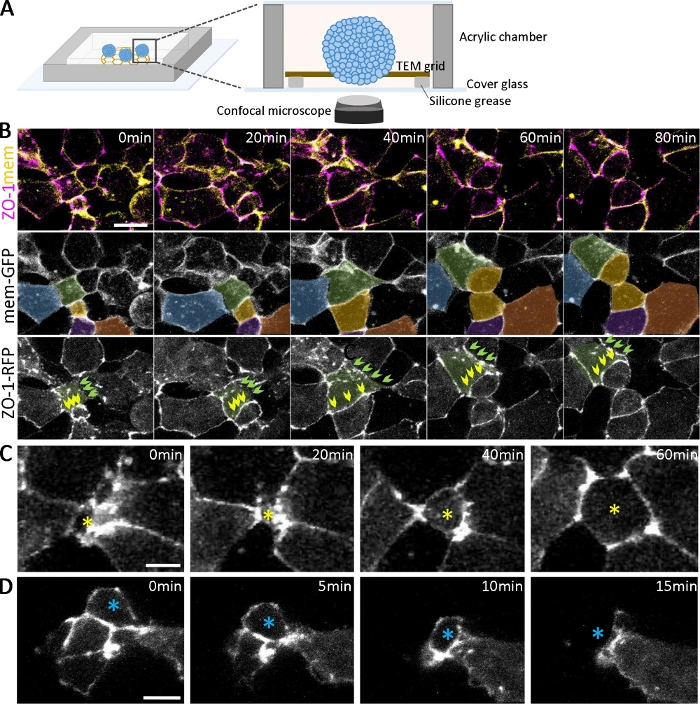
Figure 2: Live imaging of developing organoids.
(A) A schematic of the imaging chamber for live organoids (not to scale). (B) Time-lapse sequences of confocal stacks collected from deep ectoderm cell aggregates expressing ZO-1-RFP and mem-GFP from 2.5 hpa. Scale bar = 20 μm. Cells are pseudo-colored for tracking over time. Green-colored cell have different cell adhesion statuses, including one progressively developing ZO-1 positive adhesion (green arrows) and one maintaining contiguous ZO-1 positive adhesion (yellow arrows) over time. (C, D) Time-lapse confocal images of ZO-1-RFP-expressing deep ectoderm cell aggregates show the radially intercalating cells moving to the surface (C, yellow star) and moving inside the aggregates (D, blue star). Scale bars = 10 μm. Please click here to view a larger version of this figure.
Discussion
Mucociliary epithelial organoids generated from deep ectoderm cells of X. laevis embryo are a powerful tool to study the epithelialization and differentiation of multipotent progenitors in vitro. In contrast to the widely adopted animal cap assay16 used for in vitro organogenesis13 and the development of mucociliary epithelia15,17,22 that utilize the intact ectoderm, the deep ectoderm-derived organoids presented in this protocol offer a distinct opportunity to monitor the tissue mechanics-driven regeneration phases of the surface epithelium14. At around 2 hpa, the newly generated ZO-1 positive epithelial cells (Figure 2) begin to appear on the apical surface of organoids and increase their population to cover the entire organoid as the tissue solidify or reduces the compliance14. The regeneration of the epithelium and subsequent lineage specifications for mucus-producing goblet cells proceed spontaneously in a chemically defined culture media within a day. These rapidly developing mucociliary epithelial organoids provide a platform to examine dynamic cell behaviors in real-time, in high-resolution, during progressive steps of epithelial regeneration. They also enable investigation of fundamental questions that arise during mucociliary epithelium development, homeostasis, and associated diseases2,9,23. In particular, the mechanical sensitivity of the deep progenitor cells during the transition to epithelial goblet cell precursors identified in the organoids14 may serve to link respiratory diseases associated with abnormal basal differentiation where mucus-secreting goblet cells are over- or under-produced23.
While this protocol offers a simple approach to generate these organoids, there are several critical steps for success in experiments. To prevent contamination of superficial epithelial cells during the isolation of deep ectoderm cells from the animal cap, one should monitor the animal cap placed in calcium- and magnesium-free DFA under a stereoscope and detect the right time to initiate the separation of the dark-pigmented superficial layer of the animal cap. If the tissue is kept in calcium- and magnesium-free DFA for too long, the entire tissue will dissociate and distinguishing between deep and superficial cells would then be impossible for deep ectoderm aggregates. To confirm the absence of superficial cells in deep ectoderm aggregates, we recommend fluorescently labeling the apical surface of the embryo with NHS-rhodamine (step 1.414) prior to microsurgery; this would allow for easy identification of surface cells if they exist in the resultant organoids. Since epithelial regeneration is regulated by tissue mechanics14, it is essential to avoid unintended force generation for self-organizing organoids. In particular, we suggest avoiding contact with the glass bottom of the imaging chamber during live imaging by placing aggregates at the edges of the TEM grids as this allows for free contact with the imaging window of live aggregates (step 5.1.2.). This in vitro-cultured, self-organized 3D model for mucociliary epithelium will serve as a tractable tool to answer the fundamental questions that arise during the regeneration of epithelium and the lineage specification of goblet cells.
Disclosures
The authors have nothing to disclose.
Acknowledgements
We thank members of Kim lab and Lance Davidson for their comments and support. This work was supported by Young Scientist Fellowship to HYK from Institute for Basic Science (IBS-R0250Y1).
Materials
| Name | Company | Catalog Number | Comments |
|---|---|---|---|
| Equipment | |||
| Dual-stage Glass Micropipette Puller | Narishige | PC-100 | |
| Picoliter microinjector | Warner Instruments | PLI-100A | |
| Confocal Laser Microscope | |||
| Stereoscope | |||
| Tools | |||
| Forcep | Dumont | Dumont #5 | |
| Hair knife | Reference (Kay, B.K.; Peng, H.B., 1991) | ||
| Hair loop | Reference (Kay, B.K.; Peng, H.B., 1991) | ||
| hCG injection | |||
| human chorionic gonadotropin | Sigma | cg10-10vl | |
| MBS solution | |||
| 10M Sodium hydroxide | Sigma | 72068 | |
| Calcium chloride | Sigma | C3881 | |
| Calcium nitrate | Sigma | C1396 | |
| HEPES | Sigma | H4034 | |
| Magnesium sulfate | Sigma | 230391 | |
| Phenol-red | Sigma | P0290 | |
| Potassium chloride | Sigma | 7447-40-7 | |
| Sodium bicarbonate | Sigma | S6014 | |
| Sodium chloride | Sigma | S9625 | |
| Sodium hydroxide reagent grade, 97%, powder-25g | Sigma | 655104 | |
| dejellying solution | |||
| L-Cysteine hydrochloride monohydrate | Sigma | C7880 | |
| Sodium hydroxide 10M | Sigma | 72068 | |
| Ficoll solution | |||
| Ficoll | Sigma | F4375 | |
| DFA solution | |||
| Sodium chloride | Sigma | S9625 | |
| 0.22mm Filter | Millipore | S2GPT05RE | |
| Antibiotic Antimycotic Solution | Sigma | A5955 | |
| Bicine | Sigma | B3876 | |
| Calcium chloride | Sigma | C3881 | |
| Magnesium sulfate | Sigma | 230391 | |
| Potassium gluconate | Sigma | G4500 | |
| Sodium carbonate | Sigma | 222321 | |
| Sodium gluconate | Sigma | G9005 | |
| mRNA in vitro transcription | |||
| SP6/T7 in vitro transcription kit | Invitrogen | AM1340 | |
| mRNA microinjection | |||
| Borosilicate glass capillary tubes | Harvard Apparatus | GC100-10 | |
| Eppendorf microloader pipette tips | ThermoFisher | A25547 | |
| Mineral oil | Sigma | M5904 | |
| PCR tube coating | |||
| BSA | Thermofisher | 26140079 | |
| PCR tubes | SSI | SSI-3245-00 | |
| Imaging | |||
| Custom-milled acrylic chamber | |||
| Coverglass 24mmX50mm | Duran | B01_001650 | |
| SPI Hexagonal TEM Grids, Gilded Nickel (50mesh) | SPI | 275HGN-XA | |
| SPI Hexagonal TEM Grids, Gilded Nickel (75mesh) | SPI | 2775GN-XA | |
| Silicone grease | Shinetsu | HIVAC-G | |
| Fixation | |||
| 20ml screw top-cap vial | Wheaton | WH.986580 | |
| 2ml screw top-cap vial | |||
| Benzyl alcohol | Sigma | 305197 | |
| Benzyl benzoate | Sigma | B6630 | |
| Dimethyl sulfoxide (DMSO) | Sgima | D4540 | |
| Glutaraldehyde 10% EM GRADE | Electron Microscopy Sciences | 16120 | |
| Goat serum | Jackson | 005-000-121 | |
| Methanol | Sigma | 322415 | |
| Paraforlamdehyde | Sigma | P6148 | |
| Phosphate-buffered saline (PBS) | LPS Solution | CBP007B | |
| Triton X-100 | Sigma | T8787 | |
| Primary antibody (1:200) | |||
| acetylated tubulin | Sigma | clone 6-11B-1 | |
| Itln1 | Proteintech | 11770-1-AP | |
| Keratin | Developmental Studies Hybridoma Bank | 1h5 | |
| ZO1 | Invitrogen | 402200 | |
| Vectors | |||
| pCS2-mem-GFP | Gift from Dr. Lance Davidson | ||
| pCS2-ZO1-RFP | Gift from Dr. Lance Davidson |
References
- Barkauskas, C. E., et al. Lung organoids: current uses and future promise. Development. 144 (6), 986-997 (2017).
- Puchelle, E., Zahm, J. M., Tournier, J. M., Coraux, C. Airway Epithelial Repair, Regeneration, and Remodeling after Injury in Chronic Obstructive Pulmonary Disease. Proceedings of the American Thoracic Society. 3 (8), 726-733 (2006).
- Tilley, A. E., Walters, M. S., Shaykhiev, R., Crystal, R. G. Cilia dysfunction in lung disease. Annual Review of Physiology. 77, 379-406 (2015).
- Vareille, M., Kieninger, E., Edwards, M. R., Regamey, N. The Airway Epithelium: Soldier in the Fight against Respiratory Viruses. Clinical Microbiology Reviews. 24 (1), 210-229 (2011).
- Rock, J. R., et al. Basal cells as stem cells of the mouse trachea and human airway epithelium. Proceedings of the National Academy of Sciences of the United States of America. 106 (31), 12771-12775 (2009).
- Sachs, N., et al. Long-term expanding human airway organoids for disease modeling. The EMBO Journal. 38 (4), 100300(2019).
- Dubaissi, E., et al. A secretory cell type develops alongside multiciliated cells, ionocytes and goblet cells, and provides a protective, anti-infective function in the frog embryonic mucociliary epidermis. Development. 141 (7), 1514-1525 (2014).
- Hayes, J. M., et al. Identification of novel ciliogenesis factors using a new in vivo model for mucociliary epithelial development. Developmental Biology. 312 (1), 115-130 (2007).
- Walentek, P., Quigley, I. K. What we can learn from a tadpole about ciliopathies and airway diseases: Using systems biology in Xenopus to study cilia and mucociliary epithelia. Genesis. 55 (1-2), (2017).
- Werner, M. E., Mitchell, B. J. Understanding ciliated epithelia: The power of Xenopus. Genesis. 50 (3), 176-185 (2012).
- Dubaissi, E., Papalopulu, N. Embryonic frog epidermis: a model for the study of cell-cell interactions in the development of mucociliary disease. Disease Models & Mechanisms. 4 (2), 179-192 (2011).
- Walentek, P., et al. A novel serotonin-secreting cell type regulates ciliary motility in the mucociliary epidermis of Xenopus tadpoles. Development. 141 (7), 1526-1533 (2014).
- Asashima, M., et al. In vitro organogenesis from undifferentiated cells in Xenopus. Developmental Dynamics. 238 (6), 1309-1320 (2009).
- Kim, H. Y., Jackson, T. R., Stuckenholz, C., Davidson, L. A. Tissue mechanics drives regeneration of a mucociliated epidermis on the surface of Xenopus embryonic aggregates. Nature Communications. 11 (1), 665(2020).
- Haas, M., et al. DeltaN-Tp63 Mediates Wnt/beta-Catenin-Induced Inhibition of Differentiation in Basal Stem Cells of Mucociliary Epithelia. Cell Reports. 28 (13), 3338-3352 (2019).
- Green, J. Molecular Methods in Developmental Biology: Xenopus and Zebrafish. Guille, M. , Humana Press. 1-13 (1999).
- Stubbs, J. L., Davidson, L., Keller, R., Kintner, C. Radial intercalation of ciliated cells during Xenopus skin development. Development. 133 (13), 2507-2515 (2006).
- Nieuwkoop, P. D., Faber, J. Normal table of Xenopus laevis (Daudin) : a systematical and chronological survey of the development from the fertilized egg till the end of metamorphosis. , Garland Pub. (1994).
- Sive, H. L., Grainger, R. M., Harland, R. M. Early development of Xenopus laevis : a laboratory manual. , Cold Spring Harbor Laboratory Press. (2000).
- Joshi, S. D., Kim, H. Y., Davidson, L. A. Microscopy tools for quantifying developmental dynamics in Xenopus embryos. Methods in Molecular Biology. 917, 477-493 (2012).
- Sater, A. K., Steinhardt, R. A., Keller, R. Induction of neuronal differentiation by planar signals in Xenopus embryos. Developmental Dynamics. 197 (4), 268-280 (1993).
- Sedzinski, J., Hannezo, E., Tu, F., Biro, M., Wallingford, J. B. Emergence of an Apical Epithelial Cell Surface In Vivo. Developmental Cell. 36 (1), 24-35 (2016).
- Rock, J. R., Randell, S. H., Hogan, B. L. M. Airway basal stem cells: a perspective on their roles in epithelial homeostasis and remodeling. Disease Models & Mechanisms. 3 (9-10), 545-556 (2010).
Reprints and Permissions
