Structural studies of biomacromolecules by crystallography require high-quality crystals. Here we demonstrate a protocol that can be used by OptiCrys (a fully automated instrument developed in our lab) and/or microdialysis buttons for growing large high-quality crystals based on knowledge of the crystallization phase diagram.
Method Article
Optimization of Crystal Growth for Neutron Macromolecular Crystallography
In This Article
Summary
Abstract
The use of neutron macromolecular crystallography (NMX) is expanding rapidly with most structures determined in the last decade thanks to new NMX beamlines having been built and increased availability of structure refinement software. However, the neutron sources currently available for NMX are significantly weaker than equivalent sources for X-ray crystallography. Despite advances in this field, significantly larger crystals will always be required for neutron diffraction studies, particularly with the tendency to study ever-larger macromolecules and complexes. Further improvements in methods and instrumentation suited to growing larger crystals are therefore necessary for the use of NMX to expand.
In this work, we introduce rational strategies and a crystal growth bench (OptiCrys) developed in our laboratory that combines real-time observation through a microscope-mounted video camera with precise automated control of crystallization solutions (e.g., precipitant concentration, pH, additive, temperature). We then demonstrate how this control of temperature and chemical composition facilitates the search for optimal crystallization conditions using model soluble proteins. Thorough knowledge of the crystallization phase diagram is crucial for selecting the starting position and the kinetic path for any crystallization experiment. We show how a rational approach can control the size and number of crystals generated based on knowledge of multidimensional phase diagrams.
Introduction
Understanding the structure-function relationship of proteins and the mechanism of physiological pathways often relies on knowing the positions of hydrogen atoms (H) and how charge is transferred within a protein1,2. Since hydrogen atoms scatter X-rays weakly, their positions can only be determined with very high-resolution X-ray diffraction data (>1 Å)3,4. Conversely, neutron crystallography can be used to obtain an accurate position of hydrogen atoms in biological macromolecules as hydrogen and deuterium (H2, isotope of hydrogen) atoms have scattering lengths of roughly equal magnitude as oxygen, nitrogen and carbon5. However, neutron flux from available neutron sources is weaker than that of X-ray beams, so this must often be compensated for2,3. This can be achieved by exchanging H with H2 and/or increasing the volume of crystals to reduce the incoherent scattering of hydrogens and increase the signal-to-noise ratio of diffraction images.
There are various crystallization approaches (the corresponding schematic phase diagram is shown in Figure 1) for obtaining large and high-quality crystals for both X-ray and neutron bio-macromolecular crystallography6. In vapor diffusion, a droplet prepared from a mixture of a protein and a crystallization solution is equilibrated over time, through evaporation of water or other volatile species, against a reservoir containing a higher concentration of precipitant of the same crystallization solution. The increase in concentration of protein and precipitant in the droplet leads to the supersaturation required for spontaneous nucleation followed by crystal growth at these nuclei6,7. Although vapor diffusion is the most frequently used technique for growing crystals4, the crystallization process cannot be precisely controlled8. In the free interface diffusion method, crystallization solution diffuses into a concentrated protein solution, very slowly directing the system towards supersaturation. This method can be considered as a batch method with a slow mixing rate6,9,10,11,12. In the batch method, the protein is rapidly mixed with a crystallization solution leading to rapid supersaturation and in turn uniform nucleation with many crystals3,7. This method accounts for approximately one-third of all structures currently deposited in the Protein Data Bank. The dialysis method is also used for growing high-quality and well-diffracting protein crystals. In the dialysis method, molecules of precipitant diffuse from a reservoir through a semi-permeable membrane into a separate chamber with the protein solution. The kinetics of equilibration is dependent on various factors, such as temperature, membrane pore size, and the volume and concentration of protein samples and crystallization agents6.
Crystallization phase diagrams can be used to describe different states of a protein as a function of different physical or chemical variable3. As illustrated in Figure 1, each crystallization technique can be visualized as using a different kinetic trajectory to reach the nucleation and metastable zones of such a diagram6,10,13. This provides information about protein solubility and the protein concentration at which a thermodynamic equilibrium between crystal and solution is observed, thereby finding the optimal conditions for nucleation and growth3,14. In a two-dimensional phase diagram, the protein concentration is plotted as a function of one variable and the other variables are kept constant15. In such a phase diagram, when the protein concentration is below the solubility curve, the solution is in the undersaturated region and no nucleation or crystal growth occurs. Above this curve is the supersaturation zone where the protein concentration is higher than the solubility limit3,14. This is further divided into three regions: the metastable zone, the spontaneous nucleation zone, and the precipitation zone. In the metastable zone, supersaturation is not sufficient for nucleation to occur within a reasonable time but growth of seeded crystals can take place. Aggregation and precipitation are favored in the precipitation zone, where supersaturation is too high14,15.
When sufficient supersaturation for spontaneous nucleation is achieved, the first nuclei will appear10. The growth of crystals leads to a reduction in the protein concentration until the limit of solubility is reached. As long as supersaturation stays in the vicinity of the solubility curve, there will be no significant change in the size of crystals. However, it has been shown that variations in the temperature and chemical composition of crystallization solution (for example, the concentration of precipitant) will affect protein solubility and may lead to the initiation of further crystal growth8,13,16.
As dialysis is advantageous for good quality crystal growth, the OptiCrys crystallization bench illustrated in Figure 2, was designed and developed in our laboratory to control crystallization in a fully automated manner8. For this purpose, software was written with LabVIEW that allows the control and monitoring of the temperature of a flowing reservoir dialysis setup in contact with Peltier elements, via an electronic controller and a chiller. The same software also automatically regulates the chemical composition of the crystallization solution (for example the exchange of crystallization agents) using a multichannel fluidic system. Additionally, a digital camera and an inverted microscope are used to visualize and record the crystallization process. Two crystallization chambers with 15 μL and 250 μL volumes are available for growing crystals for different purposes. As the crystallization process is reversible, screening for different conditions is possible with just a few microliters of the protein solution as long as the sample is not damaged8. As a result, using this method minimizes the amount of protein material used.
From previous work8, it is apparent that during the crystal growth process, in situ observations need to be carried out at regular time intervals. These can range from a few seconds to several days, depending on the event under observation (precipitation, nucleation, or crystal growth).
The optimization of crystal growth with OptiCrys is based on temperature-precipitant concentration phase diagrams. In the case of proteins with solubility as a direct function of temperature, it is possible to make use of the salting-out regime18. This is where increasing the ionic strength of the solution, which can be visualized using protein-precipitant phase diagrams, decreases the solubility of the protein. Likewise, proteins with inverse solubility can make use of the salting-in regime18. Nucleation occurs in the nucleation zone, in the vicinity of the metastable zone, and crystal growth then takes place in the metastable zone of the phase diagram until the protein concentration reaches the solubility limit. As shown in Figure 3A, with constant chemical composition temperature can be decreased to keep the crystallization solution in the metastable zone to prevent new nucleation. Crystals grow until the second crystal/solution equilibrium is achieved and after that, no further increase in the size of crystals is observed. The temperature is decreased several times until the crystals reach the desired size. In Figure 3B, at constant temperature, increasing the precipitant concentration keeps the solution in the metastable zone. This process can then be repeated several times to obtain large crystals. Changing the temperature and manipulating the crystallization solution conditions, by controlling the supersaturation levels, are two powerful tools for separating nucleation and growth of crystals that are controlled precisely and automatically by OptiCrys5,8,14.
Examples of protein crystals grown by temperature-controlled, or temperature- and precipitant concentration-controlled crystallization, as well as relative diffraction data obtained are available in the literature and PDB. Among them are human γ-crystallin E, PA-IIL lectin, yeast inorganic pyrophosphatase, urate oxidase, human carbonic anhydrase II, YchB kinase, and lactate dehydrogenase5,14,17,18.
Although OptiCrys was commercialized by NatX-ray, there are many laboratories that do not have access to this instrument or to the serial approach it offers. The alternative to this technique is to use commercially available plastic microdialysis buttons with various volumes. Using these, temperature and chemical composition can be adjusted and varied manually. Inspection of microdialysis buttons cannot be done in situ and must instead be done manually with an optical microscope. Temperature control can be achieved by keeping the sample in a vibration-free temperature-controlled incubator. It is essential to keep the temperature constant to ensure that crystallization experiments are reproducible. Significant variation in temperature may also lead to damage or destruction of crystals5.
Here we provide a detailed protocol describing sample preparation and the use of control software for the growth of large, high-quality crystals suitable for neutron protein crystallography. This step-by-step procedure was designed to take advantage of the crystallization phase diagram in order to select a starting position and kinetic path to control the size and the quality of the crystals generated. Additionally, a detailed protocol for growing crystals with microdialysis buttons is presented which uses the same rationale to obtain large, high-quality crystals.
Protocol
1. Dialysis method with microdialysis buttons
- Sample preparation
- Prepare protein solution by dissolving 30 mg of chicken egg-white lysozyme as a lyophilized powder in 1 mL of CH3COONa buffer (100 mM sodium acetate, pH 4) in order to obtain a solution with a final concentration of 30 mg·mL-1.
- Centrifuge the sample at the 13,000 × g for 10 min at 277 K. This process helps to remove any aggregates before starting the crystallization process.
- Check the absorbance of the sample at 280 nm and calculate the protein concentration by using the Beer-Lambert equation (A= εcl).
NOTE: According to the Beer-Lambert equation, electronic absorbance (A) is directly proportional to the concentration (c, mg·mL-1) of an absorbing species given a constant optical pathlength (l, cm). The gradient of this linear relationship is the molar extinction coefficient (ε, for lysozyme at 280 nm is 2.64 mL·mg−1·cm−1)19. The sidechains of aromatic amino acids (tyrosine, tryptophan, and phenylalanine) and disulfide bonds between cysteine residues have strong absorbance at ~280 nm arising from spectroscopically-allowed π – π* transitions. As the majority of proteins contain these residues, protein concentration can typically be calculated easily by measuring the absorbance at 280 nm, given knowledge of the extinction coefficient. - Prepare crystallization solutions as shown in Figure 4. Filter all the stock solutions with 0.22 μm Millipore filters before preparing the crystallization solution.
- Crystal growth
- Cut a cellulose dialysis membrane with appropriate molecular weight cutoff (6-8 kDa) and soak it in distilled water.
NOTE: Dialysis membrane discs are commercially available for microdialysis buttons, but if the dialysis tubing is used, don’t forget to cut the edges in order to separate the two layers of membrane from the tube to have only single layer membranes. - Fill wells of a 24-well tray with 2 mL of crystallization solution in the same order as shown in Figure 4.
NOTE: If buttons with larger volumes are used (e.g., 200 μL), fill 50 mL tubes with a minimum of 5 mL crystallization solution in order to ensure efficient exchange. - Add/Pipette 35 μL of lysozyme solution to the chamber of the microdialysis button as illustrated in Figure 5A.
NOTE: To avoid the formation of air bubbles in a 30 µL dialysis button when it is closed, an extra volume (dead volume) of 5 μL of additional protein must be added, which means a total of 35 µL of protein sample. This additional protein sample creates a slightly domed shape on top of the chamber, as shown in Figure 5B, which prevents the formation of air bubbles. - Take an applicator of the appropriate size and place the elastic O-ring at its extremity (Figure 5C). Then place the membrane, previously lightly wiped/drained using a piece of fibre-free paper, on top of the chamber of the dialysis button. Be careful not to put dust in the chamber when applying the paper. Set the dialysis membrane in place by transferring the elastic O-ring from the applicator to the groove of the dialysis button (Figure 5C).
NOTE: The critical moment of handling is fixing the dialysis membrane on top of the chamber by transferring the elastic O-ring from the applicator into the groove of the dialysis button. All movements must be perfectly synchronized to avoid enclosing air bubbles with the sample in the protein chamber. It is useful to practice stretching the elastic O-ring before its application to know its rigidity, use tweezers to hold part of the membrane during its application and carry out the first test experiments with a model protein. - Transfer the button to the well or to the 50 mL tube using tweezers (Figure 5D).
- Cover the well with a coverslip, pressing it gently on the grease to seal the well (Figure 5E).
NOTE: If there is no grease on top of the wells, be sure to add this before starting the experiment or use a piece of tape instead of glass coverslip. The principle of protein crystallization using microdialysis buttons is illustrated in Figure 5. - Keep the sample at 293 K in a thermoregulated incubator. Different temperatures may be necessary according to the protein and crystallization conditions used.
NOTE: The same grid of crystallization conditions shown in Figure 4 (allowing the concentration of precipitant to be varied) can be screened as a function of temperature. In such a case, the same crystallization plate must be reproduced and each copy must be placed in an incubator regulated at a different temperature. This requires having several vibration-free thermoregulated incubators available. - Check the tray or tubes for crystals (Figure 4) and take notes on a regular basis, typically daily, to distinguish what is in each tray. Good notes are essential to avoid false positive results and to discriminate dust from crystals.
- Cut a cellulose dialysis membrane with appropriate molecular weight cutoff (6-8 kDa) and soak it in distilled water.
2. Crystal growth process using OptiCrys
- Sample preparation
- Prepare a protein solution and a dialysis membrane as described in section 1.1.
- Prepare stock solutions of NaCl (4 M) and of CH3COONa pH 4 (1 M) and filter them into 50 mL tubes.
- Add the protein solution (15 μL of lysozyme with 30 mg·mL-1) to the dialysis chamber of the temperature-controlled flowing reservoir dialysis setup. Refer to Figure 6 for details of the temperature-controlled flowing reservoir dialysis setup. OptiCrys has two dialysis chambers, the minimum volume is 15 µL and the maximum volume is 250 µL.
- Cover the overchamber with a dialysis membrane and fix the membrane with the elastic O-ring (Figure 6B).
NOTE: This setup is different from microdialysis buttons where each chamber is sealed directly by a dialysis membrane. In the flow cell, the dialysis membrane is instead fixed to the overchamber allowing the mounting of crystals without its removal. For this purpose, the overchamber can simply be unscrewed from the reservoir. - Flip the overchamber and place it on top of the dialysis chamber. Slowly and gently press it to remove all the air trapped between the two pieces and avoid bubbles in the chamber (Figure 6C). Practice with a model protein can be advantageous when training to avoid air bubbles and sample loss.
- Fix the reservoir in its position by gently screwing it on top of the overchamber, again being mindful to avoid trapping air bubbles. Over-tightening of the reservoir can also form bubbles in the crystallization chamber (Figure 6D).
- Add the crystallization solution and cover the reservoir chamber with the airtight cap. (Figure 6G). Maximum volume of the reservoir is 1 mL.
- Transfer this assembly and insert it into the brass support. This support is in contact with Peltier elements that are used to control the temperature.
- As illustrated in Figure 6, the airtight cap is equipped with an optical window to allow top illumination of the dialysis chamber. Put the light source (Figure 2) on the window allowing light to pass through the chamber.
- The reservoir chamber can be connected to a pump to allow it to function as a continuous flow cell. Connect the tubing on top of the 50 mL tubes that contain the stock solutions and distilled water to the rotary valve as illustrated in Figure 7.
NOTE: If automatic preparation and changing of crystallization solutions are not desired during the experiment, omit step 2.1.10. In such a case, the crystallization solution must be prepared and the reservoir pre-filled manually.
- Software
- Turn on the computer and launch the software Croissance cristalline [Crystal growth]. This control software is written with LabVIEW (http://www.ni.com/labview/) and offers a user-friendly graphical interface. It includes 4 different graphical interfaces (Accueil [Welcome], Paramétrage [Setting], Essai [Test], and Maintenance [Maintenance]) (Figure 8).
NOTE: Translations from French are in brackets. - Select the Maintenance view by clicking the button as illustrated in Figure 8. This view is currently the most often used and allows users to control the majority of parameters during the experiment.
NOTE: After clicking on the Maintenance view, a new window with different sections for controlling parameters such as temperature or light will appear. In Figure 8 different parts of this view are shown with arrows and frames. In the following steps, we demonstrate how each parameter is controlled using the software. - Régulateur de température [Temperature controller] section allows the control and monitoring of temperature. Click on the button, number one (1) in Figure 8, to turn it on.
NOTE: Temperature range in OptiCrys is 233.0 – 353.0 ± 0.1 K. - Set the temperature on the consigne [setpoint] section and press enter (Figure 8(2)). Below this button, there is a graph with 2 traces (red and yellow). The red trace shows the final (ordered) temperature and the yellow trace shows the current temperature. As shown in Figure 8(2), the temperature is set at 20 °C.
NOTE: In order to grow a crystal, as explained in the crystal growth section, many temperatures will need to be chosen. To change the temperature, add each new temperature in the consigne [setpoint] section and press the Enter button on the keyboard. - Turn on the light by increasing the luminosity from the Lumières [Lights] section in Figure 8. Luminosity ranges from 0 to 100, "0" indicates that the light is off and at "100" the light is set to maximum of intensity and brightness. By increasing the light, in the Microscope section, one can see inside the dialysis chamber. During the experiment, the brightness in the cell may vary; adjust the parameters to clearly visualize inside the dialysis chamber. Magnification can also be increased or decreased by using the + and – buttons in front of “zoom” for better viewing.
- On the right-hand side of the Microscope section, there are several sections for storing relevant information for each crystallization experiment. Each user can create a folder to store information on crystallization conditions, protein names and the molecular weight cutoff of the dialysis membrane used (Figure 8(3)).
- The user can define a name for the experiment by simply typing it on the Nom Dossier [Folder name]. Clicking on the Dossier [Folder button] (shown with a green frame in Figure 8) opens a new window. In this window, there will be a text file that contains all the information defined for the experiment. In addition, time-stamped images are saved in this folder for future processing.
- From the NB Images section, select the number of images that should be taken during the course of the experiment. Specify the number of the images in the right-hand panel along with the desired time interval between these (e.g., min, hour, day). Figure 8 shows the software setup to record zero images in a minute.
NOTE: Use the Pompe [Pump] section for mixing stock solutions and injecting crystallization solution into the reservoir chamber. See section 2.1.10 and Figure 7 for an explanation of the principle of the fluid mixing system. - Input concentrations of the stock solutions in Etape 1 [Step 1]: solutions stocks. For the crystallization experiment in the next section, NaCl 4 M and CH3COONa 1 M pH 4 will be used.
NOTE: Concentrations of stock solutions are in molar units. - Define the final concentration of each solution. For example 0.75 M for NaCl and 0.1 M for CH3COONa pH 4. Input these in the final concentration section (Figure 8) in the Etape 2 [Step 2]: solution à préparer [solution to prepare]. Press the Calcul [Compute] button, which is shown with a red frame in Figure 8. The final volume of each stock solution that will be used in mixing will display in the volume panel in front of each concentration panel.
- Press the Lancer préparation [Launch preparation] button (Figure 8). As illustrated in Figure 7, the rotary valve takes each stock solution and injects them to the mixing tube via a switch.
- After the crystallization solution has been prepared, click on the Entrée solution [Solution Entry] button in Etape 3 [Step 3]: Flux of the pump section (yellow frame in Figure 8). The switch changes to inject the new crystallization solution from mixing tube into the reservoir chamber. To stop the exchanging process, press the Arrêt distribution [Distribution Stop] button.
NOTE: Observe the crystallization process during the experiment and modify parameters such as temperature, crystallization solution and zoom, in the corresponding graphical interface of the supervision software. By using the software there is no need to remove the airtight cap or the flow cell during the experiment so the only variable will be the one that user changes through the software.
- Turn on the computer and launch the software Croissance cristalline [Crystal growth]. This control software is written with LabVIEW (http://www.ni.com/labview/) and offers a user-friendly graphical interface. It includes 4 different graphical interfaces (Accueil [Welcome], Paramétrage [Setting], Essai [Test], and Maintenance [Maintenance]) (Figure 8).
- Large crystal growth
- Add 15 μL of lysozyme with a concentration of 30 mg·mL-1 to the dialysis chamber (Figure 6A).
NOTE: Prepare the protein sample as described in section 1.1. - Assemble the temperature-controlled flowing reservoir dialysis setup as described in section 2.1 and Figure 6.
- Prepare the crystallization solution. Do not forget to filter all the stock solutions before sample preparation with 0.22 μm filters. For this experiment, the crystallization solution contains 0.75 M NaCl and 0.1 M CH3COONa pH 4. This can be added manually or by using the reservoir chamber and pumping system as described in sections 2.2.10 to 2.2.12.
- Set the temperature to 295 K as explained in sections 2.2.3 and 2.2.4 and shown in Image 8. Under initial conditions, equilibrium between the dialysis chamber and the reservoir will be reached after approximately 90 minutes and the first visible nuclei will appear after 22 hours.
- Allow crystals to grow until no more visible changes in the size of the crystals are observed (Figure 9, panel 1).
NOTE: In order to determine the nucleation time and to measure the variation in the size of the crystals, record images every 15 or 20 min, which is respectively 4 or 3 images per hour in the NB Images section. For in situ observation of protein denaturation, aggregation and precipitation or crystal dissolution or nucleation, typically between a few seconds to a few tens of minutes are required. However, for crystal growth, this range is between a few minutes to a few hours. - After three days, lower the temperature to 291 K to restart crystal growth. Keep the temperature constant and let the crystal develop (Figure 9, panel 2). For this stage of the experiment, it will be sufficient to record images every 2 hours and check every 10 to 12 hours for any change in the size of the crystals. The experiment can be continued if no change in the size of the crystals is observed.
NOTE: Depending on the protein and precipitant concentrations in the crystallization solution and the volumes of protein used, the time needed to reach the equilibrium for each step may vary. - Decrease the temperature to 288 K to restart crystal growth. In the experimental condition of the case presented here, one day is enough to reach equilibrium (Figure 9, panel 3).
- Check the size of the crystals and maintain a constant temperature as long as the crystal continues to grow.
- After 4 days, decrease the temperature to 275 K in order to restart crystal growth (Figure 9, panel 4).
– In the experimental conditions of the case presented, after around 10 days a crystal that is 500 μm in one dimension will be obtained (Figure 9).
- Add 15 μL of lysozyme with a concentration of 30 mg·mL-1 to the dialysis chamber (Figure 6A).
- Controlling the crystal size
- Prepare a protein solution and the temperature-controlled flowing reservoir dialysis set up as described in sections 2.3.1 and 2.3.2.
- Prepare crystallization solutions with 0.9 M NaCl and 0.1 M CH3COONa pH 4.
- Set the temperature to 291 K and allow crystals to grow. Under initial conditions, the first nucleation event will start after around one hour and numerous crystals will grow in the dialysis chamber for three hours (Figure 10, steps: 1 and 2). Record images every 20 minutes to check the size of the crystals during the growth process.
NOTE: The optimization of crystallization conditions is crucial in controlling most of the final properties of generated crystals. The temperature and chemical composition of crystallization solutions can be changed to dissolve and re-grow crystals of uniform size. It should be also noted that a protein sample is not consumed in such an experiment, as conditions can be reversed to re-dissolve the sample as long as it is not denatured. When dissolving crystals by changing temperature and maintaining constant chemical composition, continue the experiment as follows: - Once crystals have grown at 291 K, these can be dissolved to re-grow fewer, larger crystals. Increase the temperature gradually over 20 min to reach 313 K. It takes around one hour to dissolve all the crystals inside the dialysis chamber (Figure 10, steps: 3-5). Record images every 5 to 15 minutes to monitor the dissolution process.
NOTE: Many proteins are sensitive to high temperatures. Be sure to work within the temperature range where the protein is stable to avoid any damage/denaturation. In addition to the protein solubility, temperature also affects the buffer solution. For example, the pH of the buffer can change with temperature, especially in the Tris buffer. In such a case, it is crucial to set the pH according to the temperature at which the experiment is performed18. It should also be noted that protein dissolution takes significantly less time (from a few minutes to a few hours) compared to protein crystal growth (from a few hours to a few days). In general, during the dissolution of the crystals, the temperature increases gradually and slowly (respecting the short total dissolution time), mainly in the case of partial dissolution of the crystals to avoid the increase of the crystal mosaicity. When the crystals are growing, the temperature can decrease quickly (in less than a minute) to the set temperature (respecting the long total growth time). Regular monitoring of the crystallization chamber by recording images is advisable to prevent damage to the protein and help define the optimal time for dissolution or growth of crystals for each protein studied. - After all crystals have dissolved set the temperature to 295 K to initiate a second nucleation event (Figure 10, steps: 6,7). Record images every 5 minutes to monitor the second nucleation process. In this step, the first nuclei appear after around 18 minutes.
NOTE: At this temperature, the solution will be in the nucleation zone, in the vicinity of the metastable zone. As a result, only a few nuclei will appear in the crystallization chamber. - Continue the experiment repeating the optimization workflow described in section 2.3 for growing larger crystals. The total duration of the experiment represented in Figure 10 is only a few days.
NOTE: If during the nucleation phase the crystals appear at different times, crystals of different sizes are obtained in the crystallization chamber. In such a case, the increase in temperature (in the case of proteins with direct solubility) will result in quicker dissolution of the smaller crystals. Depending on the kinetic ripening effect, the extra protein (gained from dissolution) can then be used for the growth of the larger crystals.
When dissolving crystals at constant temperature by changing the chemical composition of the crystallization solution, continue the experiment as follows:
It is also possible to dissolve crystals grown previously by changing the chemical composition of the crystallization solution during the experiment to re-grow a population of uniformly sized crystals under new conditions. - Prepare the protein solution (2.3.1), the temperature-controlled flowing reservoir dialysis setup (2.1) and the crystallization solution (2.4.2) as described above. Under initial conditions in the nucleation zone far from the metastable zone, numerous small crystals will appear in the crystallization chamber and begin to grow (Figure 11, steps: 1,2).
- After three hours, when many medium-sized-crystals are visible in the crystallization chamber (Figure 11, step: 3), decrease the NaCl concentration (0.9 M) gradually to reach zero. For this, prepare a new crystallization solution containing only buffer solution with 0.1 M CH3COONa pH 4. Use the pumping system to exchange it with the crystallization solution in the reservoir chamber. Follow steps 2.2.10 to 2.2.12 for the preparation and injection of a new solution into the reservoir chamber. With this new solution, when solutions are exchanged the NaCl concentration decreases in the chamber until the final solution in the reservoir chamber contains no more than 0.1 M of CH3COONa pH 4 and no NaCl. Capture images every 10 minutes to record the dissolution process.
- Allow the crystals to dissolve completely (Figure 11, steps: 4,5). Dissolution time is around two hours for this experiment. As previously mentioned, dissolution time is dependent on the protein system, crystallization conditions, and dialysis chamber volume used. Regular observation of the crystallization chamber (see Microscope section) and recording images and notes during the experiment are essential.
- When all crystals inside the chamber are dissolved (Figure 11, step: 5), use the pumping system again to prepare a new crystallization solution by injecting NaCl at a lower concentration than the previous one (0.75 M NaCl in 0.1 M CH3COONa pH 4).
- Inject the new solution into the reservoir chamber (Figure 11, steps: 6,7) and repeat the crystallization growth optimization workflow as described in section 2.3. A uniform population of larger crystals will be generated. The results shown in Figure 11 were obtained after a few days.
Results
In Sections 2.3 and 2.4, three examples of optimized crystal growth are presented, showing use of the instrument and an experimental design for growing large crystals. For this demonstration, we have used lysozyme as a model protein, although crystal growth experiments have been successfully performed with many other protein systems using this method (see above). By using and mastering the protocol presented here one can adapt it for other protein candidates.
In section 2.3 we demonstrated that established rational crystallization strategies could be beneficial in growing crystals with sufficient scattering volumes for neutron protein crystallography. Here, we demonstrate that the rational optimization strategies proposed also allow the generation of a uniform population of crystals of any specific size required for downstream structure determination approaches.
These two experiments are designed to emphasize the importance of phase diagrams in controlling crystal nucleation and growth. Here, control of the temperature and chemical composition of crystallization solutions in combination with monitoring the crystallization process in real time are used to study the qualitative phase diagram. Using this method, nucleation and crystal growth can be rationally optimized in a reversible manner. Use of such a serial approach also reduces the amount of protein and the time required to control the size and quality of the crystals.
In the dialysis method, a protein solution is separated from a crystallization solution by a semi-permeable membrane6 (Figure 5). This dialysis membrane allows small molecules such as additives, buffer, and ions to pass through the membrane but not macromolecules such as proteins6,20. This feature allows the crystallization solution to be modified during the course of the experiment6. Exchange of the solution can be done manually, for example in microdialysis buttons, or in an automated manner using an instrument developed for this purpose, OptiCrys8.
In the first set of experiments, microdialysis buttons were used for the crystallization of chicken egg-white lysozyme. Microdialysis buttons were immersed in crystallization solutions with different salt concentrations. In this simple crystallization grid experiment, the only variable is precipitant concentration whilst temperature is kept constant (293 K). As shown in Figure 4, slight variations in the salt concentration induce a change in the size and numbers of crystals observed, allowing investigation of the crystallization phase diagram. In Figure 4, panel 1, the crystallization solution contains 0.7 M NaCl and a limited number of larger crystals have appeared in the buttons. By increasing salt concentration from 0.7 to 1.2 M, supersaturation increases and the solution in the nucleation zone moves away from the metastable zone (Figure 4, panels 1 to 6). As a result, the number of crystals increases and their size decreases.
In the first experiment with a fully automated instrument enabling temperature-controlled dialysis crystallization, OptiCrys (Figure 9), the crystal growth experiment was tailored to generate large crystal growth. The experiment was launched at an initial temperature of 295 K with a crystallization solution containing 0.75 M NaCl and 0.1 M Na acetate buffer pH 4. Under these experimental conditions, the crystallization solution reached the nucleation zone in the vicinity of the metastable zone of the phase diagram (Figure 9, arrow 1). As a result, only a few nuclei were generated during the first stage of the experiment. In order to grow selected crystals further (shown in Figure 9), the crystal growth optimization workflow was driven towards the metastable zone by varying temperature as soon as the crystal-solution equilibrium was reached.
Each time equilibrium between crystal and solution was reached, the temperature was lowered, first to 291 K, then to 288 K and finally to 275 K, to keep the crystallization solution in the metastable zone. The result of this experiment is a single large crystal suitable for both macromolecular X-ray and neutron crystallography.
For most proteins, the precise quantitative phase diagram (or just a qualitative diagram) has not yet been obtained due to the lack of experimental devices capable of accurately measuring protein concentration (or just of observing/detecting the crystallization process in real time) during crystallization experiments18. As a result, it is often not possible to design the experiment in such a way that crystallization begins in the optimal area of the phase diagram, in the vicinity of the metastable zone.
Therefore, a crystallization optimization study must take place before the experiment dedicated to the growth of a large volume crystal is undertaken. In this study, using temperature variations (at constant chemical composition) on the one hand and variations in chemical composition (at constant temperature) on the other hand, are necessary to identify the metastable zone and to delineate the optimal conditions for starting a large crystal growth experiment.
To this end, two other experiments are presented which were tailored to demonstrate the reversibility of the temperature-controlled dialysis crystallization experiments with OptiCrys for nucleation, crystal growth, dissolution and re-growth. The crystal growth optimization workflow was controlled so that a uniform population of fewer, larger lysozyme crystals was grown, using variation of temperature or precipitant concentration.
In the second experiment with OptiCrys, the chemical composition of the crystallization solution was kept constant throughout the experiment (0.9 M NaCl in 0.1 M CH3COONa pH 4) with variable temperature. The initial temperature was set at 291 K. The results of this experiment are summarized in Figure 10. Because of high supersaturation, a large number of small crystals appeared in the crystallization chamber (Figure 10, panels 1 and 2). In accordance with the concept of direct protein solubility, by gradually increasing the temperature to 313 K, all of the crystals were dissolved (Figure 10, panels 3, 4 and 5). Finally, by lowering the temperature to 295 K, the second nucleation was initiated in the vicinity of the metastable zone and allowed controlled formation of a lower number of nuclei. Further crystal growth resulted in the uniform generation of a population of larger crystals (Figure 10, panel 7).
As shown in Figure 11, variation of the chemical composition of the crystallization solution, at a constant temperature of 291 K, can likewise be used to obtain a uniform population of larger crystals. Similar to the previous experiment, the initial condition was 0.9 M NaCl in 0.1 M CH3COONa pH 4. The NaCl concentration was then lowered gradually from 0.9 M to zero to dissolve the crystals (Figure 11, panels 4 and 5). At this point, NaCl was completely replaced by a buffer solution of 0.1 M CH3COONa pH 4. Reducing the salt concentration keeps the solution in the undersaturated zone of the phase diagram, which leads to the dissolution of the crystals. Then, a new crystallization solution with lower ionic strength, at 0.75 M NaCl in 0.1 M CH3COONa pH 4, was injected into the reservoir chamber. At this precipitant concentration, the first nuclei appeared (Figure 11, panel 6) after 90 minutes. The number of generated crystals was lower and the crystals reach a larger volume (Figure 11, panel 7) than before.
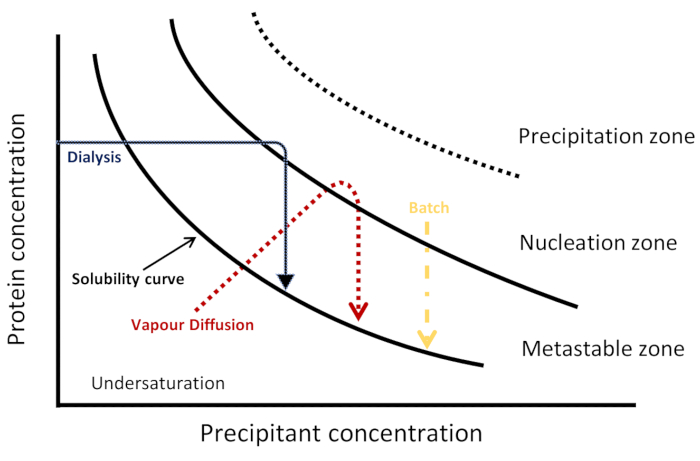
Figure 1: Schematic phase diagram. Kinetic trajectories for three crystallization techniques are represented in a salting-out regime. Each method achieves nucleation and crystallization differently, visualized by a different kinetic pathway through the phase diagram to reach the nucleation and metastable zones. The solubility curve separates undersaturation and supersaturation regions. Supersaturation is divided into three zones: metastable, nucleation and precipitation. In the nucleation zone, spontaneous nucleation occurs while in the metastable zone crystal growth takes place. This Figure is adapted from Junius et al.8 Please click here to view a larger version of this figure.
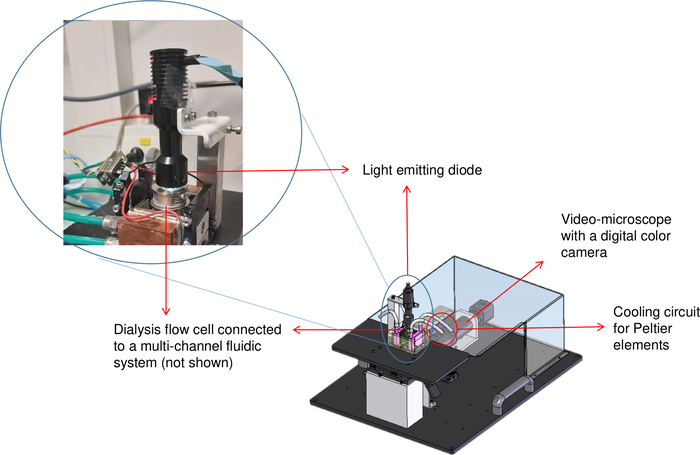
Figure 2: Schematic representation of the crystallization bench (OptiCrys). The LED light source is located on top of the temperature-controlled dialysis flow cell. An inverted microscope and the digital camera are shown at the top right of the image with the red arrow. The red circle represents the location of the chiller tubing. Please click here to view a larger version of this figure.
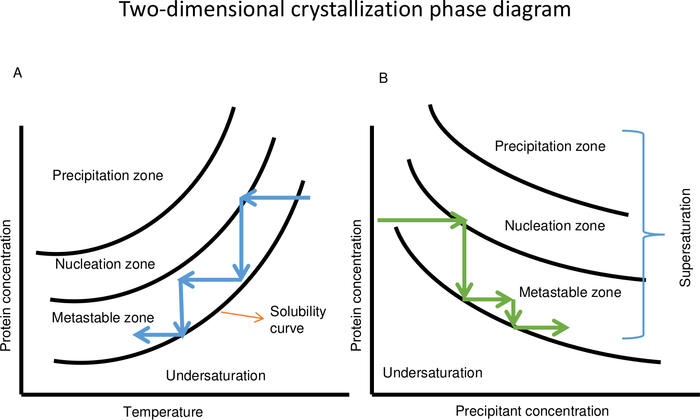
Figure 3: Schematic two-dimensional protein crystallization phase diagram as a function of temperature (A) and precipitant concentration (B). (A) In case of a protein with direct solubility, decreasing the temperature keeps the crystallization solution in the metastable zone. Temperature variation can be repeated several times to control the crystal growth process until crystals with the desired volume are obtained. (B) Changing the concentration of the precipitant solution can also be used to keep the crystallization solution in the metastable zone for growing crystals. This Figure is adapted from Junius et al.8 Please click here to view a larger version of this figure.
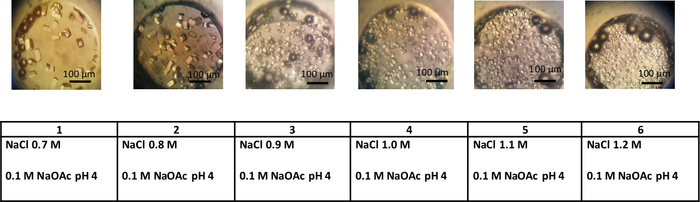
Figure 4: Crystals of lysozyme obtained using the dialysis method. This experiment was performed at a constant temperature of 293 K in 0.1 M sodium acetate buffer pH 4. Increasing NaCl concentration from 0.7 M to 1.2 M increases the nucleation rate and results in a larger number of crystals. Please click here to view a larger version of this figure.
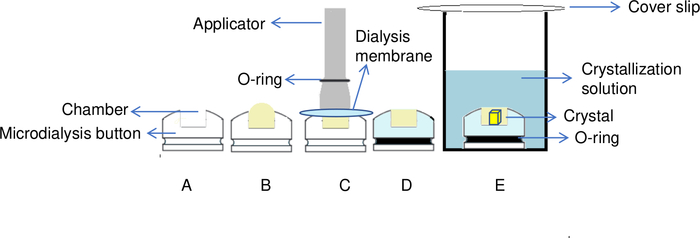
Figure 5: Overview of the protein crystallization process by the dialysis method. (A) By adding the protein to the chamber of the dialysis button, (B) a dome shape is created on the top of the chamber. (C) An applicator is used to transfer the O-ring to the groove of the dialysis button in order to fix the dialysis membrane in place. (D) The dialysis button is ready for immersion in the reservoir solution. (E) Crystallization solution passes through the semipermeable membrane and crystals start to form inside the chamber. Please click here to view a larger version of this figure.
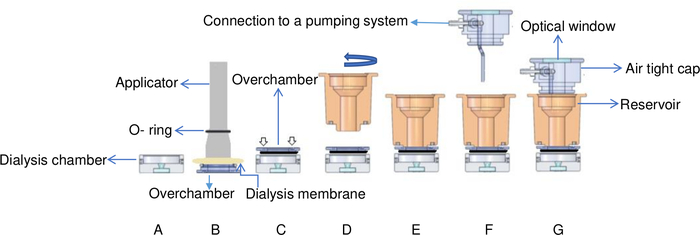
Figure 6: Schematic view of the temperature-controlled flowing dialysis setup. (A) The protein sample is added to the dialysis chamber. (B) The dialysis membrane is fixed onto the overchamber with an O-ring by using an applicator. (C) The overchamber is turned and fixed onto the top of the dialysis chamber. White arrows indicate where screws are placed on the overchamber. (D) The reservoir chamber is turned clockwise (E) and fixed on top of the overchamber. (F) The reservoir chamber is covered by an airtight cap with connectors to a pumping system and (G) the flow cell is placed in the brass support. This Figure is adapted from Junius et al.8 Please click here to view a larger version of this figure.
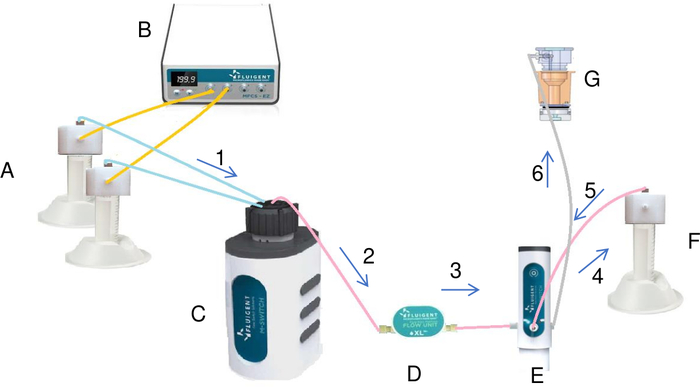
Figure 7: Preparation and injection of the crystallization solution in the reservoir by the fluidic system (A). Tubes containing salt and water are connected to the pressure/vacuum controller (B) and to the rotary valve (C). By using the pressure, pressure/vacuum controller creates a constant flow of the liquids from the tubes to the rotary valve. Each liquid passing through the flow meter (D) and the switch is injected into the mixing tube (F). Once all the liquids have been added to the mixing tube, the switch by some modifications injects the final solution from the mixing tube into the reservoir (G). The liquid flows through the system in the direction of the arrows in the diagram marked in ascending order (from 1 to 6). Please click here to view a larger version of this figure.
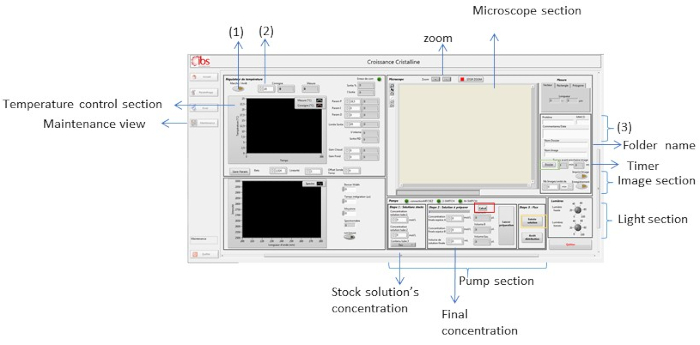
Figure 8: Maintenance view of the supervision software. This view is used to control different parameters like temperature, light, crystallization solution and zoom. Please click here to view a larger version of this figure.
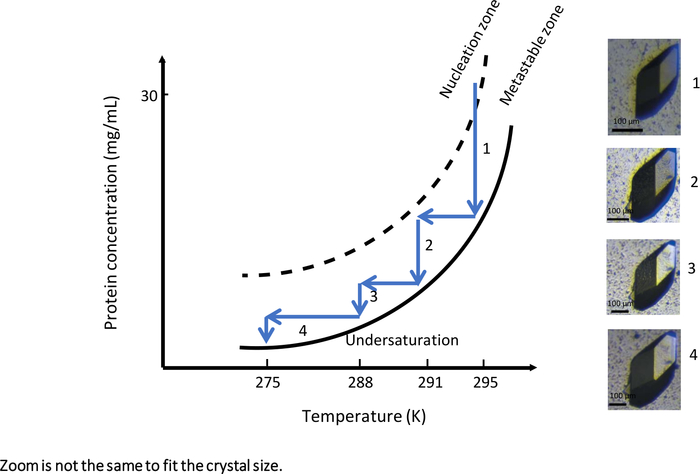
Figure 9: The phase diagram as a function of the temperature (selected images are to be tracked in ascending order). A single large lysozyme crystal is obtained by systematically changing the temperature from 295 K to 275 K. At each step, crystal growth is stopped upon reaching the solubility curve. Reducing the temperature by keeping the solution in the metastable zone restarts crystal growth. The images have different levels of magnification. This Figure is adapted from Junius et al.8,18 Please click here to view a larger version of this figure.
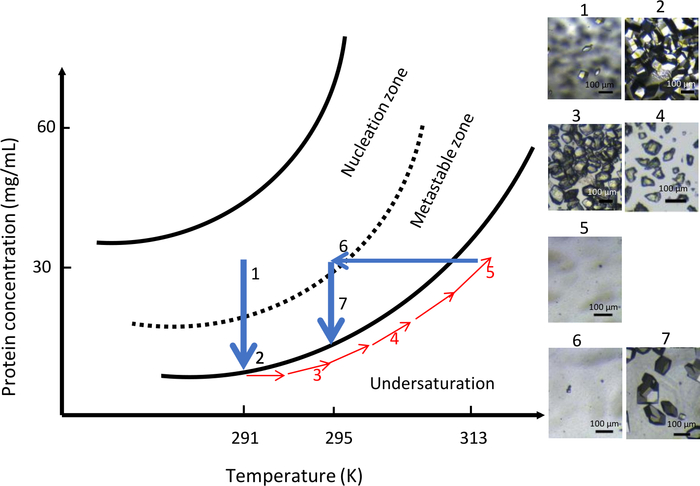
Figure 10: Optimization of crystal growth at constant chemical composition using temperature control (selected images are to be tracked in ascending order). Starting the nucleation process in the nucleation zone at 291 K, far from the metastable zone, results in the formation of numerous crystals. Increasing the temperature to 313 K then dissolves the crystals until no visible nuclei are seen in the dialysis chamber. Finally, decreasing the temperature to 295 K restarts the nucleation process for the second time leading to a limited number of larger crystals. This Figure is adapted from Junius et al.8,18 Please click here to view a larger version of this figure.
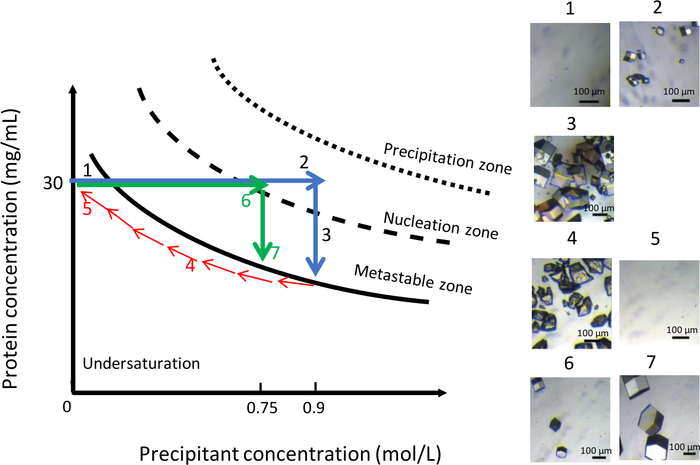
Figure 11: Optimization of crystal growth at constant temperature using variations in precipitant concentration (selected images are to be tracked in ascending order). Decreasing the precipitant concentration from 0.9 M to 0 M dissolves the crystals obtained during the first nucleation event. The crystallization process is restarted by the injection of the same precipitant but at lower ionic strength, 0.75 M, which leads to the formation of a few larger crystals. This Figure is adapted from Junius et al.8,18 Please click here to view a larger version of this figure.
Discussion
Different physical, chemical and biological variables influence protein crystallization by affecting protein solubility21. Among these variables, temperature and chemical composition of the crystallization solution are used here in combination with dialysis technique to improve and grow large high-quality crystals of biomacromolecules for neutron diffraction studies. By using knowledge of phase diagrams, crystallization is made more predictable. Although screening of different crystallization conditions in a serial approach is also possible, the main aim of using the rational approaches presented is to separate and control the kinetics of crystal nucleation and growth.
Similar to all crystallization studies, high quality pure and homogeneous protein samples, and dust-free crystallization solutions increase the success rate of the experiment. Filtration and centrifugation of solutions are essential steps in the described protocols. Knowing the physicochemical properties of the proteins studied such as the molecular weight (to choose the appropriate dialysis membrane), the isoelectric point, and the protein solubility are crucial for the design of an optimal crystal growth experiment. Also, consideration must be made for protein stability at different temperatures or with different chemicals to prevent sample loss and increase the likelihood of success. Considering the temperature range of OptiCrys (233.0–353.0 ± 0.1 K), a broad range of proteins can be crystallized using it. But it is worth to stress that proteins that are primarily thermo-stable, such as proteins from thermophilic sources, would benefit the most in temperature-controlled large-volume crystal growth experiments offered by this instrument.
Using a low-volume dialysis chamber (when using OptiCrys) or microdialysis buttons and screening several temperatures and crystallization conditions (e.g., grids of precipitant concentration or pH), it is possible to gain information on the location of the limit of the metastable zone (kinetic equilibrium between nucleation and metastable zones). This is invaluable when designing a successful crystal growth experiment especially for new protein candidates in crystallization. Without this information experiments can start from an area of the phase diagram with high supersaturation, too far from the limit of the metastable zone to easily control crystal nucleation. Although dissolution of the protein precipitate may be attempted, for example by increasing the temperature in the case of direct solubility, for proteins with reduced thermostability, keeping the sample at high temperature for a longer period of time may render the protein precipitation irreversible. Thus, the best strategy consists of using an initial condition with lower supersaturation located near the limit of metastability, where nucleation can be controlled and protein precipitation avoided. In line with this, crystallization prescreening decreases the chance of having a protein precipitate in the dialysis chamber and increases the success rate of the experiment.
After designing an experiment, preparing dialysis chambers (OptiCrys) or microdialysis buttons is another important step. Preventing air bubble formation in the dialysis chamber/button increases the chance of successful crystallization especially when small volumes are used. The presence of air bubbles in dialysis chamber may also change the kinetics of the crystallization process and reduce the reproducibility of the experiment (because the protein/solution contact surface has been modified). Not only protein but also crystallization solution can affect the success of the experiment. Using new 50 mL tubes for the pumping system each time one wants to start a new experiment and washing tubing after each experiment decreases the chance of contamination and avoids the creation of salt crystals in the apparatus.
The use of microdialysis buttons is an alternative when OptiCrys is not available. The strategies for optimizing crystallization and monitoring crystal growth mentioned above, must be carried out manually. Typically this necessitates being outside a thermoregulated incubator, which can be problematic when temperature regulation is a critical step in the methodology described. This does not facilitate changing the chemical composition of the crystallization solutions, or monitoring crystal growth by imaging, so the crystal growth process cannot be controlled in real-time.
Knowledge of the phase diagram is the basis of using the crystallization bench, OptiCrys, to systematically grow large, high-quality crystals in an automated fashion. Control of physicochemical parameters like temperature, precipitant concentration, and pH during crystallization moves the protein-solution equilibrium in a well-defined kinetic trajectory across the phase diagram. This is complemented by the use of a dialysis membrane to adjust mass transport and create a controlled gradient in the crystallization chamber that affects the size and quality of the crystals. Therefore, using both thermodynamic data and kinetic trajectories is essential to control the crystallization process in order to grow high-quality crystals. Thanks to OptiCrys, systematic phase diagrams in a multidimensional space can be studied with a serial approach using significantly less material than before. To demonstrate this methodology, we provide here a case study with a model protein, chicken egg-white lysozyme. By using and mastering the protocol presented here one can adapt it for real protein systems5,14,17,18.
Disclosures
The authors have nothing to disclose.
Acknowledgements
MBS acknowledges the support from the LABEX VALO GRAL under the contract 2015. NJ acknowledges CEA's International Doctoral Research Program (Irtelis) for the PhD Fellowship. Authors acknowledge funding from the European Union’s Horizon 2020 Research and Innovation Program under Marie Skłodowska-Curie grant agreement number 722687. Authors are also grateful to Dr Esko Oksanen (ESS, Lund) and Dr Jean-Luc Ferrer (IBS, Grenoble) for helpful conversations and insights. IBS acknowledges integration into the Interdisciplinary Research Institute of Grenoble (IRIG, CEA).
Materials
| Name | Company | Catalog Number | Comments |
|---|---|---|---|
| 200 µl Dialysis Button | Hampton Research | HR3-330 | Dialysis button |
| 24 well plates | Jena Bioscience | CPL-132 | Crystallization plate |
| 2-Switch | FLUIGENT | 2SW001 | Switch |
| 30 μl Dialysis Button | Hampton Research | HR3-324 | Dialysis button |
| 50 mL Corning Centrifuge tubes | Sigma-Aldrich | CLS430828-500EA | Centrifuge tubes |
| Acetic acid | Sigma-Aldrich | S2889 | Chemical |
| Chicken Egg White Lysozyme | Sigma-Aldrich | L6876 | Lyophilized protein powder |
| Dialysis Membrane Discs 6-8 kDa MWCO | Spectrum | 132478 | Dialysis membrane |
| Dialysis Membrane Tubing 6-8 kDa MWCO | Spectrum | 132650T | Dialysis membrane |
| Microcentrifuge | Eppendorf | Minispin | Bench-top centrifuge |
| Flow Unit | FLUIGENT | FLU-XL | Flow meter |
| Flowboard | FLUIGENT | FLB | Flowboard |
| Microfluidic Flow Control System EZ | FLUIGENT | EZ-01000002 | Pressure/vacuum controller |
| MilliporeSigma 0.22 µm syringe Filters | Millipore | GSWP04700 | 0.22 μm pore size filter |
| M-Switch | FLUIGENT | MSW002 | Rotary valve |
| Opticrys | NatX-ray | PRT008 | Crystallization bench |
| Siliconized circle cover slides | Hampton Research | HR3-231 | Glass slides |
| Sodium Chloride ≥ 99% | Sigma-Aldrich | 746398 | Chemical |
| Switchboard | FLUIGENT | SWB002 | Switchboard |
| Thermoregulated incubator | Memmert | IPP30 | Thermoregulated incubator |
References
- Blakeley, M. P., Langan, P., Niimura, N., Podjarny, A. Neutron crystallography: opportunities, challenges, and limitations. Current Opinion in Structural Biology. 18 (5), 593-600 (2008).
- Snell, E. H., Van Der Woerd, M. J., Damon, M., Judge, R. A., Myles, D. A. A., Meilleur, F. Optimizing crystal volume for neutron diffraction: D-xylose isomerase. European Biophysics Journal. 35 (7), 621-632 (2006).
- Ng, J. D., Baird, J. K., Coates, L., Garcia-Ruiz, J. M., Hodge, T. A., Huang, S. Large-volume protein crystal growth for neutron macromolecular crystallography. Acta Crystallographica Section F:Structural Biology Communications. 71, 358-370 (2015).
- O'Dell, W. B., Bodenheimer, A. M., Meilleur, F. Neutron protein crystallography: A complementary tool for locating hydrogens in proteins. Archives of Biochemistry and Biophysics. 602, 48-60 (2016).
- Oksanen, E., Blakeley, M. P., Bonneté, F., Dauvergne, M. T., Dauvergne, F., Budayova-Spano, M. Large crystal growth by thermal control allows combined X-ray and neutron crystallographic studies to elucidate the protonation states in Aspergillus flavus urate oxidase. Journal of the Royal Society Interface. 6, (2009).
- Krauss, I. R., Merlino, A., Vergara, A., Sica, F. An overview of biological macromolecule crystallization. International Journal of Molecular Sciences. 14 (6), 11643-11691 (2013).
- Chayen, N. E. Comparative Studies of Protein Crystallization by Vapour-Diffusion and Microbatch Techniques. REVIEW Acta Cryst. , doi: 10.1107/S0907444997005374 (1998).
- Junius, N., Oksanen, E., Terrien, M., Berzin, C., Ferrer, J. L., Budayova-Spano, M. A crystallization apparatus for temperaturecontrolled flow-cell dialysis with real-time visualization. Journal of Applied Crystallography. 49, 806-813 (2016).
- Salemme, F. R. A free interface diffusion technique for the crystallization of proteins for X-ray crystallography. Archives of Biochemistry and Biophysics. 151 (2), 533-539 (1972).
- Chayen, N. E., Saridakis, E. Protein crystallization: From purified protein to diffraction-quality crystal. Nature Methods. 5 (2), 147-153 (2008).
- Otálora, F., Gavira, J. A., Ng, J. D., García-Ruiz, J. M. Counterdiffusion methods applied to protein crystallization. Progress in Biophysics and Molecular Biology. 101 (1-3), 26-37 (2009).
- Garciá-Ruiz, J. M. Counterdiffusion Methods for Macromolecular Crystallization. Methods in Enzymology. 368, 130-154 (2003).
- Budayova-Spano, M., Koruza, K., Fisher, Z. Large crystal growth for neutron protein crystallography. Methods in Enzymology. 634, 21-46 (2020).
- Budayova-Spano, M., Dauvergne, F., Audiffren, M., Bactivelane, T., Cusack, S. A methodology and an instrument for the temperature-controlled optimization of crystal growth. Acta Crystallographica Section D: Biological Crystallography. 63 (3), 339-347 (2007).
- Asherie, N. Protein crystallization and phase diagrams. Methods. 34 (3), 266-272 (2004).
- Astier, J. P., Veesler, S. Using temperature to crystallize proteins: A mini-review. Crystal Growth and Design. 8 (12), 4215-4219 (2008).
- Budayova-Spano, M., et al. A preliminary neutron diffraction study of rasburicase, a recombinant urate oxidase enzyme, complexed with 8-azaxanthin. Acta Crystallographica Section F: Structural Biology and Crystallization Communications. 62 (3), 306-309 (2006).
- Junius, N., Vahdatahar, E., Oksanen, E., Ferrer, J. L., Budayova-Spano, M. Optimization of crystallization of biological macromolecules using dialysis combined with temperature control. Journal of Applied Crystallography. 53 (3), (2020).
- Grimsley, G. R., Pace, C. N. Spectrophotometric Determination of Protein Concentration. Current Protocols in Protein Science. 33 (1), 1-9 (2003).
- McPherson, A., Gavira, J. A. Introduction to protein crystallization. Acta Crystallographica Section F:Structural Biology Communications. 70 (1), 2-20 (2014).
- McPherson, A. Introduction to protein crystallization. Methods. 34 (3), 254-265 (2004).
Reprints and Permissions
