Here, we present a protocol for adenovirus production using the pAdEasy system. The technology includes the recombination of the pAdTrack and pAdEasy-1 plasmids, the adenovirus packaging and amplification, the purification of the adenoviral particles from cell lysate and culture medium, the viral titration, and the functional testing of the adenovirus.
Method Article
An Efficient Method for Adenovirus Production
In This Article
Summary
Abstract
Adenoviral transduction has the advantage of a strong and transient induction of the expression of the gene of interest into a broad variety of cell types and organs. However, recombinant adenoviral technology is laborious, time-consuming, and expensive. Here, we present an improved protocol using the pAdEasy system to obtain purified adenoviral particles that can induce a strong green fluorescent protein (GFP) expression in transduced cells. The advantages of this improved method are faster preparation and decreased production cost compared to the original method developed by Bert Vogelstein. The main steps of the adenoviral technology are: (1) the recombination of pAdTrack-GFP with the pAdEasy-1 plasmid in BJ5183 bacteria; (2) the packaging of the adenoviral particles; (3) the amplification of the adenovirus in AD293 cells; (4) the purification of the adenoviral particles from cell lysate and culture medium; and (5) the viral titration and functional testing of the adenovirus. The improvements to the original method consist of (i) the recombination in BJ5183-containing pAdEasy-1 by chemical transformation of bacteria; (ii) the selection of recombinant clones by “negative” and “positive” PCR; (iii) the transfection of AD293 cells using the K2 transfection system for adenoviral packaging; (iv) the precipitation with ammonium sulfate of the viral particles released by AD293 cells in cell culture medium; and (v) the purification of the virus by one-step cesium chloride discontinuous gradient ultracentrifugation. A strong expression of the gene of interest (in this case, GFP) was obtained in different types of transduced cells (such as hepatocytes, endothelial cells) from various sources (human, bovine, murine). Adenoviral-mediated gene transfer represents one of the main tools for developing modern gene therapies.
Introduction
Adenoviruses are nonenveloped viruses containing a nucleocapsid and a double-stranded linear DNA genome1,2,3. Adenoviruses can infect a broad range of cell types and infection is not dependent on active host cell division. After infection, the adenovirus introduces its genomic DNA into the host cell nucleus, where it stays epichromosomal and is transcribed together with the genes of the host. Thus, a minimal potential risk for insertional mutagenesis or oncogenes regulation is attained4,5,6. The adenoviral genome is not replicated together with the host genome and thus, the adenoviral genes are diluted in a dividing cell population. Among the advantages of adenoviral transduction, there are: (i) high levels of transgene expression; (ii) reduced risks related to the integration of the viral DNA into the host genome, due to episomal expression; (iii) transduction of a wide variety of dividing and non-dividing cell types. Most adenoviruses used in biomedical research are non-replicative, lacking the E1 region7,8,9. For their production, a cell line supplying the E1 sequence (such as HEK293) is required. Besides, a non-essential region for the viral life cycle (E3) was deleted to allow the insertion of a transgene in the viral genome; other regions (E2 and E4) were further deleted in some adenoviruses, but in these cases, a decreased yield of adenoviral production and low expression of the transgene were reported7.
Here, we present an improved protocol for constructing, packaging, and purifying the adenoviruses using the AdEasy System. These improvements allowed the packing of the adenovirus in a faster and more economical way as compared to the original method developed by Bert Vogelstein2,10, due to the following advantages: (i) the recombination in BJ5183-containing pAdEasy-1 by chemical transformation of bacteria; (ii) the selection of the recombinant clones by PCR; (iii) the transfection of AD293 cells using the K2 transfection system for adenoviral packaging; (iv) the precipitation of adenoviral particles from culture medium after viral packaging and amplification; (v) the adenoviral purification using one-step cesium chloride (CsCl) gradient ultracentrifugation.
The protocol for adenovirus production using the AdEasy system (Figure 1) comprises the following steps:
(1) Recombination of pAdTrack-GFP with pAdEasy-1 in BJ5183 bacteria
(2) Packaging of the adenoviral particles
(3) Amplification of the adenovirus
(4) Purification of the adenoviral particles from cell lysate and culture medium
(5) Adenovirus titration.
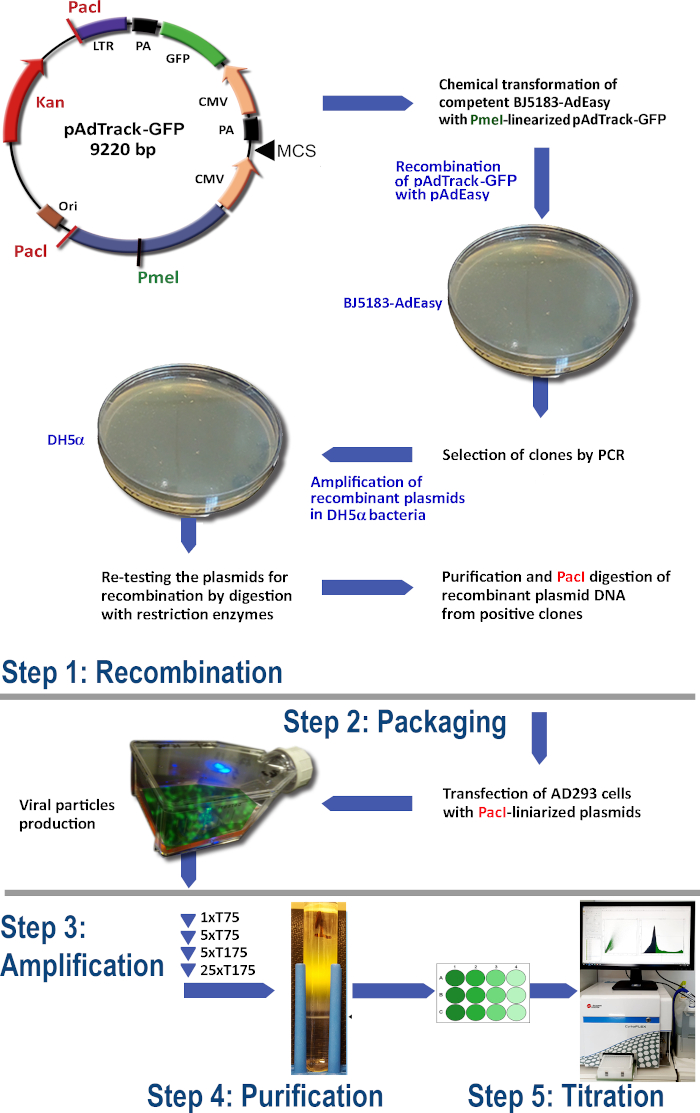
Figure 1: The adenovirus production technology. The main steps of the adenoviral technology are: (1) The recombination of the pAdTrack-GFP with the pAdEasy-1 plasmid in BJ5183 bacteria. The selected recombined plasmids are amplified in DH5α bacteria and then purified; (2) The packaging of the adenoviral particles in AD293 cells, that are producing adeno-E1 proteins; (3) The amplification of the adenovirus in AD293 cells; (4) The purification of the adenoviral particles from the cell lysate and the culture medium by ultracentrifugation on a CsCl density gradient; (5) The titration of the adenovirus and the functional testing. Please click here to view a larger version of this figure.
In this protocol, we exemplified the technology for the production of the adenovirus, which can induce the expression of GFP in the host cells. GFP is already inserted in the backbone of the pAdTrack-CMV shuttle vector (Addgene #16405), under a second CMV promoter and is used as a reporter gene (Figure 1). For this reason, here we designated the pAdTrack-CMV vector as pAdTrack-GFP and we assessed the expression of GFP for demonstrative purposes. Besides GFP expression, the system can be used to overexpress a gene of interest, which may be cloned in the multiple cloning sites of the pAdTrack-CMV. A gene or a minigene cloned in the pAdTrack-CMV is usually more efficient for expression induction as compared with the cDNA11. The data showed a strong GFP expression in transduced cells (such as hepatocytes, endothelial cells) from various sources (human, bovine, murine). Adenoviral-mediated gene transfer represents one of the main tools for developing modern gene therapies.
Protocol
Safety Note: In general, adenoviruses are classified as biosafety level 2 organisms and thus, all manipulations must be done in a Class II biosafety cabinet by a trained person, wearing biohazard protective equipment (including gloves, face-mask for biological aerosols, lab coat, etc.). All solid materials contaminated with the adenovirus must be disinfected with a 10% bleach solution for 30 min and autoclaved for 30 min at 121 °C and 1 bar. Depending on the gene inserted, the adenovirus created may have dangerous potential and may be classified in other biosafety levels.
1. Experimental preparation
- Use a separate cell culture hood for adenoviral manipulations, and a separate incubator for each adenovirus type. Use T flasks with filter caps for viral packaging and amplification; avoid as much as possible transduction experiments in vented Petri plates.
- Empty the cell culture hood after each use and expose it to UV for 15 min.
- Autoclave periodically the pipette aid, pipettes, and other utensils. If possible, culture in a separate cell culture laboratory/hood the cells for adenoviral packaging (AD293 cells) and the cells to be used in transduction experiments. Batches of different adenoviruses amplified in the same period should be checked for cross-contamination by PCR.
- Prepare the following solutions.
- Prepare SOB (Super Optimal Broth) medium: 20 g of tryptone, 5 g of yeast extract, 0.5 g of NaCl (10 mM final concentration), 2.5 mL of 1 M KCl (2.5 mM final concentration), amd H2O to 1 L. After autoclaving at 121 °C, add the following sterile solutions: 5 mL of 1 M MgCl2 and 5 mL of 1 M MgSO4.
- Prepare SOC (Super Optimal broth with Catabolite repression) medium: in 1 L sterile SOB add the following sterile solutions: 20 mL of 1 M glucose, 5 mL of 1 M MgCl2, and 5 mL of 1 M MgSO4.
- Prepare precipitation solution: dissolve 29.5 g of potassium acetate in 60 mL of H2O, add 11.5 mL of acetic acid, and H2O to 100 mL.
- Prepare resuspension buffer: 95 mL of 20% glucose, 5 mL of 1 M Tris-Cl pH 8, 4 mL of 0.5 M EDTA pH 8, and add H2O to 200 mL.
- Prepare lysis solution: 4.8 mL of 8.3 M NaOH, 10 mL of 20%SDS, and H2O to 200 mL.
2. Recombination of pAdTrack-GFP viral vector with pAdEasy-1 plasmid in BJ5183 bacteria
- Linearization of pAdTrack-GFP and purification of the linearized plasmid.
- Prepare the following digestion mix on ice:
10 µg of pAdTrack-GFP
5 µL of 10x colorless buffer
2 µL of Pme I
H2O of to a final volume of 50 µL. - Incubate at 37 °C for 3 hours in a water bath.
- Inactivate at 65 °C for 20 min.
- Check the efficiency of the digestion of pAdTrack-GFP with Pme I: run 1 µg of the digested plasmid in parallel with 1 µg of undigested plasmid on a 0.8% agarose gel.
- Prepare the following digestion mix on ice:
- Isolation and purification of DNA
NOTE: Steps 1-6 need to be performed in a fume hood.- Add an equal volume of phenol/chloroform/isoamyl alcohol (25:24:1) over the digestion mixture and invert the tube until the mixture is homogeneous.
- Centrifuge for 3 min at 16,200 x g, and then transfer the upper aqueous phase to a collection tube.
- Add an equal volume of phenol/chloroform/isoamyl alcohol (25:24:1) over the lower organic phase and vortex.
- Centrifuge for 3 min at 16,200 x g, and then transfer the upper phase to the same collection tube.
- Add an equal volume of chloroform over the aqueous phase harvested in the collection tube and vortex.
- Centrifuge for 3 min at 16,200 x g, and then transfer the upper aqueous phase to a new collection tube.
- Add a 1/10 volume of 3 M sodium acetate, and 2 volumes of cold 100% ethanol and vortex.
- Incubate for 1 hour at -70 °C or overnight at -20 °C.
- Thaw the sample on ice and centrifuge it for 10 min at 16,200 x g and 4 °C.
- Remove the supernatant and add 750 µL of 75% ethanol.
- Centrifuge for 3 min at 16,200 x g and 4 °C and remove the supernatant.
- Briefly spin the tube to remove all the supernatant and dry the pellet in the hood. Do not dry the DNA pellet for a long time because it is tricky to dissolve.
- Dissolve the pellet in 15 µL of H2O.
- Measure the DNA concentration using a spectrophotometer (e.g., Nanodrop).
- Transformation of AdEasier-1 bacteria with pAdTrack-GFP
NOTE: In this step, the recombination of pAdTrack-GFP with pAdEasy-1 plasmid takes place.- Prepare AdEasier-1 (BJ5183-containing pAdEasy-1, Addgene #16399) chemical competent bacteria, using a commercial transformation kit, following the manufacturers’ instructions. Keep aliquots of 100 µL competent bacteria at -80 °C.
- Thaw an aliquot of competent AdEasier-1 bacteria on ice and add 1 µg of purified Pme I -digested pAdTrack-GFP. Mix gently by flicking the tube (do not pipette the mixture). Incubate for 10 min on ice.
- Add 900 µL of SOC medium and incubate for 1 hour at 37 °C with shaking.
- Microfuge for 5 min at 600 x g.
- Remove 900 µL of the supernatant, mix the pellet and the supernatant, and seed the transformed bacteria on LB-agar plates with kanamycin.
- Incubate for ~16 hours at 37 °C (do not exceed 18 hours).
- Selection of the possible positive clones by PCR
- Divide toothpicks into two halves and sterilize the half-toothpicks by autoclaving.
- Pick up small and translucent colonies using sterile half-toothpicks.
- Briefly, rotate the half-toothpick with bacteria in 10 µL water (in a PCR tube) and then put the half-toothpick in a 1.5 mL Eppendorf tube containing 100 µL SOC medium with kanamycin. Incubate for 4-6 hours at 37 °C, while you test the clones by “negative” and “positive” PCR.
- Incubate the PCR tubes containing 10 µL water with bacteria for 5 min at 95 °C to obtain the bacterial sample and run in parallel the “negative” and “positive” PCR.
- “Negative” PCR - to test the pAdTrack-GFP integrity: Prepare the following PCR mix for the negative PCR on ice.
5 µL of the bacterial sample
0.1 µL of primer Forward (4631 F: 5’-CAGTAGTCGGTGCTCGTCCAG)
0.1 µL of primer Reverse (5616 R: 5’-TATGGGGGCTGTAATGTTGTCTC)
0.1 µL of dNTP 10 mM
3 µL of 5x Buffer
1.5 µL of MgCl2 25mM
0.1 µL of GoTaq Polymerase
H2O to a final volume of 15 µL
NOTE: The positive control in which the DNA template is the pAdTrack-GFP vector must be included. - “Positive” PCR - to test the presence of the gene of interest. Use specific primers for the inserted gene and prepare the mix as in the previous step. The primers used for GFP were the following:
F: 5’-CAAGGACGACGGCAACTACA
R: 5’-ATGGGGGTGTTCTGCTGGTA - Run in parallel the “negative” and the “positive” PCR. The PCR Program is: 5 min, 95 °C; 40 cycles of the following steps: 30 sec, 95 °C; 30 sec, 68 °C; 1 min, 72 °C; final elongation: 10 min, 72 °C.
NOTE: Adapt the annealing temperature for amplification the gene of interest. - Evaluate the PCR products on a 1% agarose gel and make the selection of the clones.
- Consider for further processing the clones that give no PCR products for the “negative PCR” and the specific PCR product after the “positive PCR”.
- Grow the bacterial cultures of selected recombinant clones
- Dilute the cultures of the presumed positive clones (resulted in the step 2.4.3.) in 4 mL of SOC medium with kanamycin, and incubate them overnight at 37°C with shaking.
- Isolation of plasmid DNA from AdEasier-1 bacteria (Miniprep using alkaline lysis)
- Transfer 1.5 mL of bacterial culture in microcentrifuge tubes, centrifuge for 1 min at 16,200 x g, and remove the supernatant.
- Transfer another 1.5 mL bacterial culture in the same tube, repeat centrifugation, and remove the supernatant.
- Add 200 µL of resuspension buffer (50 mM glucose, 10 mM EDTA, 25 mM Tris-HCl pH 8).
- Add 200 µL of lysis solution (0.2 N NaOH, 1% SDS), mix gently by inverting the tube.
- Add 200 µL of precipitation solution (60 mL of 5 M potassium acetate, 11.5 mL of glacial acetic acid, add H2O until 100 mL), and mix gently by inverting the tube.
- Centrifuge for 3 min at 16,200 x g.
- Transfer the supernatant in a new microcentrifuge tube, add 500 µL isopropanol, mix and incubate for 20 min on ice.
- Centrifuge for 15 min at 16,200 x g and add 500 µL of 75% ethanol.
- Centrifuge for 10 min at 16,200 x g and remove the supernatant.
- Centrifuge for 3 min at 16,200 x g, remove the supernatant and add 15 µL of H2O.
- Amplification, isolation, and re-testing of the recombined plasmids
- Transformation of DH5α bacteria with the DNA isolated from AdEasier-1 cells.
- Prepare DH5α competent bacteria using the commercial transformation kit, following the manufacturers’ instructions.
- Thaw 100 µL of DH5α competent bacteria on ice, add the recombinant DNA, and incubate 10 min on ice. Then seed the bacteria onto LB-agar plates with kanamycin.
- Incubate at 37 °C overnight.
- Pick-up several colonies and grow each in 2 mL of LB medium with kanamycin, at 37 °C, overnight, with shaking.
- Isolate the DNA (Miniprep using alkaline lysis) and resuspend the obtained DNA in 25 µL H2O.
- Confirm the positive clones by enzymatic digestion.
- Prepare the following mix on ice:
5 µL of recombinant DNA
1.5 µL of 10x colorless Buffer
0.5 µL of Hind III or Pst I
H2O to a final volume of 15 µL - Incubate at 37 °C for 30 min.
NOTE: As a control, digest also the pAdTrack-GFP and pAdEasy-1 plasmids. - In each sample add 3 µL of Sx6 loading buffer with RNase A (if RNase A is not present in the miniprep buffers).
- Run the digested DNA fragments on 1% agarose gel electrophoresis.
NOTE: The digestion pattern of a positive clone includes the majority of fragments of the digested pAdEasy plasmid, revealing pAdEasy recombination with the pAdTrack vector. The gene of interest should be evidenced by digestion with the restriction enzymes used for cloning.
- Prepare the following mix on ice:
- Preparation of plasmid DNA (transfection-grade) for adenovirus packaging.
- Grow a 200 mL culture of bacteria from a positive clone to isolate the plasmid DNA.
- Isolate the plasmid DNA using a commercial kit for plasmid DNA Midiprep (e.g., Qiagen Plasmid Midi Kit) following the manufacturer’s instructions.
- Transformation of DH5α bacteria with the DNA isolated from AdEasier-1 cells.
3. Packaging the adenoviral particles
- Day 1. Seed the AD293 cells
- Wash the AD293 cells with PBS and incubate them with 0.125% Trypsin for 2-5 min at 37 °C.
- Collect the cells in cold medium with serum.
- Centrifuge for 5 min at 400 x g at 4 °C.
- Resuspend the cells in medium with serum and seed the cells at a density of ~2 x 10⁶/T25 flask. Preferably, use a flask with a filter.
- Day 1. Digest the recombinant DNA with Pac I
- Prepare the following mix:
6 µL of recombinant DNA (1 µg/µL)
2 µL of Pac I
2.5 µL of 10x colorless Buffer
H2O to a final volume of 25 µL - Incubate for 3 h (or overnight) at 37 °C, and then inactivate the enzyme at 65 °C for 20 min.
- DNA precipitation with ethanol: add 2.5 µL of (1/10 v/v) 3 M sodium acetate and 2-3 volumes of 100% ethanol. Incubation for 30 min at -70 °C or overnight at -20 °C.
- Centrifuge at 16,200 x g for 30 min at 4 °C and resuspend the pellet in sterile water.
- Prepare the following mix:
- Day 2: Transfection of AD293 cells using K2 reagent
- Add 40 µL of K2 Multiplier over the cells, two hours before transfection.
- Prepare A and B solutions:
Solution A: Add 6 µg of Pac l-linearized DNA in 260 µL of Opti-MEM.
Solution B: Add 21.6 µL of K2 Reagent in 248.4 µL of Opti-MEM. - Add solution A over solution B and mix gently by pipetting.
- Incubate the mixture for 20 min at room temperature. Add dropwise A and B mix to the cells.
- Day 3-11: Monitor the GFP expression by fluorescence microscopy
NOTE: Cells should appear green in fluorescence microscopy and should gradually detach. - Day 11: Harvest the F1 adenoviral particles
- Collect the detached cells and the medium in a 50 mL tube, scrape the adherent cells, and add them in the same tube.
- Centrifuge for 5 min at 400 x g, collect the supernatant in a new tube and resuspend the cell pellet in 0.5 mL of PBS.
- Cell disruption
- Transfer the cell suspension in a microcentrifuge tube.
- Perform three freeze/thaw cycles (freeze in liquid nitrogen or at -80 °C /thaw at 37 °C for maximum 7 min).
- Pass the broken cells through a 23 G syringe needle three times.
- Remove the cell debris by centrifugation at 9,600 x g for 12 min.
- Transfer the supernatant to the 50 mL tube with the collected medium.
4. Amplification of the adenovirus
NOTE: If the AD293 cells did not reach the necessary confluence, the aliquots of the adenoviral stocks (lysate obtained from the virus-producing cells) to be used for infection may be stored at -80 °C.
- Prepare the F2 adenoviral particles.
- Seed the AD293 cells in a T75 flask (5 x 10⁶ cells/flask).
- Infect ~90% confluent AD293 cells using the F1 adenoviral particles: add the cell homogenate and the medium from the T25 flask over the cells grown in the T75 flask.
- Monitor the GFP expression by fluorescence microscopy.
- Harvest the virus-producing cells when ~90% of the transduced AD293 are detached (~ the 5th day after transduction). Keep the cell culture medium at 4 °C.
- Disrupt the cells (similarly with those for F1) in 1 mL PBS.
- Prepare the F3 adenoviral particles.
- Infect ~90% confluent AD293 cells seeded in T175 flask with F2 adenoviral particles and the cell culture medium from the F2 adenoviral particles.
- Harvest the cells (~5 days after transduction).
- Disrupt the cells (similarly with those for F1) in 2 mL of PBS.
- Prepare the F4 adenoviral particles.
- Infect 5 T175 flasks containing ~90% confluent AD293 cells with F3 adenoviral particles and cell culture medium.
- Harvest the cells (~5 days after transduction).
- Disrupt the cells (similarly with those for F1) in 3 mL of PBS.
- Prepare the F5 adenoviral particles.
- Infect 25 T175 flasks containing ~90% confluent AD293 cells with F4 adenoviral stock and cell culture medium.
5. Purification of the adenovirus from cell lysate and culture medium
- Harvesting the virus-producing cells and the culture medium.
- Harvest the AD293 cells of F5 after 5 days from transduction.
- Save the medium in a sterile bottle for precipitation of the adenoviral particles.
NOTE: Keep the medium in the refrigerator until purification of the adenovirus. - Centrifuge the cells at 400 x g, for 5 min, at 4 oC.
- Resuspend the final pellet in 5 mL of 10 mM Tris HCl, pH 8 with 2 mM MgCl2.
- Aliquot the suspension in 1.5 mL tubes.
- Disrupt the cells (similarly with those for F1): three cycles of freezing/thawing.
NOTE: If the ultracentrifugation cannot be performed immediately, keep the samples at -80 °C. - Pass the cell suspension through a 23G syringe needle for three times.
- Centrifuge the homogenate at 9 600 x g, for 12 min.
- Save the supernatant for adenovirus purification by CsCl gradient ultracentrifugation.
- Precipitation of the adenovirus released in the culture medium.
- Bring the bottle with saved cell culture medium at room temperature.
- Add 121 g ammonium sulfate to every 500 mL of cell culture medium (saturation of the solution should be between 40 - 42%).
- Mix carefully until the ammonium sulfate is completely dissolved.
- Incubate for a minimum of 2.5 hours at room temperature.
- Centrifuge at 1600 x g, for 15 min, at 22 oC and save the pellet.
- Resuspend the pellet in 4 mL of 10mM Tris HCl pH 8 with 2mM MgCl2; this suspension should be purified immediately by CsCl gradient ultracentrifugation.
NOTE: If the purification step cannot be subsequently performed, dialyze overnight the resuspended pellet against 10mM Tris HCl, pH 8 with 2mM MgCl2.
- Adenovirus purification by ultracentrifugation.
- Prepare a discontinuous CsCl gradient in polypropylene tubes for SW41Ti rotor. Add 3 mL of 765 mg/mL CsCl (high density: 1.4 g/L) at the bottom of the tube. Slowly add 3 mL of 288.5 mg/mL CsCl (low density: 1.2 g/L) on top of the first CsCl layer.
- Gently overlay 3 - 4 mL of adenoviral particle suspension released from the cells or precipitated from the cell culture medium (as described before) on top of the gradient.
- Fill the tubes with mineral oil, and put the tubes in the cold SW41Ti buckets.
- Equilibrate the tubes. Make sure that the filled polypropylene tubes are loaded symmetrically into the rotor. Put the rotor in the ultracentrifuge.
- Centrifuge at 210,000 x g and 4 °C, for 18 hours, no brake.
- Place the ultracentrifuge tubes on a stand with a black paper behind to get the bands.
- Discard the clear upper phase, the cell debris, and the upper band in a waste container with the bleaching solution.
- Harvest the lowest band that contains the complete adenovirus (~700 µL - 1 mL) in a sterile 1.5 mL tube and keep it on ice.
- Pre-wet a dialysis cassette in dialysis buffer (10 mM Tris-Cl buffer pH 8, 2 mM MgCl2).
- Inject the purified adenovirus into the dialysis cassette using a 2 mL syringe.
- Dialyze overnight against 10 mM Tris-Cl buffer pH 8, 2 mM MgCl2 (change the dialysis buffer 3 - 4 times).
- Harvest the adenoviral stock from the dialysis cassette in aliquots of 10 - 100 μL.
- Add sucrose to 4% final concentration to viral aliquots (for cryoprotection).
- Store aliquots at -80 °C.
6. Adenovirus titration
- Day 1: Plating the cells
- Seed the AD293 cells at a density of 2.5 × 10⁵ cells per well (in a 12-well culture plate) in 1 mL complete growth medium, as shown in Figure 2. Ensure that cells are spread evenly in each well for accurate titer determination.
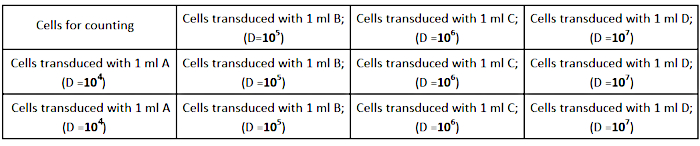
Figure 2: Titration plate design. Please click here to view a larger version of this figure.
- Day 2: Transduction of cells
- Detach the cells from one well with trypsin and count them. Note this number because it will be used to calculate the viral titer.
- Perform serial dilutions (1/104; 1/105; 1/106; 1/107) of the viral stock in 1 mL of complete growth medium as follows:
- 1/103: dilution of the virus stock - add 2 μL of viral stock to 1998 μL of complete medium.
- 1/104: Make 1:10 dilution of 1/103 by diluting 120 μL to 1080 μL of complete medium (A).
- 1/105: Make 1:10 dilution of B by diluting 120 μL of A to 1080 μL of complete medium (B).
- 1/106: Make 1:10 dilution of C by diluting 120 μL of B to 1080 μL of complete medium (C).
- 1/107: Make 1:10 dilution of D by diluting 120 μL of C to 1080 μL of complete medium (D).
NOTE: Prepare 3 tubes of each dilution (A, B, C, D) to perform the experiment in triplicates. - Remove the cell culture medium from the wells and add the prepared dilutions of the virus, as shown in Figure 2.
- Day 3: Monitoring GFP expression
- Check the wells for the presence of green cells using a fluorescence microscope.
- Day 4: Flow cytometry analysis of GFP-positive cells
- Prepare and label twelve 1.5 mL tubes.
- Collect the cell culture medium (together with the detached cells) in 1.5 mL tubes and keep them on ice.
- Add 200 μL of trypsin in each well.
- Incubate the plate for 2 - 3 min at 37 °C in the CO2 incubator.
- Harvest the cells in the same Eppendorf tubes with the cell culture medium. Keep the tubes on ice.
- Pellet the cells at 400 x g, for 5 min, at 4 °C.
- Remove the supernatant; keep the tubes on ice.
- Resuspend the pellet in 250 μL of PBS + 2% FBS; keep the tubes on ice.
- Transfer the cell suspension in flow cytometry tubes or plate.
- Run the samples on a flow cytometer recording the fluorescence of the GFP expressing cells.
Titer calculation: The samples with 5 - 20% GFP positive cells from the parent population should be taken into account for the calculation of viral titer using the following formula:
Titer (TU/mL) = D x F/100 x C/V
D = dilution factor
F = percent of positive cells / 100
C = number of cells / well
V = volume of viral inoculum
7. Adenoviral transduction of target cells and testing of the induced protein expression
- Day 1: Seeding the cells
- Seed the target cells ensuring that they are spread evenly in the wells.
- Day 2: Transduction of the cells
- Detach the target cells from one well and count them.
- Calculate the appropriate volume of adenoviral suspension required to transduce the cells with the desired number of infectious particles per cell.
- Add the corresponding amount of viral suspension to the target cells.
- Day 3: Removal of the viral suspension and checking for GFP expression
- Replace the cell culture medium containing adenoviral particles with fresh medium.
- Check the GFP expression at the fluorescence microscope.
Results
We modified and improved the original Vogelstein’s protocol in order to attain faster and more efficient adenovirus production. First, we revised the methodology to achieve an easier selection of recombinants. After recombination, the BJ5183 bacterial clones were tested by “negative PCR” to assess the integrity of pAdTrack-GFP as an indicator of the lack of recombination (Figure 3A), or by “positive PCR” to identify the gene of interest, assimilated in our case to GFP (Figure 3B). In both “negative” and “positive” PCRs, we used pAdTrack-GFP as a control template, which gave a band of 986 bp for pAdTrack integrity (Figure 3A, lane 1), and a band of 264 bp for GFP (Figure 3B, lane 3). The primers used for the “negative PCR” were designed to amplify a fragment of 986 bp containing the PmeI site in pAdTrack-GFP. This DNA fragment is drastically enlarged after recombination and is not amplified in the positive recombinant clones. Negative clones for recombination, in which pAdTrack-GFP remained intact, are represented in Figure 3A, lanes 3, 4, and 6. The primers anneal on the DNA sequences adjacent to the recombination site. Potential positive recombinant clones (Figure 3A, lanes 2 and 5) expressed GFP as shown in Figure 3B, lane 1, and 2. Plasmid DNA from these clones was isolated and used for DH5α transformation to obtain a higher amount of DNA. These preselected recombinant plasmids amplified in DH5α were then tested by enzymatic digestion. In Figure 3C-E are illustrated the results of the enzymatic digestion of one recombinant-positive clone digested with Hind III, PstI, BamHI restriction enzymes (Figure 3C, D, E lane 2). The HindIII and PstI digestion patterns of the recombinant clone were similar to those obtained for pAdEasy-1 since HindIII and PstI cut the pAdEasy-1 plasmid 24 and 25 times, respectively, (Figure 3C and D, lane 3); HindIII cut once and PstI cut four times the pAdTrack-GFP vector (Figure 3C and D, lane 1). BamHI cut twice pAdEasy-1 vector (Figure 3C, lane 3), and once pAdTrack-GFP (Figure 3C, lane 1).
PacI cut out a fragment of 4.5 kb from the recombinant plasmid (Figure 3F, lane 2), a fragment of 2863 bp from pAdTrack-GFP (Figure 3F, lane 1), and linearized the pAdEasy-1 vector (Figure 3F, lane 3). The DNA ladder is represented in Figure 3C-F, in lanes 4. The recombinant plasmid was digested with Pac I for further use for AD293 transfection.
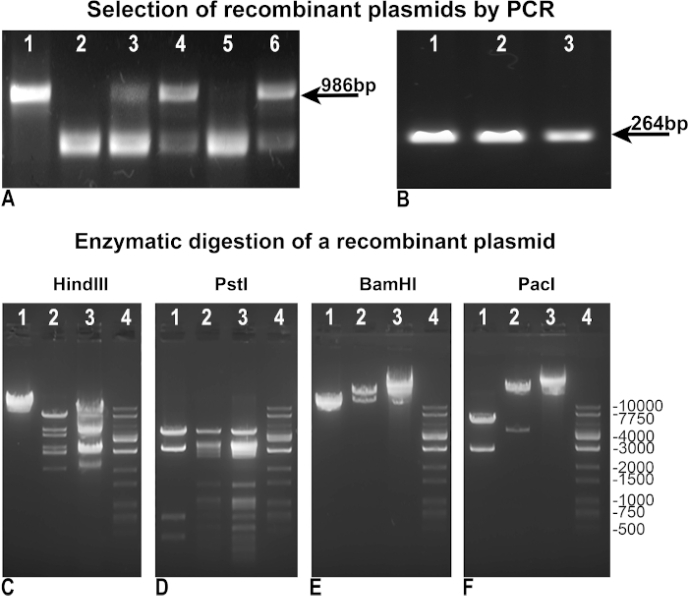
Figure 3: The recombination of pAdTrack-GFP with the pAdEasy-1 plasmid. The plasmids obtained after the recombination of pAdTrack-GFP and pAdEasy-1 were tested by “negative” PCR for the pAdTrack-GFP integrity (A). The non-recombinant clones were evidenced by the presence of a 986 bp band corresponding to the sequence amplified from the pAdTrack-GFP plasmid (A, lanes 3, 4, and 6). The clones potentially positive for recombination (A, lanes 2 and 5) were also obtained. When the pAdTrack-GFP vector was used as a template, a band of 986 bp for pAdTrack-GFP (A, lane 1) was obtained. The potentially positive recombinant clones were tested for GFP expression by “positive” PCR (B); a band of 264 bp appears for both potentially recombined clones (B, lane 1 and 2), as well as for the pAdTrack-GFP plasmid. The DNA from one potential recombinant clone was tested with HindIII, PstI, BamHI, and PacI restriction enzyme (C-F, lanes 2). In the controls, the pAdEasy-1 vector (C-F, lanes 3) and the pAdTrack-GFP plasmid (C-F, lanes 1) were digested with the same enzymes. The DNA ladder is represented in C-F lane 4. Please click here to view a larger version of this figure.
The adenoviral packaging and amplification were performed in AD293 cells. The adenoviral particles (AdV-GFP) were purified from the AD293 cell lysate as well as from the cell culture medium, where they had been released by the infected cells. To concentrate the adenovirus found in the cell culture medium, the particles were precipitated with ammonium sulfate and then resuspended in 10 mM Tris HCl pH 8 with 2 mM MgCl2, the same buffer as that used for cell lysis. Subsequently, the adenoviral particles from the cell lysate and from the culture medium were purified by CsCl discontinuous gradient ultracentrifugation. After ultracentrifugation, a strong band of purified AdV-GFP was obtained, as shown in Figure 4.
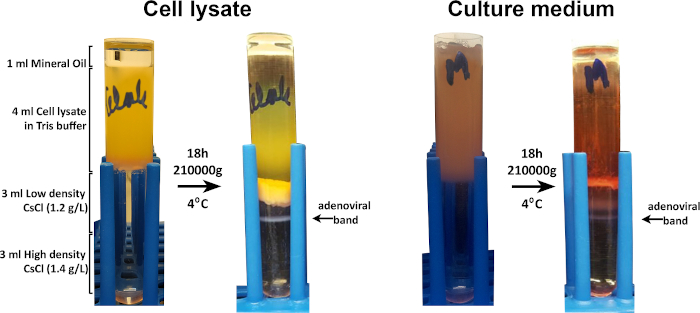
Figure 4: The adenoviral purification by ultracentrifugation on a discontinuous CsCl gradient. The cell homogenate and the adenovirus precipitated from the medium were subjected to ultracentrifugation on a discontinuous gradient formed by low and high-density CsCl solutions. Strong bands of GFP- adenovirus were evidenced in both cases. Please click here to view a larger version of this figure.
To determine the viral titer expressed in transducing units per one mL (TU/mL), the AD293 cells were infected with serial dilutions of the AdV-GFP. After 48 hours, the infected cells expressed GFP, in an inverse correlation with the dilution factor of the viral suspension. This was observed by fluorescence microscopy and the percentage of GFP-positive cells was determined by flow cytometry (Figure 5). To calculate the titer, the viral dilution that induced 5 - 20% of GFP-positive cells was considered (Figure 5C). Usually, we obtain a viral titer of ~1010 (TU/mL) for GFP-adenovirus.
Below, we provide an example of an adenoviral titer calculation for a specific adenoviral batch in which 300000 cells (C) were transduced with 1 mL adenoviral solution (V), at a dilution factor of 106 (D), for which 6% GFP-positive cells (F) were obtained:
Titer (TU/mL) = D x F/100 x C/V = 106 x 6/100 x 300000/1 = 1.8 x 10¹⁰ TU/mL
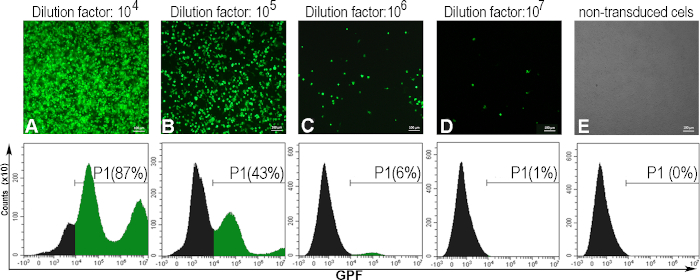
Figure 5: The assessment of the adenoviral titer. AD293 cells were infected with various adenoviral dilutions. Forty-eight hours later, the cells were observed by fluorescence microscopy and analyzed by flow cytometry to determine the percentage of GFP positive cells induced by different adenoviral dilutions (A-D). To establish the gate for flow cytometry, non-transduced cells were also analyzed (E). The titer calculated for the dilution factor 106, when 6% of the cells were GFP positive was 1.8 x 10¹⁰ TU/mL. For panels A-E, bars: 100µm. Please click here to view a larger version of this figure.
To test the transduction potential of the prepared adenovirus, four cell lines were used: human endothelial cells (EA.hy926), bovine aortic endothelial cells (BAEC), murine hepatocytes (Hepa 1-6), and murine mesenchymal stromal cells (MSC). Endothelial cells (EA.hy926 and BAEC) were transduced with 25 TU/cell, the hepatocytes were transduced with 5 TU/cell and MSC were transduced with 250 TU/cell.
Here is an example of how the volume of adenoviral suspension needed to infect 3 x 10⁶ cells with 25 TU/cell, using the adenoviral suspension with 1.8 x 10¹⁰ TU/mL, was calculated.
For 1 cell .............. 25 TU
3 x 10⁶ cells .............. x TU  x=75 x 106 TU
If the viral stock contains
1.8 x 10¹⁰ TU .............. 1 mL
75 x 106 TU .............. y mL y= 4.2 x 10⁻³ mL = 4.2µL of viral stock
Forty-eight hours after transduction, the cells were analyzed by fluorescence microscopy. As shown in Figure 6, human or bovine endothelial cells were transduced with good efficiency (~50%) for 25 TU/cell (Figure 6 EA.hy926 and BAEC). Murine hepatocytes (Hepa 1-6) were efficiently transduced by the adenovirus at a low amount of adenovirus particles (5 TU/cell), but they are also sensitive to the adenovirus since a higher percentage of dead cells (PI-positive cells) was recorded (~16%) as compared to the other cell types. Mesenchymal stromal cells were the most difficult to transduce (Figure 6), due to the lack of specific adenoviral receptors (unpublished data).

Figure 6: The infectivity of the adenovirus and the induction of GFP expression in transduced cells. Human endothelial cells (EA.hy926), bovine aortic endothelial cells (BAEC), murine hepatocytes (Hepa 1-6), and murine mesenchymal stromal cells (MSC) were transduced with the indicated amount of adenovirus. GFP was detected by fluorescence microscopy and the percentage of the GFP positive cells was analyzed by flow cytometry. PI-positive cells determined by flow cytometry show the cell mortality determined by viral transduction. EA.hy926 cells, bovine aortic endothelial cells, and Hepa 1-6 cells were highly transduced by the adenovirus, the yield of transduction ranging from 41 - 52%. For MSC, a higher amount of virus (250 TU/cells) induced only 27% GFP positive of the transduced cells. Bars: 100µm. Please click here to view a larger version of this figure.
Discussion
Recombinant adenoviruses are a versatile tool for gene delivery and expression12,13,14. To induce strong protein expression by adenoviral transduction, the encoding sequence of the gene of interest is inserted in the genome of the adenovirus. The AdEasy adenoviral system, developed in the laboratory of Bert Vogelstein, comprises a backbone plasmid (pAdEasy-1) containing most of the wild-type adenovirus serotype 5 genome, and a shuttle vector (pAdTrack), designed for gene cloning2,10. The deletion of the adenoviral genes E1 (responsible for the assembly of infectious virus particles) and E3 (encoding proteins involved in evading host immunity) created a space in the adenoviral genome, in which a gene of interest of 6.5-7.5 kb can be inserted2,3. This size is sufficient for many genes, especially for those with shorter introns15,16,17. There are also researchers reporting the production of adenoviruses carrying the cDNA of a transgene18,19,20. However, we obtained a lower yield of transgene expression for cDNA-carrying adenoviruses than for their counterparts carrying a gene or a mini-gene (data not shown).
Improving and adapting the previous methods2,10,14,18,21, the technology for adenoviral production requires a shorter time, lower cost, and less effort. The full-length adenoviral DNA is obtained by recombination between the shuttle vector and the pAdEasy-1 plasmid in the homologous recombination prone E. coli strain, BJ5183. The protocol implies the chemical transformation of AdEasier-1 cells (BJ5183 bacteria containing pAdEasy-1). This technique does not require an electroporator that may not be available in some laboratories, is very simple, increases the recombination yield, and reduces the time necessary to obtain competent cells and to perform the transformation. The preselection of recombinant clones performed by PCR further shortens the time and eases the whole procedure. A similar procedure was used by Zhao and co-workers22, however, in the protocol, we optimized the sequences of the primers.
For the GFP-adenovirus packaging and amplification, a HEK293 derivative cell line was used, namely AD293 cells, which are more adherent to the culture plate. Other cell lines commonly used for adenoviral production are the following: 911, 293FT, pTG6559 (A549 derivative), PER.C6 (HER derivative), GH329 (HeLa derivative), N52.E6, and HeLa-E123,24,25,26. In our hands, no improvement in the adenoviral production was obtained when 911 cells were used (data not shown). The transfection of AD293 cells with the recombinant plasmid using K2 reagent highly increased the efficiency of the viral packaging step. After adenovirus production, up to ~70% of the adenovirus is still inside the cells and is released by three freezing and thawing cycles. Increasing the number of cycles is not suitable because it destroys the adenovirus.
Throughout the routine adenoviral production process, numerous viral particles are released in the cell culture medium. Discarding this cell culture medium during the harvesting of the infected AD293 cells would result in an important viral loss. We optimized the protocol described by Schagen and co-workers to purify the adenoviral particles from the cell culture medium by precipitation with ammonium sulfate27. This method has a higher efficiency in adenovirus recovery from the cell culture medium as compared with the method using polyethylene glycol28. The precipitated adenovirus should be purified immediately by ultracentrifugation or kept in the refrigerator for a couple of days but only after dialysis, to remove the salt excess. Keeping the precipitate longer than a few hours without dialysis is harmful to the virus.
Purification of the adenoviral particles by ultracentrifugation performed in one-step reduces the manipulation of the adenoviral stock and eases the procedure as compared with the protocols using successive ultracentrifugation steps14,29. Dialysis of the purified adenovirus is necessary to remove cesium chloride that may further affect transduction. In the protocol, we used Tris buffer containing MgCl2 but not sucrose for dialysis, since it requires a huge, unjustified amount of sucrose that is needed otherwise as a preservative for freezing. Thus, we added sucrose later, directly into the adenoviral stocks prepared for freezing. To avoid frequent freezing and thawing of the purified adenovirus, it is advisable to aliquot the adenoviral stocks and to store them at -80 °C. The adenoviral titer was evaluated by flow cytometry considering the GFP reporter gene and the percentage of transduced cells for a specific viral dilution. This method is faster as compared with the classical “plaque assay” and is more trustful as compared with the evaluation of the capsid proteins (by various methods such as ELISA or flow cytometry) which does not reveal the capacity of infection of the adenoviral particles. However, ELISA-based quantification, Q-PCR, or plaque assay using commercially available kits are alternative methods, especially useful for titration of adenoviruses which do not contain a fluorescent tracer.
Considering that pAdTrack adenoviruses are derived from human adenoviruses serotype 5 which is recognized by Coxsackievirus and Adenovirus Receptors (CAR), we demonstrated the capacity of the GFP-adenovirus to transduce cells of human origin (endothelial cells), but also cells of other origins: bovine (endothelial cells) and murine (mesenchymal stromal cells and hepatocytes). The data showed that the GFP-adenovirus can induce a high level of expression of a transgene.
In conclusion, we optimized this laborious technology to reduce the time, the costs, and the effort needed to obtain the adenoviral particles. The adenovirus prepared is able to infect various cell types and to induce the expression of the gene of interest. This protocol may be used in a variety of experiments since the adenoviral-mediated gene transfer represents one of the main tools for developing modern gene therapies.
ABBREVIATIONS: AdV-GFP, adenoviral particles; BAEC, bovine aortic endothelial cells; CsCl, cesium chloride; GFP, green fluorescent protein; MSC, mesenchymal stromal cells; TU, transducing units.
Disclosures
The authors have nothing to disclose.
Acknowledgements
This work was supported by a Project co-financed from the European Regional Development Fund through the Competitiveness Operational Program 2014-2020 (POC-A.1-A.1.1.4-E-2015, ID: P_37_668; acronym DIABETER), a grant of the Romanian Ministry of Research and Innovation PCCDI- UEFISCDI, Project number PN-III-P1-1.2-PCCDI-2017-0697 within PNCD III and by the Romanian Academy. The authors thank Kyriakos Kypreos (University of Patras, Greece) for his generous and relevant advice, Ovidiu Croitoru (University of Fine Arts, Bucharest, Romania) for filming, film editing, and graphical design, and Mihaela Bratu for technical assistance.
Materials
| Name | Company | Catalog Number | Comments |
|---|---|---|---|
| AD293 cells | Agilent Technologies | 240085 | |
| AdEasier-1 cells | Addgene | 16399 | |
| Agarose I (for electrophoresis) | Thermo Scientific | 17850 | |
| Ammonium sulfate | Sigma | A4418 | |
| Ampicillin sodium salt | Sigma | A0166 | |
| BamH I | Thermo Scientific | FD0054 | |
| Cell culture plates 100 mm | Eppendorf | 30702115 | |
| Cesium chloride | Sigma | L4036 | |
| DH5alpha bacteria | Thermo Scientific | 18265017 | |
| DMEM (GlutaMAX, 4.5g/L D-Glucose) | Gibco | 3240-027 | |
| EA.hy926 cells | ATCC | CRL-2922 | |
| EDTA | Sigma | E5134 | |
| Ethanol (99.8%) | Roth | 5054.2 | |
| Fetal Bovine Serum | Sigma | F7524 | |
| Flasks T25, T75, T175 | Eppendorf | 30712129 | |
| Glucose | Sigma | G7021 | |
| Hepa 1-6 murine hepatocytes | ATCC | CRL-1830 | |
| Hind III | Thermo Scientific | FD0504 | |
| Kanamycin Sulfate | Thermo Scientific | 15160054 | |
| K2 Transfection System | Biontex | T060-5.0 | |
| LB medium | Formedium | LBx0102 | |
| LB-agar | Formedium | LBx0202 | |
| Mix & Go E. coli Transformation kit | Zymo Research | T3001 | |
| Midori Green Advanced DNA stain | Nippon Genetics Europe | MG-04 | |
| NaOH | Sigma | S8045 | |
| Opti-MEM | Thermo Scientific | 31985070 | |
| Pac I | Thermo Scientific | FD2204 | |
| pAdEasy-1 | Addgene | 16400 | |
| pAdTrack-CMV | Addgene | 16405 | |
| Phenol:chloroform:isoamyl alcohol (24:24:1) | Invitrogen | 15593-031 | |
| Polymerase GoTaq | Promega | M3005 | |
| Pme I (Mss I) | Thermo Scientific | FD1344 | |
| Potassium acetate | VWR Chemicals | 43065P | |
| Pst I | Thermo Scientific | FD0614 | |
| Qiagen Midi Prep kit | Qiagen | 12125 | |
| Cell Scraper | TPP | 99003 | |
| SDS | Thermo Scientific | 28365 | |
| Slide-A-Lyzer dialysis cassettes | Thermo Scientific | 66330 | |
| Sodium pyruvate | SIGMA | P5280-100G | |
| Syringe with 23G neeedle | B Braun | 464BR | |
| Tris HCl | Sigma | 1185-53-1 | |
| Trypan blue | Roth | CN76.1 | |
| Tubes 50ml | TPP | 91050 | |
| Ultra-Clear Tubes (14x89 mm) | Beckman Coulter | 344059 | |
| Centrifuge (refrigerated) | Sigma Sartorius | 3-19KS | |
| HeraeusFresco 17 Microcentrifuge | Thermo Scientific | 75002420 | |
| Ultracentrifuge with SW41Ti rotor | Beckman Coulter | Optima L-80 XP | |
| Culture Hood | Thermo Scientific | Class II | |
| Pipettes (0-2µl, 1-10µl, 2-20µl, 10-100µl, 20-200µl, 100-1000µl) | Thermo Scientific | ||
| Dry Block Heating Thermostat | Biosan | TDB-120 | |
| Thermocycle | SensoQuest | 012-103 | |
| Water Bath | Memmert | WNB 14 |
References
- Lee, C. S., et al. Adenovirus-Mediated Gene Delivery: Potential Applications for Gene and Cell-Based Therapies in the New Era of Personalized Medicine. Genes and Diseases. 4 (2), 43-63 (2017).
- He, T. C., et al. A simplified system for generating recombinant adenoviruses. Proceedings of the National Academy of Sciences of the United States of America. 95 (5), 2509-2514 (1998).
- Russell, W. C. Update on adenovirus and its vectors. The Journal of General Virology. 81, Pt 11 2573-2604 (2000).
- Rauschhuber, C., Noske, N., Ehrhardt, A. New insights into stability of recombinant adenovirus vector genomes in mammalian cells. European Journal of Cell Biology. 91 (1), 2-9 (2012).
- Saha, B., Wong, C. M., Parks, R. J. The adenovirus genome contributes to the structural stability of the virion. Viruses. 6 (9), 3563-3583 (2014).
- Kreppel, F., Kochanek, S. Modification of adenovirus gene transfer vectors with synthetic polymers: a scientific review and technical guide. Molecular Therapy: the Journal of the American Society of Gene Therapy. 16 (1), 16-29 (2008).
- Dormond, E., Perrier, M., Kamen, A. From the first to the third generation adenoviral vector: what parameters are governing the production yield. Biotechnol Advances. 27 (2), 133-144 (2009).
- Parks, R. J., et al. A helper-dependent adenovirus vector system: removal of helper virus by Cre-mediated excision of the viral packaging signal. Proceedings of the National Academy of Sciences of the United States of America. 93 (24), 13565-13570 (1996).
- Jager, L., Ehrhardt, A. Emerging adenoviral vectors for stable correction of genetic disorders. Current Gene Therapy. 7 (4), 272-283 (2007).
- Luo, J., et al. A protocol for rapid generation of recombinant adenoviruses using the AdEasy system. Nature Protocols. 2 (5), 1236-1247 (2007).
- Dumitrescu, M., et al. Adenovirus-Mediated FasL Minigene Transfer Endows Transduced Cells with Killer Potential. International Journal of Molecular Sciences. 21 (17), (2020).
- Campos, S. K., Barry, M. A. Current advances and future challenges in Adenoviral vector biology and targeting. Current Gene Therapy. 7 (3), 189-204 (2007).
- Khare, R., Chen, C. Y., Weaver, E. A., Barry, M. A. Advances and future challenges in adenoviral vector pharmacology and targeting. Current Gene Therapy. 11 (4), 241-258 (2011).
- Jager, L., et al. A rapid protocol for construction and production of high-capacity adenoviral vectors. Nature Protocols. 4 (4), 547-564 (2009).
- Zvintzou, E., et al. Pleiotropic effects of apolipoprotein C3 on HDL functionality and adipose tissue metabolic activity. Journal of Lipid Research. 58 (9), 1869-1883 (2017).
- Karavia, E. A., et al. Apolipoprotein A-I modulates processes associated with diet-induced nonalcoholic fatty liver disease in mice. Molecular Medicine. 18, 901-912 (2012).
- Lampropoulou, A., Zannis, V. I., Kypreos, K. E. Pharmacodynamic and pharmacokinetic analysis of apoE4 [L261A, W264A, F265A, L268A, V269A], a recombinant apolipoprotein E variant with improved biological properties. Biochemical Pharmacology. 84 (11), 1451-1458 (2012).
- Zheng, S. Y., Li, D. C., Zhang, Z. D., Zhao, J., Ge, J. F. Adenovirus-mediated FasL gene transfer into human gastric carcinoma. World Journal of Gastroenterology. 11 (22), 3446-3450 (2005).
- Ambar, B. B., et al. Treatment of experimental glioma by administration of adenoviral vectors expressing Fas ligand. Human Gene Therapy. 10 (10), 1641-1648 (1999).
- Okuyama, T., et al. Efficient Fas-ligand gene expression in rodent liver after intravenous injection of a recombinant adenovirus by the use of a Cre-mediated switching system. Gene Therapy. 5 (8), 1047-1053 (1998).
- van Dijk, K. W., Kypreos, K. E., Fallaux, F. J., Hageman, J. Adenovirus-mediated gene transfer. Methods in Molecular Biology. 693, 321-343 (2011).
- Zhao, Y. D., Li, T., Huang, G. A simple negative selection method to identify adenovirus recombinants using colony PCR. Electronic Journal of Biotechnology, North America. 17 (1), 46-49 (2014).
- Kovesdi, I., Hedley, S. J. Adenoviral producer cells. Viruses. 2 (8), 1681-1703 (2010).
- Lin, X. Construction of new retroviral producer cells from adenoviral and retroviral vectors. Gene Therapy. 5 (9), 1251-1258 (1998).
- Fallaux, F. J., et al. Characterization of 911: a new helper cell line for the titration and propagation of early region 1-deleted adenoviral vectors. Human Gene Therapy. 7 (2), 215-222 (1996).
- Altaras, N. E., et al. Production and formulation of adenovirus vectors. Advances in Biochemical Engineering/ Biotechnology. 99, 193-260 (2005).
- Schagen, F. H., et al. Ammonium sulphate precipitation of recombinant adenovirus from culture medium: an easy method to increase the total virus yield. Gene Therapy. 7 (18), 1570-1574 (2000).
- Colombet, J., et al. Virioplankton 'pegylation': use of PEG (polyethylene glycol) to concentrate and purify viruses in pelagic ecosystems. Journal of Microbiological Methods. 71 (3), 212-219 (2007).
- Kypreos, K. E., van Dijk, K. W., van Der Zee, A., Havekes, L. M., Zannis, V. I. Domains of apolipoprotein E contributing to triglyceride and cholesterol homeostasis in vivo. Carboxyl-terminal region 203-299 promotes hepatic very low density lipoprotein-triglyceride secretion. Journal of Biological Chemistry. 276 (23), 19778-19786 (2001).
Reprints and Permissions
