MAPS technology has been developed to scrutinize the targetome of a specific regulatory RNA in vivo. The sRNA of interest is tagged with a MS2 aptamer enabling the co-purification of its RNA partners and their identification by RNA sequencing. This modified protocol is particularly suited for Gram-positive bacteria.
Method Article
MS2-Affinity Purification Coupled with RNA Sequencing in Gram-Positive Bacteria
In This Article
Summary
Abstract
Although small regulatory RNAs (sRNAs) are widespread among the bacterial domain of life, the functions of many of them remain poorly characterized notably due to the difficulty of identifying their mRNA targets. Here, we described a modified protocol of the MS2-Affinity Purification coupled with RNA Sequencing (MAPS) technology, aiming to reveal all RNA partners of a specific sRNA in vivo. Broadly, the MS2 aptamer is fused to the 5’ extremity of the sRNA of interest. This construct is then expressed in vivo, allowing the MS2-sRNA to interact with its cellular partners. After bacterial harvesting, cells are mechanically lysed. The crude extract is loaded into an amylose-based chromatography column previously coated with the MS2 protein fused to the maltose binding protein. This enables the specific capture of MS2-sRNA and interacting RNAs. After elution, co-purified RNAs are identified by high-throughput RNA sequencing and subsequent bioinformatic analysis. The following protocol has been implemented in the Gram-positive human pathogen Staphylococcus aureus and is, in principle, transposable to any Gram-positive bacteria. To sum up, MAPS technology constitutes an efficient method to deeply explore the regulatory network of a particular sRNA, offering a snapshot of its whole targetome. However, it is important to keep in mind that putative targets identified by MAPS still need to be validated by complementary experimental approaches.
Introduction
Hundreds, perhaps even thousands of small regulatory RNAs (sRNAs) have been identified in most bacterial genomes, but the functions of the vast majority of them remain uncharacterized. Overall, sRNAs are short non-coding molecules, playing major roles in bacterial physiology and adaptation to fluctuating environments1,2,3. Indeed, these macromolecules are at the center of numerous intricate regulatory networks, impacting metabolic pathways, stress responses but also virulence and antibiotic resistance. Logically, their synthesis is triggered by specific environment stimuli (e.g., nutrient starvation, oxidative or membrane stresses). Most sRNAs regulate multiple target mRNAs at the post-transcriptional level through short and non-contiguous base pairing. They usually prevent translation initiation by competing with ribosomes for translation initiation regions4. The formation of sRNA:mRNA duplexes also often results in the active degradation of the target mRNA by recruitment of specific RNases.
The characterization of an sRNA targetome (i.e., the whole set of its target RNAs) allows the identification of the metabolic pathways in which it intervenes and the potential signal it answers to. Consequently, the functions of a specific sRNA can generally be inferred from its targetome. For this purpose, several in silico prediction tools have been developed such as IntaRNA and CopraRNA5,6,7. They notably rely on sequence complementarity, pairing energy and accessibility of the potential interaction site to determine putative sRNA partners. However, prediction algorithms do not integrate all factors influencing base-pairing in vivo such as the involvement of RNA chaperones8 favoring sub-optimal interactions or the co-expression of both partners. Due to their inherent limitations, the false positive rate of prediction tools remains high. Most experimental large-scale approaches are based on the co-purification of sRNA:mRNA couples interacting with a tagged RNA binding protein (RBP)6,9. For example, the RNA Interaction by Ligation and sequencing (RIL-seq) method identified RNA duplexes co-purified with RNA chaperones such as Hfq and ProQ in Escherichia coli10,11. A similar technology called UV-Crosslinking, Ligation And Sequencing of Hybrids (CLASH) was applied to RNase E- and Hfq-associated sRNAs in E. coli12,13. Despite the well-described roles of Hfq and ProQ in sRNA-mediated regulation in multiple bacteria8,14,15, sRNA-based regulation seems to be RNA chaperone-independent in several organisms like S. aureus16,17,18. Even if the purification of RNA duplexes in association with RNases is feasible as demonstrated by Waters and coworkers13, this remains tricky as RNases trigger their rapid degradation. Hence, the MS2-Affinity Purification coupled with RNA Sequencing (MAPS) approach19,20 constitutes a solid alternative in such organisms.
Unlike above-mentioned methods, MAPS uses a specific sRNA as bait to capture all interacting RNAs and hence does not rely on the involvement of an RBP. The entire process is depicted in Figure 1. In brief, the sRNA is tagged at the 5’ with the MS2 RNA aptamer that is specifically recognized by the MS2 coat protein. This protein is fused with the maltose binding protein (MBP) to be immobilized on an amylose resin. Therefore, MS2-sRNA and its RNA partners are retained on the affinity chromatography column. After elution with maltose, co-purified RNAs are identified using high-throughput RNA sequencing followed by bioinformatic analysis (Figure 2). The MAPS technology ultimately draws an interacting map of all potential interactions occurring in vivo.
MAPS technology was originally implemented in the non-pathogenic Gram-negative bacterium E. coli21. Remarkably, MAPS helped identify a tRNA-derived fragment specifically interacting with both RyhB and RybB sRNAs and preventing any sRNA transcriptional noise to regulate mRNA targets in non-inducing conditions. Thereafter, MAPS has been successfully applied to other E. coli sRNAs like DsrA22, RprA23, CyaR23 and GcvB24 (Table 1). In addition to confirming previously known targets, MAPS extended the targetome of these well-known sRNAs. Recently, MAPS has been performed in Salmonella Typhimurium and revealed that SraL sRNA binds to rho mRNA, coding for a transcription termination factor25. Through this pairing, SraL protects rho mRNA from the premature transcription termination triggered by Rho itself. Interestingly, this technology is not restricted to sRNAs and can be applied to any type of cellular RNAs as exemplified by the use of a tRNA-derived fragment26 and a 5’-untranslated region of mRNA22 (Table 1).
MAPS method has been also adapted to the pathogenic Gram-positive bacterium S. aureus19. Specifically, the lysis protocol has been widely modified to efficiently break cells due to a thicker cell wall than Gram-negative bacteria and to maintain RNA integrity. This adapted protocol already unravelled the interactome of RsaA27, RsaI28 and RsaC29. This approach gave insights into the crucial role of these sRNAs in regulatory mechanisms of cell surface properties, glucose uptake, and oxidative stress responses.
The protocol developed and implemented in E. coli in 2015 has been recently described in great detail30. Here, we provide the modified MAPS protocol, which is particularly suitable for studying sRNA regulatory networks in Gram-positive (thicker cell wall) bacteria whether non-pathogenic or pathogenic (safety precautions).
Protocol
1. Buffers and media
- For MAPS experiments, prepare the following buffers and media:
- Buffer A (150 mM KCl, 20 mM Tris-HCl pH 8, 1 mM MgCl2 and 1 mM DTT)
- Buffer E (250 mM KCl, 20 mM Tris-HCl pH 8, 12 mM maltose, 0.1% Triton, 1 mM MgCl2 and 1 mM DTT)
- RNA loading buffer (0.025% xylene cyanol and 0.025% bromophenol blue in 8 M urea)
- Brain Heart Infusion (BHI) medium (12.5 g of calf brain, 10 g of peptone, 5 g of beef heart, 5 g of NaCl, 2.5 g of Na2HPO4 and 2 g of glucose for 1 L)
- Lysogeny Broth (LB) medium (10 g of peptone, 5 g of yeast extract and 10 g of NaCl for 1 L) - For Northern blot assays, prepare the following buffers:
- Blocking solution (1x maleic acid and 1% blocking reagent)
- Hybridization solution (50% formamide, 5x SSC, 7% SDS, 1% blocking solution and 0.2% N-lauryl sarcosine, 50 mM sodium phosphate). Heat with agitation to dissolve.
CAUTION: Carefully follow the safety precautions related to each product.
- 1 M sodium phosphate (58 mM sodium phosphate dibasic and 42 mM sodium phosphate monobasic)
- Saline, sodium citrate (SSC) buffer, 20x concentrate (3 M NaCl and 300 mM trisodium citrate)
2. Safety issues
- Carry out all steps involving viable pathogenic bacteria in a level 2 containment lab.
NOTE: Only cell extracts can be taken outside after lysis (step 5). - Put on a lab coat and gloves.
- Ensure that the wrists are covered.
- Clean the biological safety cabinet (Class II) with a disinfectant solution.
- Dispose solid wastes exposed to bacteria in the appropriate biomedical bin.
- Treat flasks containing contaminated liquids with a disinfectant solution. Then, discard it in a sink.
- Carefully wash hands and wrists with soap and remove the lab coat before leaving the level 2 containment lab.
3. Plasmid construction
NOTE: For cloning purposes, it is crucial to first identify the boundaries of the endogenous sRNA. The pCN51-P3 and pCN51-P3-MS2 plasmids are described in Tomasini et al. (2017)27. The P3 promoter allows high expression of the sRNA in a cell-density-dependent manner (i.e., when bacteria enter the stationary phase of growth). Many staphylococcal sRNAs accumulate during this growth phase.
- Amplify the sRNA sequence by PCR using a high-fidelity DNA polymerase and a PCR machine. Carefully follow manufacturer’s instructions and read Garibyan and Avashia (2013)31 for more details.
- Use the following templates to design the specific primers:

and 5’-CGCGGATCC(N)-3’ for forward and reverse primers, respectively.
NOTE: These oligonucleotides enable to fuse the MS2 sequence (in bold) to the 5’ end of the sRNA of interest. PstI and BamHI restriction sites (underlined) are added at the 5’ and 3’ extremities of the MS2-sRNA construct to clone the amplicon into the pCN51-P3 plasmid27. (N) corresponds to the gene-specific sequence (15-20 nucleotides). - Digest 1 µg of pCN51-P3 plasmid and 1 µg of the MS2-sRNA PCR product with 2 U of PstI and 1 U of BamHI in the appropriate buffer according to manufacturer’s recommendations.
- Incubate 1 h at 37 °C and purify DNA using a PCR purification kit (see Table of Materials).
- Mix the digested pCN51-P3 plasmid (300 ng) and MS2-sRNA amplicon (molar ratio for vector:insert = 1:3) in a 1.5 mL tube. See Revie et al. (1988)32 to maximize ligation efficiency. Add 1 µL of the Ligase Buffer and 10 U of T4 Ligase in each tube. Adjust the volume to 10 µL with ultrapure water.
- Incubate at 22 °C for at least 2 h.
- Add 5 µL of ligation mixture to 50 µL of frozen DH5α chemically competent E. coli cells. Read Seidman et al. (2001)33 to learn more about plasmid transformation and chemically competent cells.
- Incubate 30 min on ice.
- Heat shock (45 s at 42 °C) the transformation tube using a heat block or water bath.
- Add 900 µL of LB medium and incubate at 37 °C for 30 min.
- Plate 100 µL of the bacterial suspension on a LB agar plate supplemented with ampicillin (100 µg/µL).
NOTE: the pCN51-P3 vector encodes an ampicillin resistance gene, which enables to select only E. coli clones carrying the pCN51-P3-MS2-sRNA plasmid. - Extract the pCN51-P3-MS2-sRNA plasmid from an overnight bacterial culture (5 mL) grown in the presence of ampicillin (100 µg/µL) using a plasmid DNA miniprep kit (see Table of Materials).
- Verify the construct by Sanger sequencing34 using the following primer, 5’-TCTCGAAAATAATAGAGGG-3’.
- Transform the pCN51-P3-MS2-sRNA plasmid into DC10B chemically competent E. coli cells. Repeat steps 3.7 to 3.11.
- Extract the pCN51-P3-MS2-sRNA plasmid (see step 3.12) and transform 1-5 µg of plasmid DNA into HG001 ΔsRNA electrocompetent S. aureus cells using an electroporation apparatus. Carefully follow manufacturer’s instructions. Read Grosser and Richardson (2016)35 to learn more about methods for preparing electrocompetent S. aureus.
CAUTION: This step involves handling of pathogenic bacteria (see step 2). - Add 900 µL of BHI medium and incubate at 37 °C for 3 h.
- Centrifuge 1 min at 16,000 x g. Discard the supernatant.
- Resuspend the pellet in 100 µL of BHI and plate the bacterial suspension on BHI agar plates supplemented with erythromycin (10 µg/µL).
NOTE: The pCN51-P3 vector also encodes an erythromycin resistance gene, which enables to select only S. aureus clones carrying the pCN51-P3-MS2-sRNA plasmid.
4. Bacteria harvesting
CAUTION: This step involves handling of pathogenic bacteria (see step 2).
- Grow one colony of strains carrying either pCN51-P3-MS2-sRNA or pCN51-P3-MS227 plasmids in 3 mL of BHI medium supplemented with erythromycin (10 µg/µL) in duplicates.
- Dilute each overnight culture in 50 mL (≈1/100) of fresh BHI medium supplemented with erythromycin (10 µg/µL) to reach an OD600nm of 0.05. Use 250 mL sterilized flasks (5:1 flask-to-medium ratio).
NOTE: Medium and growth conditions should be set according to the expression pattern of the studied sRNA. - Grow cultures at 37 °C with shaking at 180 rpm for 6 h.
- Transfer each culture into a 50 mL centrifuge tube.
- Centrifuge at 2,900 x g during 15 min at 4 °C. Discard the supernatant.
- Keep pellets on ice and directly perform mechanical cell lysis (step 5) or freeze and store pellets at -80 °C.
5. Mechanical cell lysis
CAUTION: Following steps must be performed on ice and buffers must be at 4 °C. Use gloves and take all precautions to protect samples from RNases.
- Resuspend pellets (step 4.6) in 5 mL of Buffer A.
- Transfer the resuspended cells in 15 mL centrifuge tubes with 3.5 g of silica beads (0.1 mm).
- Insert tubes in a mechanical cell lysis instrument (see Table of Materials). Run a cycle of 40 s at 4.0 m/s.
NOTE: If one cycle is not enough to break cells, let the device cool for 5 min while keeping samples on ice. Then, repeat another cycle of 40 s at 4.0 m/s. The efficiency of cell lysis can be tested by plating the supernatant on BHI-agar plate. - Centrifuge at 15,700 x g for 15 min. Recover the supernatant and keep it on ice.
6. Column preparation
CAUTION: Be careful not to allow the amylose resin to dry. If needed, seal the column with an end-cap. Prepare all the solutions before starting the affinity purification.
- Put a chromatography column in a column rack (see Table of Materials).
- Remove the column tip and wash the column with ultrapure water.
- Add 300 µL of amylose resin.
- Wash the column with 10 mL of Buffer A.
- Dilute 1,200 pmol of MBP-MS2 protein in 6 mL of Buffer A and load it into the column.
- Wash the column with 10 mL of Buffer A.
7. MS2-affinity purification (Figure 1)
- Load the cell lysate into the column.
NOTE: Keep 1 mL of the cell lysate (Crude extract, CE) to extract total RNA (step 8) and perform Northern blot (step 9) and transcriptomic (step 10) analysis. - Collect the flow-through fraction (FT) in a clean collection tube.
- Wash the column 3 times with 10 mL of Buffer A. Collect the wash fraction (W).
- Elute the column with 1 mL of Buffer E and collect the elution fraction (E) in a 2 mL microtube.
- Keep all collected fractions on ice until RNA extraction (step 8) or freeze them at -20 °C for later use.
8. RNA extraction of collected fractions (CE, FT, W and E)
- Use 1 mL of each fraction (including FT and W) for RNA extraction.
- Add 1 volume of phenol. Mix vigorously.
CAUTION: Phenol is volatile and corrosive, pay attention and work safely under a fume hood. - Centrifuge at 16,000 x g for 10 min at 20 °C.
- Transfer the upper phase in a clean 2 mL microtube.
- Add 1 volume of chloroform/isoamyl alcohol (24:1) and repeat steps 8.3 to 8.4.
CAUTION: Work safely under a fume hood. - Add 2.5 volumes of cold ethanol 100% and 1/10 volume of 3 M sodium acetate (NaOAc) pH 5,2.
- Precipitate overnight at -20 °C.
NOTE: Precipitation can also be performed in an ethanol/dry ice bath during 20 min or at -80 °C during 2 h. - Centrifuge at 16,000 x g for 15 min at 4 °C. Slowly remove ethanol with a pipette while being careful not to disturb the pellet.
CAUTION: The RNA pellet is not always visible and is sometimes loose in presence of ethanol. - Add 500 µL of 80% cold ethanol.
- Centrifuge at 16,000 x g for 5 min at 4 °C.
- Discard ethanol by pipetting it slowly. Dry the pellet using a vacuum concentrator, 5 min on run mode.
- Resuspend the pellet in an appropriate volume (15-50 µL) of ultrapure water. Freeze the pellet at -20 °C for later use.
- Assess RNA quantity (260 nm) and quality (260/280 and 260/230 wavelength ratios) using a spectrophotometer/fluorometer (see Table of Materials). Carefully follow manufacturer’s instructions.
NOTE: 3-4 µg are generally obtained in the elution fraction (E). This mainly depends on tested conditions.
9. Analysis of MS2-affinity purification by Northern blot36
- Dilute 5 µg of RNA of CE, FT, W fractions and 500 ng of E fraction in 10 µL of ultrapure water and mix with 10 µL of RNA loading buffer.
- Incubate 3 min at 90 °C.
- Load samples into wells of an 1% agarose gel supplemented with 20 mM of guanidium thiocyanate and run the gel at 100-150 V in TBE 1x buffer at 4 °C. Read Koontz (2013)37 for more details.
- Transfer RNAs on a nitrocellulose membrane by vacuum transfer for 1h or capillarity transfer overnight.
NOTE: The capillarity method is more efficient for large RNAs. - UV cross-link RNAs on the membrane (120 mJ at 254 nm) using an ultraviolet crosslinker.
- Insert the membrane in a hybridization bottle with the RNA side facing up.
- Add 10-20 mL of preheated hybridization solution. Incubate 30 min at 68 °C.
- Discard the solution and add 10-20 mL of fresh hybridization solution supplemented with 1 µL of the sRNA-specific probe. Incubate overnight at 68 °C.
NOTE: The DIG-labelled RNA probe is synthetized using a DIG RNA labelling kit and following manufacturer’s instructions. Alternatively, a radiolabelled probe can be used. - Wash the membrane with 10-20 mL of wash solution 1 (2x SSC and 0.1% SDS) for 5 min at 20 °C. Repeat once.
- Wash the membrane with 10-20 mL of wash solution 2 (0.2x SSC and 0.1% SDS) for 15 min at 68 °C. Repeat once.
- Incubate with 10-20 mL of blocking solution for at least 30 min at 20 °C.
- Discard the solution and add 10-20 mL of the blocking solution supplemented with the polyclonal anti-digoxigenin antibody (1/1000), conjugated to alkaline phosphatase. Incubate 30 min at 20 °C.
- Wash the membrane with 10-20 mL of the wash solution 3 (1x maleic acid and 0.3% Tween 20) for 15 min at 20 °C. Repeat once.
- Incubate the membrane with 10-20 mL of the detection solution (0.1 M Tris HCl and 0.1 M NaCl pH 9.5) 5 min at 20 °C.
- Put the membrane on a plastic film and soak it with the substrate (see Table of Materials). Incubate 5 min in the dark.
- Seal the membrane in a plastic film. Put the membrane in an autoradiography cassette.
- Expose the membrane to an autoradiography film in the dedicated dark room.
NOTE: The exposition time depends on the signal strength, from few seconds to minutes. - Reveal the exposed film in an automatic developing device.
10. Preparation of the samples for RNA sequencing
NOTE: This step only concerns RNAs extracted from E and CE fractions.
- Add to each sample 10 µL of 10x DNase buffer and DNase I (1 U/µg of treated RNAs). Add water for a final volume of 100 µL.
- Incubate 1 h at 37 °C.
- Extract and purify RNAs as previously described (steps 8.2 to 8.11).
- Resuspend the RNA pellet in 20 µL of ultrapure water.
NOTE: The presence of remaining DNA can be checked using PCR and specific primers (e.g., 16S gene). - Assess RNA quantity and quality using a microfluidics-based electrophoresis analysis system (see Table of Materials).
NOTE: 1 µg is generally obtained in the elution fraction (E) after DNase treatment. - Remove ribosomal RNAs with a bacterial rRNA depletion kit.
NOTE: Large and abundant RNAs (i.e., rRNAs) tend to non-specifically interact with the affinity column. 500 ng of extracted RNA are required to perform this step. - Again assess RNA quantity and quality using a microfluidics-based electrophoresis analysis system.
- Prepare cDNA libraries with 10-20 ng of ribodepleted RNA using a cDNA library preparation kit and following manufacturer’s instructions.
- Sequence the obtained libraries using a sequencing instrument (e.g., single-end, 150 bp; see Table of Materials).
NOTE: 5-10 million reads per sample are generally enough.
11. RNAseq data analysis (Figure 2)
- Download the FastQ sequencing files from the sequencing platform.
- Access to the Galaxy instance of Roscoff biological station (https://galaxy.sb-roscoff.fr/) and log in.
NOTE: Every mentioned algorithm can be easily found using the search bar. A user guide is provided for each tool.
CAUTION: The version of required tools may differ from the public Galaxy server38. - Click on Get Data icon and then Upload File from your computer. Upload FastQ sequencing file of each MS2 control and MS2-sRNA samples. Upload also FASTA reference genome file and GFF annotation file.
- Run FastQC Read Quality reports (Galaxy Version 0.69).
NOTE: This tool provides a quality assessment of raw sequences (e.g., quality score, presence of adapter sequences). - Run Trimmomatic flexible read trimming tool (Galaxy Version 0.36.6) to notably remove adapter sequences and poor-quality reads. Indicate adapter sequences used for library preparation (e.g., TruSeq 3, single-ended). Add the following Trimmomatic operations: SLIDINGWINDOW (Number of bases=4; Average quality=20) and MINLEN (Min length of reads=20).
- Run again FastQC Read Quality reports (Galaxy Version 0.69).
- Run Bowtie2 - map reads against reference genome (Galaxy Version 2.3.2.2). Use the Genome Reference FASTA file from the history to map reads with default settings (very sensitive local).
NOTE: BAM file generated by Bowtie2 tool can be visualized using the Integrative Genomics Viewer (IGV). Associated BAI file will also be required. - Optionally, Run Flagstat which compiles stats for BAM dataset (Galaxy Version 2.0).
- Run htseq-count - Count (Galaxy Version 0.6.1) which aligns reads overlapping features in the GFF annotation file. Use the Intersection (non-empty) mode.
- Archive all raw counts files from htseq-count analysis into a single Zip file.
- Run SARTools DESeq2 to compare data (Galaxy Version 1.6.3.0). Provide the Zip file containing raw counts files and the design file, a tab delimited file describing the experiment. Carefully follow provided instructions to generate the design file.
Results
The representative results originate from the study of RsaC targetome in S. aureus29. RsaC is an unconventional 1,116 nt-long sRNA. Its 5’ end contains several repeated regions while its 3’ end (544 nt) is structurally independent and contains all predicted interaction sites with its mRNA targets. The expression of this sRNA is induced when manganese (Mn) is scarce, which is often encountered in the context of host immune response. Using MAPS technology, we identified several mRNAs interacting directly with RsaC, revealing its crucial role in oxidative stress (sodA, ldh1 and sarA) and metal-related (znuBC-zur and sufCDSUB) responses.
Validation of the MS2-sRNA construct and experimental conditions
Before performing MAPS experiments, it is important to determine the optimum conditions of expression of the studied sRNA. If a non-native promoter is used, it will definitively help produce the MS2-sRNA construct when its targets are present. In addition, the MS2-sRNA construct should be carefully validated with regard to size, stability, expression and function. The MS2 aptamer was fused to the 5’ end of either the full-length RsaC (MS2-RsaC1116) or the shorter form (MS2-RsaC544) corresponding to the 3’ part of RsaC. Both constructs were expressed in vivo under the control of the quorum sensing dependent P3 promoter in S. aureus HG001 ΔrsaC. The deletion of rsaC gene avoids a competition between the endogenous RsaC and MS2-RsaC. The wild-type strain containing the same vector with the MS2 tag alone was used as control. This control allows subtracting unspecific interactions occurring with the MS2 tag.
To confirm the constructs and visualize their pattern of expression, bacterial cells were harvested after 2 h, 4 h and 6 h of growth in BHI medium at 37 °C. After RNA extraction, Northern blot analysis was performed using RsaC-specific DIG probe (Figure 3A). The level of endogenous RsaC (lanes 1-3) significantly increased after 6 h of growth, justifying the selection of this time point for MAPS experiments. Importantly, the levels of MS2-RsaC544 (lanes 7-9) and MS2-RsaC1,116 (lanes 10-12) were comparable to endogenous RsaC at 6 h. Hence, they should mimic the endogenous expression pattern of RsaC. A larger but minor form of RsaC was distinguishable and might be due to an inefficient end of transcription. This phenomenon is frequently observed when a MS2-sRNA is expressed under the control of a strong promoter from a plasmid21. No shorter forms resulting from aberrant transcription termination or degradation were observed.
The addition of the MS2 aptamer at the 5’ of sRNAs could also disrupt their proper folding and affect their functions. This step is critical for highly structured sRNAs as RsaC. Hence MS2-sRNA activity should be tested and compared to endogenous sRNA when possible. A previously known target or an observable phenotype can help to monitor it. For example, the impact of RsaC on intracellular ROS accumulation was used to validate MS2-RsaC544 and MS2-RsaC1,116 constructs29.
Analysis of collected fractions during affinity purification
RNAs were extracted from CE, FT and E fractions in WT strain expressing MS2 tag alone and ΔrsaC strain expressing MS2-RsaC544 construct. We showed using Northern blot analysis that the 1,116 nt-long endogenous RsaC was enriched in the elution fraction but turned out to interact non-specifically with the affinity column (Figure 3B, lanes 2-3). We observed the same phenomenon with MS2-RsaC1,116 (data not shown). This is certainly due to its length and complex secondary structure. Therefore, only a less structured and shorter form (544 nt) of RsaC corresponding to its 3’ part was used to perform MAPS experiments. In Figure 3B, the MS2-RsaC544 was highly enriched in the elution fraction demonstrating that it was successfully retained by the MS2-MBP fusion protein (lane 6). A larger but minor form of MS2-RsaC544 was observed as in Figure 3A. Here, the stringency and number of washes can be adjusted to either reduced non-specific binding or, on the contrary, to limit loss of true interacting partners.
Validation of putative mRNA targets after MAPS analysis
Following bioinformatic analysis, putative mRNA targets are listed according to the Fold-change between MS2-sRNA and MS2 control, obtained using DeSeq2 (Figure 2). For instance, MS2-RsaC544 MAPS data29 suggested that sodA mRNA, coding for a superoxide dismutase in S. aureus, is a main target (best hit, higher Fold-change). A Northern blot analysis, performed with a sodA-specific DIG probe after MS2-affinity purification, shows that sodA was efficiently co-enriched with MS2-RsaC544 compared to the MS2 control (Figure 3C).
A global transcriptomic analysis is systematically performed on the CE fraction. The comparison of MAPS data and this transcriptomic analysis helps adjust the enrichment ratio and reveals a potential target hierarchy. Indeed, a poorly expressed mRNA, which is highly enriched after MS2-affinity purification has certainly a greater binding affinity than a highly enriched and highly expressed mRNA.
It is important to note that all candidates identified by MAPS must be individually validated using in vitro and/or in vivo experiments such as Electrophoresis Mobility Shift Assays (EMSA) or reporter gene assays (see Jagodnik et al. (2017)39 for more details).

Figure 1. Schematic illustration of the MAPS protocol adapted to S. aureus. From plasmid construction to data analysis. Please click here to view a larger version of this figure.

Figure 2. MAPS analysis workflow and processed data. Each step, check point and file format are represented (see also step 11). FastQ format is a text file consisting of the DNA sequences and corresponding quality scores. BAM format is a compressed file containing aligned sequences. Tabular format is a tab-delimited text file with counts for each gene. The results chart illustrates the kind of data obtained after bioinformatic analysis. Presented results are fictitious and do not originate from any study. For further details, basic tutorials are available on Galaxy Project website (https://galaxyproject.org/). Please click here to view a larger version of this figure.
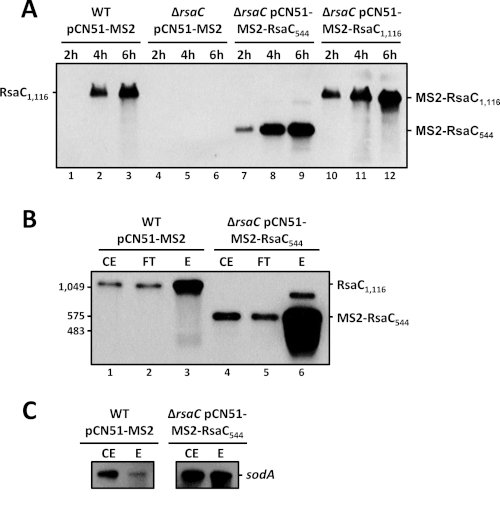
Figure 3: Constructs validation and MAPS controls. A. Northern blot analysis of endogenous RsaC sRNA and related MS2 constructs. WT strain carries the pCN51-P3-MS2 (control) and ΔrsaC mutant strain carry either the pCN51-P3-MS2, pCN51-P3-MS2-RsaC544 or pCN51-P3-MS2-RsaC1,116. Samples were taken after 2 h, 4 h and 6 h of growth in BHI at 37 °C. Northern blot assays were performed using a RsaC-specific DIG probe. B. Northern blot analysis of MS2-affinity purification fractions using a RsaC-specific DIG probe. The co-purification was performed using WT strain + pCN51-P3-MS2 (control) and ΔrsaC mutant strain + pCN51-P3-MS2-RsaC544. Cells were harvested after 6 h of growth in BHI at 37 °C. Crude extract (CE), flow-through (FT), elution (E). C. Northern blot analysis of MS2-affinity purification fractions (CE and E) using a sodA-specific DIG probe. See (B) for details. Please click here to view a larger version of this figure.
| RNA | Type | Reference |
| Escherichia coli | ||
| RyhB | sRNA | Lalaouna et al. (2015)21 |
| RybB | sRNA | Lalaouna et al. (2015)21 |
| 3'ETSleuZ | tRNA-derived fragment | Lalaouna and Massé (2015)26 |
| DsrA | sRNA | Lalaouna et al. (2015)22 |
| hns | mRNA (5'UTR) | Lalaouna et al. (2015)22 |
| CyaR | sRNA | Lalaouna et al. (2018)23 |
| RprA | sRNA | Lalaouna et al. (2018)23 |
| GcvB | sRNA | Lalaouna et al. (2019)24 |
| Salmonella Typhimurium | ||
| SraL | sRNA | Silva et al. (2019)25 |
| Staphylococcus aureus | ||
| RsaA | sRNA | Tomasini et al. (2017)27 |
| RsaC | sRNA | Lalaouna et al. (2019)29 |
| RsaI | sRNA | Bronesky et al. (2019)28 |
Table 1. MAPS technology revealed the targetome of several RNAs in various organisms.
Discussion
A modified protocol for Gram-positive bacteria
The initial protocol of MAPS was developed to study sRNA interactome in the model organism E. coli20,30. Here, we describe a modified protocol which is suitable for the characterization of sRNA-dependent regulatory networks in the opportunistic human pathogen S. aureus and is certainly transposable to other Gram-positive bacteria, pathogenic or not.
Particular attention was paid to the cell lysis step. The French press has been replaced by a mechanical cell lysis instrument. This method is effective to break Gram-positive cells and to limit risks associated to the handling of pathogenic strains. To improve the yield of the MS2-affinity purification, the quantity of MS2-MBP immobilized on the amylose resin has been drastically increased. This has required to adjust the stringency and number of washes.
Unlike the initial protocol, MAPS is here performed in duplicate, from two biological replicates. A workflow has been developed to implement statistical analysis (Figure 2), which definitively increases the robustness of obtained data.
MS2 construct and its expression
This MAPS protocol was established to identify the targetome of staphylococcal sRNAs. The MS2-sRNA construct is expressed from a low-copy number plasmid (pCN51, 20 to 25 copies/cell) and under the control of the quorum-sensing dependent P3 promoter, mainly induced during stationary phase. This expression pattern corresponds to studied sRNAs in S. aureus (i.e. RsaA, RsaI and RsaC) and ensures a rather strong MS2-sRNA synthesis. However, we cannot exclude that in other cases, the P3 promoter may not be appropriate and does not reflect the natural physiological state of bacteria when the sRNA is induced. Another way to control MS2-sRNA production is to use chemically inducible promoters (e.g., tetracycline-inducible promoters). These tools allow a pulse expression of the MS2-sRNA construct, but this setting does not guarantee that RNA targets will be concomitantly expressed. Another drawback is that expression from a plasmid can lead to the overproduction of the studied sRNA, even more emphasized with high copy number vector. This might potentially result in artefactual interactions or the disruption of associated RNA chaperone functions. The most appropriate alternative is to insert a MS2 tag at the 5’ end of the endogenous sRNA gene. Thus, the MS2-sRNA would be chromosomally encoded and under the control of its native promoter. This should better mimic the endogenous expression of studied sRNA and avoid bias due to the overproduction of the studied sRNA. In any case, the crucial step is to carefully verify the length, stability and functionality of the MS2-sRNA construct, notably using Northern blot assays with total RNA extracted from cultures grown under conditions that trigger the endogenous sRNA production and function. Undeniably, the use of an improper/unfunctional MS2-sRNA construct can drastically affect generated results, supporting the significance of controls described above. Finally, the MS2-sRNA is always produced in a ΔsRNA background to maximize the enrichment of mRNA targets. Moreover, experiments can be performed in host strains with specific mutations in RNases (e.g., deletion mutants or temperature-sensitive mutants) to avoid mRNA targets degradation by sRNA-dependent recruitment of RNases.
The experimental validation of candidates identified by MAPS is still required
One point which needs to be considered is that MAPS provides a list of putative RNA targets. However, some RNAs may be indirectly enriched via interaction with a shared mRNA target or an RNA binding protein. Consequently, revealed candidates must be confirmed by other experimental approaches. EMSA and footprinting experiments are commonly used to visualize the direct binding of an sRNA to putative RNA targets in vitro. Then, in vitro toeprinting assays help monitor the impact of an sRNA on translation initiation of its mRNA target. Finally, Northern blot and/or gene reporter assays (lacZ or gfp) complement this experimental validation in vivo. All these approaches are described in Jagodnik et al. (2017)39.
Unlike RIL-seq and CLASH technologies, MAPS does not directly provide information on the interaction sites. Nevertheless, a peak of mapped reads is frequently observed in a restricted region of the RNA target (e.g., the 3’ end of glyW-cysT-leuZ operon21), facilitating the identification of the pairing site. Alternatively, several prediction tools can be used to predict the putative binding site on the identified target such as IntaRNA40.
MAPS scrutinizes the targetome of a particular sRNA
MAPS technology is suitable for the study of sRNA targetome in Gram-negative bacteria such as E. coli and S. Typhimurium, but also now with this modified protocol in Gram-positive bacteria like S. aureus. Basically, MAPS offers a snapshot of RNA:sRNA duplexes formed at a given time and in specific growth conditions. Unfortunately, the list of mRNA targets could be incomplete. For instance, a cognate mRNA target could be missed due to inappropriate experimental conditions, justifying the above-mentioned precautions.
Compared to other commonly used methods such as RIL-seq or CLASH, MAPS uses a specific sRNA to co-purify all interacting RNA targets. Here, sRNA:RNA interaction are not diluted among other RBP-associated duplexes, allowing theoretically to characterize its targetome more deeply. However, it seems that RIL-seq/CLASH and MAPS methods revealed different sets of putative sRNA targets12,41, suggesting that these experimental approaches are complementary. This discrepancy could be explained by variations in growth conditions and/or bias generated by each method.
Accordingly, the purpose of the study should influence the choice of the method. For a global analysis of sRNA targetomes and when an RBP is involved in sRNA-mediated regulation, RIL-seq and CLASH methods should be preferred. Both approaches provide an overview of regulatory networks relying on a particular RBP and, consequently, uncover a wide variety of sRNAs and associated targets. On the contrary, for the study of a specific sRNA or when no RBP is known/involved, MAPS represents an appropriate option.
Disclosures
The authors have nothing to disclose.
Acknowledgements
This work was supported by the “Agence Nationale de la Recherche” (ANR, Grant ANR-16-CE11-0007-01, RIBOSTAPH, and ANR-18-CE12- 0025-04, CoNoCo, to PR). It has also been published under the framework of the labEx NetRNA ANR-10-LABX-0036 and of ANR-17-EURE- 0023 (to PR), as funding from the state managed by ANR as part of the investments for the future program. DL was supported by the European Union's Horizon 2020 research and innovation program under the Marie Skłodowska-Curie Grant Agreement No. 753137-SaRNAReg. Work in E. Massé Lab has been supported by operating grants from the Canadian Institutes of Health Research (CIHR), the Natural Sciences and Engineering Research Council of Canada (NSERC), and the National institutes of Health NIH Team Grant R01 GM092830-06A1.
Materials
| Name | Company | Catalog Number | Comments |
|---|---|---|---|
| 1.5 mL microcentrifuge tube | Sarstedt | 72.690.001 | |
| 15 mL centrifuge tubes | Falcon | 352070 | |
| 2 mL microcentrifuge tube | Starstedt | 72.691 | |
| 2100 Bioanalyzer Instrument | Agilent | G2939BA | RNA quantity and quality |
| 250 mL culture flask | Dominique Dutscher | 2515074 | Bacterial cultures |
| 50 mL centrifuge tubes | Falcon | 352051 | Culture centrifugation |
| Absolute ethanol | VWR Chemicals | 20821.321 | RNA extraction and purification |
| Allegra X-12R Centrifuge | Beckman Coulter | Bacterial pelleting | |
| Ampicilin (amp) | Sigma-Aldrich | A9518-5G | Growth medium |
| Amylose resin | New England BioLabs | E8021S | MS2-affinity purification |
| Anti-dioxigenin AP Fab fragment | Sigma Aldrich | 11093274910 | Northern blot assays |
| Autoradiography cassette | ThermoFisher Scientific | 50-212-726 | Northern blot assays |
| BamHI | ThermoFisher Scientific | ER0051 | Plasmid construction |
| BHI (Brain Heart Infusion) Broth | Sigma-Aldrich | 53286 | Growth medium |
| Blocking reagent | Sigma Aldrich | 11096176001 | Northern blot assays |
| CDP-Star | Sigma Aldrich | 11759051001 | Northern blot assays (substrate) |
| Centrifuge 5415 R | Eppendorf | RNA extraction and purification | |
| Chloroform | Dominique Dutscher | 508320-CER | RNA extraction and purification |
| DIG-RNA labelling mix | Sigma-Aldrich | 11277073910 | Northern blot assays |
| DNase I | Roche | 4716728001 | DNase treatment |
| Erythromycin (ery) | Sigma-Aldrich | Fluka 45673 | Growth medium |
| FastPrep device | MP Biomedicals | 116004500 | Mechanical lysis |
| Guanidium Thiocyanate | Sigma-Aldrich | G9277-250G | Northern blot assays |
| Hybridization Hoven Hybrigene | Techne | FHB4DD | Northern blot assays |
| Hybridization tubes | Techne | FHB16 | Northern blot assays |
| Isoamyl alcohol | Fisher Scientific | A/6960/08 | RNA extraction and purification |
| LB (Lysogeny Broth) | Sigma-Aldrich | L3022 | Growth medium |
| Lysing Matrix B Bulk | MP Biomedicals | 6540-428 | Mechanical lysis |
| MicroPulser Electroporator | BioRad | 1652100 | Plasmid construction |
| Milli-Q water device | Millipore | Z00QSV0WW | Ultrapure water |
| NanoDrop spectrophotometer | ThermoFisher Scientific | RNA/DNA quantity and quality | |
| Nitrocellulose membrane | Dominique Dutsher | 10600002 | Northern blot assays |
| Phembact Neutre | PHEM Technologies | BAC03-5-11205 | Cleaning and decontamination |
| Phenol | Carl Roth | 38.2 | RNA extraction and purification |
| Phusion High-Fidelity DNA Polymerase | New England Biolabs | M0530 | Plasmid construction |
| pMBP-MS2 | Addgene | 65104 | MS2-MBP production |
| Poly-Prep chromatography column | BioRad | 7311550 | MS2-affinity purification |
| PstI | ThermoFisher Scientific | ER0615 | Plasmid construction |
| Qubit 3 Fluorometer | Invitrogen | 15387293 | RNA quantity |
| RNAPro Solution | MP Biomedicals | 6055050 | Mechanical lysis |
| ScriptSeq Complete Kit | Illumina | BB1224 | Preparation of cDNA librairies |
| Spectrophotometer Genesys 20 | ThermoFisher Scientific | 11972278 | Bacterial cultures |
| SpeedVac Savant vacuum device | ThermoFisher Scientific | DNA120 | RNA extraction and purification |
| Stratalinker UV Crosslinker 1800 | Stratagene | 400672 | Northern blot assays |
| T4 DNA ligase | ThermoFisher Scientific | EL0014 | Plasmid construction |
| TBE (Tris-Borate-EDTA) | Euromedex | ET020-C | Northern blot assays |
| ThermalCycler T100 | BioRad | 1861096 | Plasmid construction |
| Tween 20 | Sigma Aldrich | P9416-100ML | Northern blot assays |
| X-ray film processor | hu.q | HQ-350XT | Northern blot assays |
| X-ray films Super RX-N | FujiFilm | 4741019318 | Northern blot assays |
References
- Carrier, M. C., Lalaouna, D., Masse, E. Broadening the Definition of Bacterial Small RNAs: Characteristics and Mechanisms of Action. Annual Review of Microbiology. 72, 141-161 (2018).
- Hör, J., Matera, G., Vogel, J., Gottesman, S., Storz, G. Trans-Acting Small RNAs and Their Effects on Gene Expression in Escherichia coli and Salmonella enterica. EcoSal Plus. 9 (1), (2020).
- Desgranges, E., Marzi, S., Moreau, K., Romby, P., Caldelari, I. Noncoding RNA. Microbiology Spectrum. 7 (2), (2019).
- Adams, P. P., Storz, G. Prevalence of small base-pairing RNAs derived from diverse genomic loci. Biochimica et Biophysica Acta - Gene Regulatory Mechanisms. 1863 (7), 194524(2020).
- Pain, A., et al. An assessment of bacterial small RNA target prediction programs. RNA Biology. 12 (5), 509-513 (2015).
- Desgranges, E., Caldelari, I., Marzi, S., Lalaouna, D. Navigation through the twists and turns of RNA sequencing technologies: Application to bacterial regulatory RNAs. Biochimica et Biophysica Acta - Gene Regulatory Mechanisms. , 194506(2020).
- Wright, P. R., et al. CopraRNA and IntaRNA: predicting small RNA targets, networks and interaction domains. Nucleic Acids Research. 42, Web Server issue 119-123 (2014).
- Smirnov, A., Schneider, C., Hor, J., Vogel, J. Discovery of new RNA classes and global RNA-binding proteins. Current Opinion in Microbiology. 39, 152-160 (2017).
- Saliba, A. E., Santos, S., Vogel, J. New RNA-seq approaches for the study of bacterial pathogens. Current Opinion in Microbiology. 35, 78-87 (2017).
- Melamed, S., Adams, P. P., Zhang, A., Zhang, H., Storz, G. RNA-RNA Interactomes of ProQ and Hfq Reveal Overlapping and Competing Roles. Molecular Cell. 77 (2), 411-425 (2020).
- Melamed, S., et al. Global Mapping of Small RNA-Target Interactions in Bacteria. Molecular Cell. 63 (5), 884-897 (2016).
- Iosub, I. A., et al. Hfq CLASH uncovers sRNA-target interaction networks linked to nutrient availability adaptation. Elife. 9, (2020).
- Waters, S. A., et al. Small RNA interactome of pathogenic E. revealed through crosslinking of RNase E. The EMBO Journal. 36 (3), 374-387 (2017).
- Dos Santos, R. F., Arraiano, C. M., Andrade, J. M. New molecular interactions broaden the functions of the RNA chaperone Hfq. Current Genetics. , (2019).
- Kavita, K., de Mets, F., Gottesman, S. New aspects of RNA-based regulation by Hfq and its partner sRNAs. Current Opinion in Microbiology. 42, 53-61 (2018).
- Bohn, C., Rigoulay, C., Bouloc, P. No detectable effect of RNA-binding protein Hfq absence in Staphylococcus aureus. BMC Microbiology. 7, 10(2007).
- Jousselin, A., Metzinger, L., Felden, B. On the facultative requirement of the bacterial RNA chaperone, Hfq. Trends in Microbiology. 17 (9), 399-405 (2009).
- Olejniczak, M., Storz, G. ProQ/FinO-domain proteins: another ubiquitous family of RNA matchmakers. Molecular Microbiology. 104 (6), 905-915 (2017).
- Lalaouna, D., Desgranges, E., Caldelari, I., Marzi, S. Chapter Sixteen - MS2-Affinity Purification Coupled With RNA Sequencing Approach in the Human Pathogen Staphylococcus aureus. Methods in Enzymology. 612, 393-411 (2018).
- Lalaouna, D., Prevost, K., Eyraud, A., Masse, E. Identification of unknown RNA partners using MAPS. Methods. 117, 28-34 (2017).
- Lalaouna, D., et al. A 3' external transcribed spacer in a tRNA transcript acts as a sponge for small RNAs to prevent transcriptional noise. Molecular Cell. 58 (3), 393-405 (2015).
- Lalaouna, D., Morissette, A., Carrier, M. C., Masse, E. DsrA regulatory RNA represses both hns and rbsD mRNAs through distinct mechanisms in Escherichia coli. Molecular Microbiology. 98 (2), 357-369 (2015).
- Lalaouna, D., Prevost, K., Laliberte, G., Houe, V., Masse, E. Contrasting silencing mechanisms of the same target mRNA by two regulatory RNAs in Escherichia coli. Nucleic Acids Research. 46 (5), 2600-2612 (2018).
- Lalaouna, D., Eyraud, A., Devinck, A., Prevost, K., Masse, E. GcvB small RNA uses two distinct seed regions to regulate an extensive targetome. Molecular Microbiology. 111 (2), 473-486 (2019).
- Silva, I. J., et al. SraL sRNA interaction regulates the terminator by preventing premature transcription termination of rho mRNA. Proceedings of the National Academy of Sciences. 116 (8), 3042-3051 (2019).
- Lalaouna, D., Masse, E. Identification of sRNA interacting with a transcript of interest using MS2-affinity purification coupled with RNA sequencing (MAPS) technology. Genomics Data. 5, 136-138 (2015).
- Tomasini, A., et al. The RNA targetome of Staphylococcus aureus non-coding RNA RsaA: impact on cell surface properties and defense mechanisms. Nucleic Acids Research. 45 (11), 6746-6760 (2017).
- Bronesky, D., et al. A multifaceted small RNA modulates gene expression upon glucose limitation in Staphylococcus aureus. The EMBO Journal. 38 (6), (2019).
- Lalaouna, D., et al. RsaC sRNA modulates the oxidative stress response of Staphylococcus aureus during manganese starvation. Nucleic Acids Research. 47 (1), 9871-9887 (2019).
- Carrier, M. C., Laliberte, G., Masse, E. Identification of New Bacterial Small RNA Targets Using MS2 Affinity Purification Coupled to RNA Sequencing. Methods in Molecular Biology. 1737, 77-88 (2018).
- Garibyan, L., Avashia, N. Polymerase chain reaction. Journal of Investigative Dermatology. 133 (3), 1-4 (2013).
- Revie, D., Smith, D. W., Yee, T. W. Kinetic analysis for optimization of DNA ligation reactions. Nucleic Acids Research. 16 (21), 10301-10321 (1988).
- Seidman, C. E., Struhl, K., Sheen, J., Jessen, T. Introduction of plasmid DNA into cells. Current Protocols in Molecular Biology. , Chapter 1 Unit 1.8 (2001).
- Sanger, F., Coulson, A. R., Barrell, B. G., Smith, A. J. H., Roe, B. A. Cloning in single-stranded bacteriophage as an aid to rapid DNA sequencing. Journal of Molecular Biology. 143 (2), 161-178 (1980).
- Grosser, M. R., Richardson, A. R. Method for Preparation and Electroporation of S. aureus and S. epidermidis. Methods in Molecular Biology. 1373, 51-57 (2016).
- Krumlauf, R. Northern blot analysis. Methods in Molecular Biology. 58, 113-128 (1996).
- Koontz, L. Agarose gel electrophoresis. Methods in Enzymology. 529, 35-45 (2013).
- Afgan, E., et al. The Galaxy platform for accessible, reproducible and collaborative biomedical analyses: 2016 update. Nucleic Acids Reseaerch. 44, 3-10 (2016).
- Jagodnik, J., Brosse, A., Le Lam, T. N., Chiaruttini, C., Guillier, M. Mechanistic study of base-pairing small regulatory RNAs in bacteria. Methods. 117, 67-76 (2017).
- Mann, M., Wright, P. R., Backofen, R. IntaRNA 2.0: enhanced and customizable prediction of RNA-RNA interactions. Nucleic Acids Res. 45, 435-439 (2017).
- Georg, J., et al. The power of cooperation: Experimental and computational approaches in the functional characterization of bacterial sRNAs. Molecular Microbiology. 113 (3), 603-612 (2020).
Reprints and Permissions
