Traditional photothrombotic stroke (PTS) models mainly induce dense platelet aggregates of a high resistance to tissue plasminogen activator (tPA)-lytic treatment. Here a modified murine PTS model is introduced by co-injecting thrombin and photosensitive dye for photoactivation. The thrombin-enhanced PTS model produces mixed platelet:fibrin clots and is highly sensitive to tPA-thrombolysis.
Method Article
A Fibrin-Enriched and tPA-Sensitive Photothrombotic Stroke Model
In This Article
Summary
Abstract
An ideal thromboembolic stroke model requires certain properties, including relatively simple surgical procedures with low mortality, a consistent infarction size and location, precipitation of platelet:fibrin intermixed blood clots similar to those in patients, and an adequate sensitivity to fibrinolytic treatment. The rose bengal (RB) dye-based photothrombotic stroke model meets the first two requirements but is highly refractory to tPA-mediated lytic treatment, presumably due to its platelet-rich, but fibrin-poor clot composition. We reason that combination of RB dye (50 mg/kg) and a sub-thrombotic dose of thrombin (80 U/kg) for photoactivation aimed at the proximal branch of middle cerebral artery (MCA) may produce fibrin-enriched and tPA-sensitive clots. Indeed, the thrombin and RB (T+RB)-combined photothrombosis model triggered mixed platelet:fibrin blood clots, as shown by immunostaining and immunoblots, and maintained consistent infarct sizes and locations plus low mortality. Moreover, intravenous injection of tPA (Alteplase, 10 mg/kg) within 2 h post-photoactivation significantly decreased the infarct size in T+RB photothrombosis. Thus, the thrombin-enhanced photothrombotic stroke model may be a useful experimental model to test novel thrombolytic therapies.
Introduction
Endovascular thrombectomy and tPA-mediated thrombolysis are the only two U.S. Food and Drug Administration (FDA)-approved therapies of acute ischemic stroke, which afflicts ~700,000 patients annually in the United States1. Because the application of thrombectomy is limited to large vessel occlusion (LVO), while tPA-thrombolysis may alleviate small vessel occlusions, both are valuable therapies of acute ischemic stroke2. Moreover, the combination of both therapies (e.g., initiation of tPA-thrombolysis within 4.5 hours of stroke onset, followed by thrombectomy) improves reperfusion and the functional outcomes3. Thus, optimizing thrombolysis remains an important goal for stroke research, even in the era of thrombectomy.
Thromboembolic models are an essential tool for preclinical stroke research aiming to improve thrombolytic therapies. This is because mechanical vascular occlusion models (e.g., intraluminal suture MCA occlusion) do not produce blood clots, and its fast recovery of cerebral blood flow after the removal of mechanical occlusion is overly idealized4,5. To date, major thromboembolic models include photothrombosis6,7,8, topical ferric chloride (FeCl3) application9, microinjection of thrombin into the MCA branch10,11, injection of ex vivo (micro)emboli into the MCA or common carotid artery (CCA)12,13,14, and transient hypoxia-ischemia (tHI)15,16,17,18. These stroke models differ in the histological composition of ensuing clots and the sensitivity to tPA-mediated lytic therapies (Table 1). They also vary in the surgical requirement of craniotomy (needed for in situ thrombin injection and topical application of FeCl3), the consistency of infarct size and location (e.g., CCA-infusion of microemboli yield very variable outcomes), and global effects on the cardiovascular system (e.g., tHI increases the heart rate and cardiac output to compensate for hypoxia-induced peripheral vasodilation).
The RB dye-based photothrombotic stroke (PTS) model has many attractive features, including simple craniotomy-free surgical procedures, low mortality (typically < 5%), and a predictable size and location of infarct (in the MCA-supplying territory), but it has two major limitations.8 The first caveat is weak-to-nil response to tPA-mediated thrombolytic treatment, which is also a drawback of the FeCl3 model7,19,20. The second caveat of PTS and FeCl3 stroke models is that the ensuing thrombi consist of densely-packed platelet aggregates with a small amount of fibrin, which not only lead to its resilience to tPA-lytic therapy, but also deviates from the pattern of intermixed platelet:fibrin thrombi in acute ischemic stroke patients21,22. In contrast, the in situ thrombin-microinjection model mainly comprises polymerized fibrin and a uncertain content of platelets10.
Given the above reasoning, we hypothesized that admixture of RB and a sub-thrombotic dose of thrombin for MCA-targeted photoactivation through thinned skull may increase the fibrin component in the resultant thrombi and boost the sensitivity to tPA-mediated lytic treatment. We have confirmed this hypothesis,23 and herein we describe detail procedures of the modified (T+RB) photothrombotic stroke model.
Protocol
This protocol is approved by the Institutional Animal Care and Use Committee (IACUC) at the University of Virginia and follows the National Institutes of Health Guideline for Care and Use of Laboratory Animals. Figure 1A outlines the sequence of surgical procedures of this protocol.
1. Surgery setup
- Place a warming pad with temperature setting at 37 °C on the small animal adaptor at least 15 minutes before the surgery. Prepare a nose-clip roll for adaptor which allows the animal head rotation. Prepare the anesthetics Ketamine (60 mg/kg)/ Xylazine (10 mg/kg).
- Sterilize the surgical tools including scissors, forceps, micro-needle holders, hemostats, cotton swabs and sutures with autoclave (121 °C at 15 psi for 60 min). Prepare tissue glue and eye ointment. Prepare the 532 nm laser protection goggle for surgeons.
NOTE: This protocol describes a major survival surgery procedure and should be conducted using aseptic techniques. - Set up the illumination system with a 532 nm laser source. Prepare a dental drill.
- Prepare the Rose Bengal solution in saline (10 mg/mL). Place an aliquot bovine thrombin (0.1 U/µL) on ice-bucket.
- Inject Ketoprofen (4.0 mg/kg) subcutaneously to the mouse as analgesia at 30 min before surgery or use the analgesic regimen recommended by the local institutional guidelines.
2. Ligation of the ipsilateral common carotid artery
- Anesthetize 10-14 week-old male C57BL/6NCrl mice weighing 22 to 30 g by intramuscular injection of Ketamine (60 mg/kg) and Xylazine (10 mg/kg).
NOTE: The entire surgical procedure, encompassing the ligation of the ipsilateral common carotid artery through the monitoring of cerebral blood flow, is expected to take ~120 min. The anesthetic regimen will be typically effective for this entire duration, but the anesthetic depth should be reassessed at least every 15 min. While learning these procedures, it may be necessary to re-dose the anesthesia. - Perform a toe-pinch to ensure the animal is fully anesthetized. Remove the hair on the left neck for CCA ligation and the head for skull thinning with the hair removal cream.
- Place the mouse on the small animal adaptor in the supine position. Sterilize the surgical area by wiping skin with three alternating swipes of povidone-iodine and 70% ethanol.
- Secure the mouse head using ear bars. Under a dissecting microscope, make a 0.5 cm left-cervical incision using a pair of micro-scissors and straight forceps at about 0.2 cm lateral to the midline.
- Use a pair of fine serrated forceps to pull apart the soft tissue and fascia to expose the left common carotid artery (LCCA). Carefully separate the left CCA from the vagal nerve using a pair of fine smooth forceps.
- Place a permanent double-knot suture around the LCCA using 5-0 silk suture cut into 20 mm segments, and then close the wound using sterile wound clips.
3. Skull thinning above the MCA branch and photoactivation
- Flip the mouse to prone position on the small animal adaptor. Rotate the nose-clip roll for 15°. Sterilize the surgical area by wiping skin with three alternating swipes of betadine and 70% ethanol.
- Make a 0.8 cm incision in the scalp using a pair of micro-scissors and straight forceps along the left eye and ear to expose the temporalis muscle, which is located between the eye and the ear (Figure 1B).
- Under the dissecting microscope, make a 0.5 cm incision along the edge of temporalis muscle on left parietal bone by a pair of fine serrated forceps. Make a second 0.3 cm vertical incision on temporalis muscle by a micro scissors. Retract the temporal muscle to expose the edge of parietal bone and squamosal bone. Make sure to visualize the landmark of coronal suture between the frontal and the parietal bones (Figure 1B,C).
- Moisture the skull by applying sterile saline to reveal the left MCA. Mark the proximal MCA branch on the squamosal bone with a marker pen. Gently draw a circle for about 1 mm in diameter surrounding the marked area with the pneumatic dental drill (burr speed setting at 50% of speed controller), and then thin the skull about 0.2 mm in depth without touching the underneath dura. Stop the drilling until a very thin layer of bone is left.
- Mix the thrombin (T, 0.1 U/μL, 80 U/kg) and Rose bengal (RB, 10 mg/mL, 50 mg/kg) solution based on the mouse’s body weight. For example, for a mouse of 25 g body weight, mix 20 μL of thrombin (0.1 U/μL) and 125 μL of RB (10 mg/mL).
- Slowly inject T+RB solution (145 µL per 25 g body weight) into the retro-orbital sinus with an insulin syringe (#31G needle).
NOTE: In pilot experiments, the mortality rate of increasing doses of thrombin mixed with the standard dose of RB dye (50 mg/kg) was examined for photoactivation. The mortality was 0% for 80 U/kg thrombin (n=13), 43% for 120 U/kg thrombin (n=7), and 100% for both 160 U/kg (n=5) and 200 U/kg thrombin (n=5). A dose of 80 U/kg thrombin was therefore chosen for this model. Laser speckle contract imaging was also used to exclude the possibility of rampant blood clotting near the orbital cavity after retro-orbital sinus injection of T+RB (Supplementary Figure 1), as well as, widespread fibrin deposition in the contralateral hemisphere that was not subjected to laser illumination (Supplementary Figure 2). - Apply eye ointment on both eyes to prevent dryness.
- Apply the illuminator with a 532 nm laser light (with 0.5 mW energy) on the drilled site with 2-inch distance for 20 min. Visualize the illumination on the proximal branch of MCA through a laser protection goggle (Figure 1C,D).
NOTE: The MCA with 532 nm illumination shows red fluorescence under the goggle. The distal MCA will disappear after 10 min illumination. Exclude the animal if the distal MCA flow is still present after 20 min illumination. - Stop the laser illumination after 20 min. Close the wound with sterile wound clips.
4. Intravital imaging (optional)
NOTE: To characterize the thrombus formation in-vivo, use intraviral imaging by a spin-disk confocal with photoactivation system23.
- Make a cranial window ~3 mm in diameter on the parietal bone of skull.
- Place a coverglass on the cranial window and locate the distal MCA (~50 μm in diameter) under a 20x water-immersion objective.
- Label the circulating platelet by tail vein injection of DyLight488-conjugated anti-GPIbβ antibody (0.1 mg/kg) at 5 min before imaging.
- Inject the mixture solution of thrombin (80 U/kg) and Rose bengal (50 mg/kg) by retro-orbital at 5 min before imaging.
- Photoactivate the MCA using a 561 nm laser system with laser beam 10 μm in diameter and record the image until the thrombus formation.
5. tPA administration
- Place the anesthetized animal on a 37 °C warm pad. At the selected post-photoactivation time-point, wet a gauze with ~45 °C warm water and wrap it on the tail for 1 min.
- Inject recombinant human tPA (10 mg/kg) through the tail vein with a 50% bolus and 50% over 30 min by infusion pump.
NOTE: Although the clinical dose of recombinant human tPA for acute ischemic stroke treatment is 0.9 mg/kg, a higher dose (10 mg/kg) is commonly used in rodents to compensate for reduced cross-species tPA reactivity. We also followed the standard protocol of tPA-administration in preclinical stroke models, using 50% as a bolus and 50% infused through the tail vein over 30 min.24
6. Monitor of cerebral blood flow (CBF)
NOTE: To confirm CBF recovery after tPA treatment, use a two-dimensional laser speckle contrast imaging system15 and record immediately after photothrombosis (step 3.9) or at 24 h after tPA treatment.
- Place anesthetized animal in the prone position and make a midline incision on the scalp with the skull exposed.
- Moisturize the skull with sterile saline and gently apply the ultrasound gel on the skull. Avoid any hair and bubble in the gel, which will interfere the CBF signal.
- Monitor CBF in both cerebral hemispheres under laser speckle contrast imager for 10 min.
- After recording the CBF image, close the scalp with tissue glue and return the animal to the cage.
- Analyze CBF in the selected regions and calculate the CBF recovery percentage compared to contralateral region.
- Then, place the animal back to a warm cage for recovery. Monitor the mice for 5-10 min until they recover from anesthesia. Place wetted food in the cage and return it to the animal care facility.
NOTE: Provide post-op analgesia as recommended by the local institutional guidelines.
7. Infarct volume measurement by triphenyl tetrazolium chloride (TTC) staining
- Twenty-four hours after photothrombosis, deeply anesthetize the animal per the local institutional guidelines for nonsurvival surgery.
NOTE: We administer tribromoethanol (avertin) 250 mg/kg via intraperitoneal (IP) injection. - Perform transcardial perfusion with PBS, collect fresh brain and embed in 3% agar gel.
- Section the brain slice with 1 mm thickness by vibratome and incubate in 2% TTC solution for 10 min.
- Quantify the total infarct volume from 6 brain slices as the absolute volume by ImageJ software.
NOTE: Brain edema was not used as an outcome measurement for two reasons. First, the TTC stain measures tissue viability (via the mitochondrial reduction activity) which is a more severe consequence than edema. Second, as infarction proceeds, both vasogenic and cytotoxic edema occur and cannot be easily distinguished by the standard brain edema measurement methods. However, we have used anti-immunoglobin (IgG) labeling to assess the integrity of blood-brain-barrier (BBB), and found comparable IgG-extravasation at 6 h after photoactivation in both RB and T+RB stroke models (Supplementary Figure 3).
8. Thrombus formation measurement
NOTE: To measure the thrombus formation, collect the brain at 1 h and 2 h after photothrombosis for thrombus measurement in MCA by immunochemistry (IHC) and for fibrin measurement in brain hemisphere by immunoblot, respectively.
- Perform the IHC for the characterization of clot composition. Fix the brain with 4% paraformaldehyde overnight and then dehydrate the brain with 30% sucrose for the OCT embedding.
- Section the brain with sagittal orientation in 20 μm thickness, and perform the IHC with specific antibodies against fibrinogen, platelet (glycoprotein IIb), red blood cell (TER119) and blood vessel (isolectin GS-IB4).
- Perform the measurement of fibrin in brain hemisphere by immunoblot with an antibody against fibrinogen.
Results
First, we compared the fibrin content in RB versus T+RB photothrombosis-induced blood clots. Mice were sacrificed by transcardial perfusion of fixatives at 2 h after photoactivation, and brains were removed for immunofluorescence staining of the MCA branch in longitudinal and transverse planes. In RB photothrombosis, the MCA branch was densely packed with CD41+ platelets and little fibrin (Figure 2A,C). In contrast, the MCA branch in T+RB photothrombosis was occluded by randomly mixed platelet:fibrin clots (Figure 2B,D, n>3 for each). We also used immunoblots to compare the fibrin(ogen) level in the cerebral cortex between the two models, after transcardial perfusion with saline at 2 h post-photoactivation. This analysis showed > two-fold increase of fibrin deposition in the ipsilateral hemisphere in T+RB than RB photothrombosis (Figure 2E, p=0.027 by unpaired t-test; n=3 for each group). In our original report, we also used confocal microscope-based single vessel photoactivation and intravital imaging to compare the behaviors of FITC-conjugated anti-GP1bβ-labeled platelets.23 Those experiments showed that intravenous injection of 80 U/kg thrombin failed to induce platelet aggregates even under laser illumination (Figure 3A), and that platelets form homogenous clots in the RB photothrombosis model (Figure 3B), but uneven aggregates with multiple faint regions in T+RB photothrombosis (Figure 3C). These results suggest that T+RB photothrombosis increases the fibrin content in the ensuing thrombi.
Next, we compared the effects of acute intravenous tPA treatment (10 mg/kg Alteplase, 30 min after photoactivation) on cerebral blood flow (CBF) recovery between the two models. The CBF of the same mouse at pre- and 24 h post- tPA-versus-vehicle treatment was measured by laser speckle contrast imaging and normalized to the contralateral hemisphere (Figure 4A,B). In RB photothrombosis, the tPA treatment led to a trend of CBF-recovery, particularly in the ischemic border area, when compared to vehicle-treated mice (Figure 4C, vehicle 51 ± 9% vs tPA 65 ± 7%, p=0.3 by unpaired t-test, n=4 for each). In T+RB photothrombosis, the recovery of CBF in tPA-treated mice was more prominent, and the proximal MCA branches often became visible at 24 h (Figure 4D, vehicle 55 ± 3% vs tPA 81 ± 7%, p=0.02 by unpaired t-test, n=6 for each group). These results suggest greater sensitivity to tPA-lytic therapy by T+RB than RB photothrombosis.
Finally, we used TTC stain to quantify the effects of tPA treatment on infarct size in the RB and T+RB photothrombotic stroke models. In RB photothrombosis, a similar infarct size was detected in vehicle-treated (18 ± 2.80 mm3, n=6) and tPA-treated mice (18 ± 1.95 mm3, n=10; 10 mg/kg tPA was injected at 30 min post-photoactivation) (Figure 5A). In contrast, the tPA-lytic treatment significantly reduced infarction when tPA was injected at 0.5 h (7 ± 2.1 mm3, n=9), 1 h (4.6 ± 1 mm3, n=10), or 2 h (6.4 ± 1.5 mm3, n=8 ), but not at 6 h post-photoactivation (15.2 ± 3.1 mm3, n=7), compared to vehicle-treated mice (14.8 ± 2 mm3, n=19) (Figure 5B, the p-value determined by unpaired t-test). These results indicate that the T+RB photothrombotic stroke model has sensitivity to tPA-lytic treatment in the.
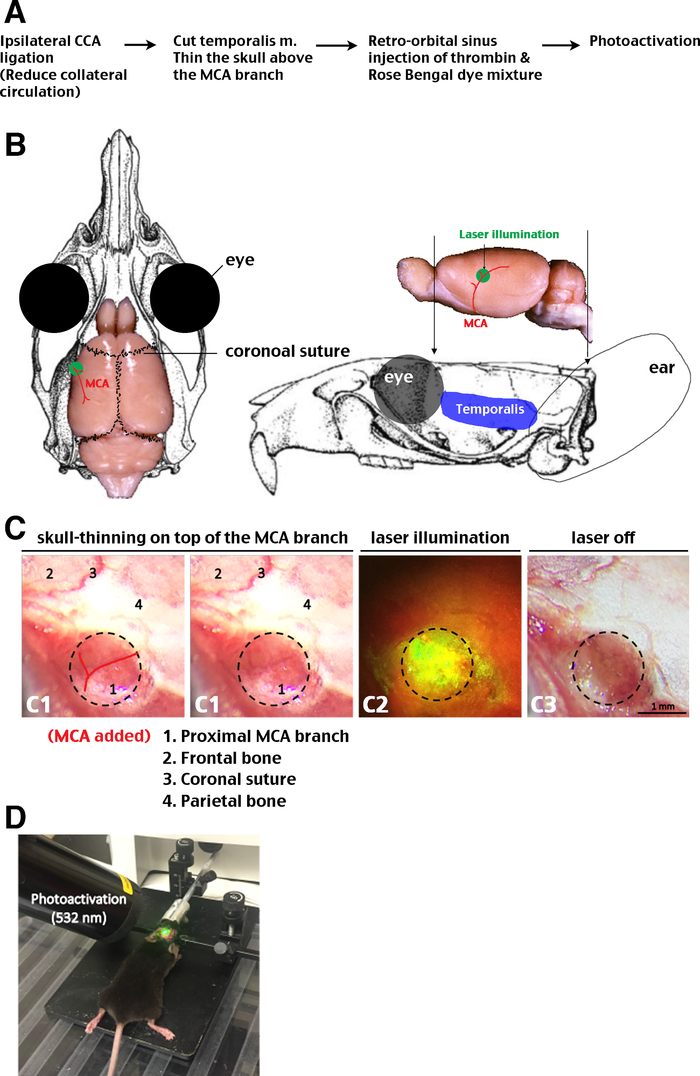
Figure 1: Outline of procedures. (A) The flow chart of main surgical procedures in T+RB photothrombotic stroke model. Ligation of the ipsilateral common carotid artery (CCA) is optional, but we found it makes the infarct size more consistent, presumably owing to decreased collateral circulation. (B) Top and lateral view of the mouse brain in relationship to skull. Also indicated are the eyes, ear, temporalis muscle, the middle cerebral artery (MCA) and branches, coronal suture, and the laser illumination site. (C) Visualization of the targeted MCA branch underneath the thinned skull (C1) and during laser illumination (C2), and cessation of blood flow after photoactivation (C3). Note the relationship of the MCA branch to the coronal suture. (D) The set-up of a mouse during laser illumination on the left MCA branch. Please click here to view a larger version of this figure.
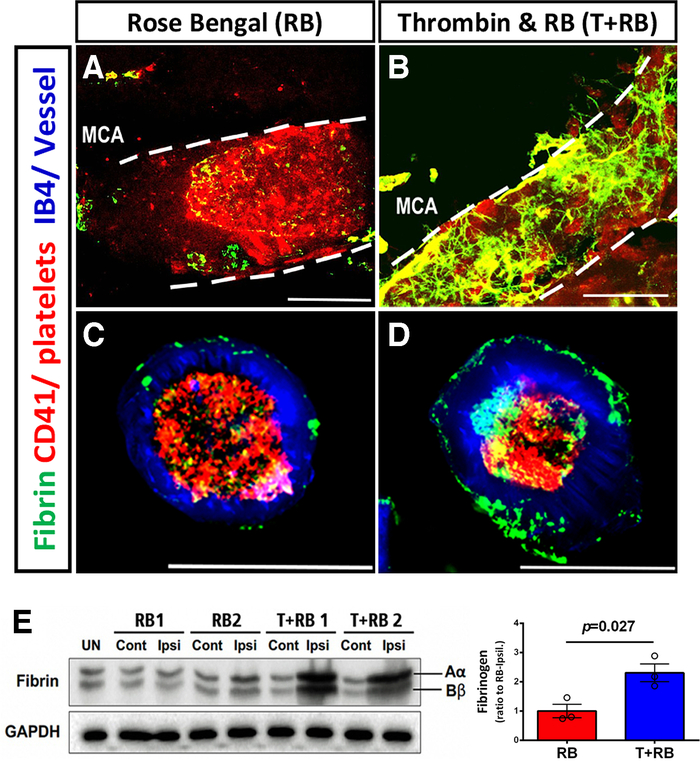
Figure 2: Different fibrin contents in the blood clots. (A-D) Immunofluorescence labeling of the RB and T+RB photothrombosis-induced thrombi in the distal MCA branch in an either longitudinal (A, B) or transverse plane (C, D) using anti-fibrin (green), anti-CD41/platelet (red), and isolectin B4/endothelial cell (blue) markers. Note the marked increase of anti-fibrin immunosignals in the T+RB photothrombosis-induced blood clots (B, D, n=3 for each group). (E) Immunoblotting indicated greater fibrin deposition in ipsilateral cerebral cortex in T+RB than RB photothrombosis at 2 h post-photoactivation (n=3 for each). UN: uninjured mice; Cont: contralateral cortex; Ipsi: ipsilateral cortex. Scale bar: 50 μm. This figure is modified with permission from [23]. Please click here to view a larger version of this figure.
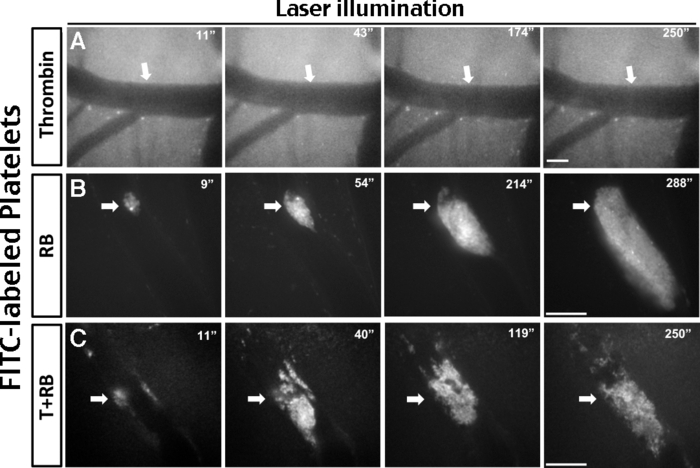
Figure 3: Intravital imaging of the platelet responses. Confocal microscope-based intravital imaging of FITC-conjugated anti-GP1bβ-labeled platelets under single-vessel laser illumination (at the site indicated by white arrows). The experimental groups are: (A) thrombin alone, (B) Rose Bengal alone, and (C) thrombin plus Rose Bengal. The times after laser illumination are labeled. See the video in the JoVE website for this manuscript. Scale bar: 50 μm. This figure is modified with permission from [23]. Please click here to view a larger version of this figure.

Figure 4: Effects of tPA-treatment on CBF recovery. Recombinant human tPA (Alteplase, 10 mg/kg) or vehicle was administered via tail vein to RB and T+RB photothrombosis-challenged mouse at 30 min post-laser illumination, and cerebral blood flow (CBF) at pre- and 24 h post-treatment in the same mouse were compared with laser speckle contrast imaging. The CBF in a 3 x 4.8 mm area on both hemispheres was measured. The experimental groups are: (A, C) RB photothrombosis; (B, D) T+RB photothrombosis. Note the significant recovery of CBF by tPA treatment in the T+RB photothrombosis group (p=0.02 by unpaired t-test, n= 4 for vehicle and n=6 for tPA-treatment) and frequent visualization of the proximal MCA branch. In RB photothrombosis, the tPA treatment led to a trend of better CBF, predominantly at the peripheral ischemic area (p=0.3 by unpaired t-test, n= 4 for vehicle and n=5 for tPA-treatment). White arrows indicate the site of MCA-photoactivation. This figure is modified with permission from [23]. Please click here to view a larger version of this figure.

Figure 5: Effects of tPA-treatment on the infarct size. (A) Intravenous tPA treatment (Alteplase, 10 mg/kg) at 30 min after RB photothrombosis failed to reduce the infarct size (n=6 in vehicle-treated and n=10 in tPA-treated mice). (B) In contrast, in T+RB photothrombosis, intravenous 10 mg/kg Alteplase treatment at either 0.5, 1, or 2 h, but not at 6 h post-photoactivation led to significant reduction of the infarct size. The p-value was determined by one-way ANOVA with Tukey’s multiple comparisons test. This figure is modified with permission from [23]. Please click here to view a larger version of this figure.
| Model | Surgical Procedure | Blood clots | Platelets | Fibrin | tPA-reactivity | Main features/utility | Key references |
| Intraluminal suture MCAO | Endovascular MCA occlusion | No | N/A | N/A | No | Rapid reperfusion; Neuroprection study; tPA-induced BBB injury | Longa et al. 1989 (Ref #5) |
| Photothrombosis | Skull thinning and photoactivation | Yes | Weak | High reproducibility; low mortality | Watson et al. 1985 (Ref #6) | ||
| Thrombin-Photothrombosis | UCCAO, Skull thinning and photoactivation | Yes | Yes | High reproducibility; low mortality | Sun et al. 2020 (Ref #23) | ||
| FeCl3 (on the MCA) | Skull thinning and chemical activation | Yes | No | High reproducibility; low mortality | Karatas et al. 2011 (Ref #69) | ||
| in situ thrombin injection | Craniotomy and MCA microinjection | Yes | Yes | High reproducibility; low mortality; tPA-lytic treatment | Orset et al. 2007 (Ref #10) | ||
| Emboli-MCAO | Endovascular MCA occlusion | Yes | Yes | tPA-lytic treatment; Variable clot hardness | Busch et al. 1997 (Ref #13) | ||
| Transient Hypoxia-Ischemia (tHI) | UCCAO plus hypoxia | Yes | Yes | Infarct > the MCA area; Systemic CV effects | Sun et al. 2014 (Ref #15) |
Table 1: Comparison of selected preclinical stroke models. Filled boxes indicate positivity (the presence of blood clots, platelets, and fibrin) or significant tPA reactivity.
Supplementary Figure 1: CBF monitor after retro-orbital injection of thrombin. (A) The representative photos of retro-orbital sinus (upper panel) and blood flow by laser speckle contrast imaging (lower panel). The three vascular sites (1~3 as labeled) was monitored after thrombin injection (80 U/ kg) into the retro-orbital sinus. (B) The representative tracing graph of blood flow for 15 min after thrombin injection (arrow). (C) The laser speckle-based quantification showed no reduction of blood flow near the retro-orbital sinus within 15 min after thrombin injection (n=4, p-value determined by unpaired t-test). Please click here to download this figure.
Supplementary Figure 2: Lack of fibrin deposition in contralateral hemisphere at 6 hours after photoactivation. Immunostaining of the anti-fibrinogen (green) showed fibrin deposition in the ipsilateral cortex at 6 h after RB and T+RB photothrombosis. In contrast, there was no discerible fibrin deposition in the contralateral cortex following thrombin-enhanced photothrombosis. N=4 for each group. Scale bar: 50 μm. Blue fluorescence as the DAPI-nucleus staining. Please click here to download this figure.
Supplementary Figure 3: Lack of immunoglobulin (IgG) extravasation after photothrombosis. At 6 h after unilateral MCA-targeted photoactivation, immunostaining showed extravasation of IgG in the ipsilateral hemisphere, but not in contralateral hemisphere, suggesting restricted BBB damage after thrombin-enhanced photothrombosis. N=4 for each. Scale bar: 50 μm. Please click here to download this figure.
Discussion
The traditional RB photothrombotic stroke, introduced in 1985, is an attractive model of focal cerebral ischemia for simple surgical procedures, low mortality, and high reproducibility of brain infarction.5 In this model, the photodynamic dye RB rapidly activates platelets upon light excitation, leading to dense aggregates that occlude the blood vessel5,8,23. However, the small amount of fibrin in RB-induced blood clots (Figure 2) deviates from the dominant platelet:fibrin intermixed pattern of thrombi retrieved acutely in ischemic stroke patients21,22. The low fibrin-content in RB-induced thrombi likely also contributes to its resilience to tPA-lytic treatment7,8,19. Though ultraviolet laser irradiation induces vascular recanalization in RB photothrombosis, this experimental therapy is unlikely to be used clinically7. Thus, the traditional RB photothrombotic stroke has been mainly used as a permanent occlusion model, less suited for thrombolysis and neuroprotection research (the latter often uses intraluminal suture MCAO model that features rapid vascular reperfusion upon removal of the mechanical occlusion).
We hypothesized that using admixture of RB and a sub-thrombotic dose of thrombin for photoactivation may increase the fibrin content in ensuing thrombi and enhance the responses to tPA thrombolysis, the real-world stroke therapy. This hypothesis is supported by the results presented here and in our original report.23 The thrombin-enhanced photothrombotic stroke model also maintains the advantages of low mortality, simple surgical procedures, and high consistency in infarction size and location, as in traditional RB photothrombosis model. Hence, we believe that thrombin-enhanced photothrombosis is a valuable addition to the repertoire of thromboembolic stroke models (Table 1). Two procedural details of the thrombin-enhanced photothrombosis model warrants discussion. First, over-dose of intravenous thrombin may provoke acute pulmonary thromboembolism and animal mortality25. We examined a range of thrombin doses for combination with RB photothrombosis, and the chosen 80 U/kg dose has not induced mortality in >100 experimented adult male C57Bl/6 mice so far. It is likely that the thrombin dose needs adjustment for mice with hypercoagulation states26. Second, we routinely ligated the ipsilateral CCA besides MCA-targeted photothrombosis in our procedures. We found that ligation of the ipsilateral CCA further increases the consistency in infarct size, which may be due to diminished collateral circulation between MCA and the anterior plus posterior cerebral arteries.
With its unique properties, the thrombin-enhanced photothrombotic stroke model may be particularly useful for at least three research topics. First, this new model is ideally suited for head-to-head comparison of tPA and other fibrinolytic agents such as Tenecteplase (TNKase)27. TNKase is an engineered tPA-mutant variant with increased fibrin-specificity and a lower risk for iatrogenic hemorrhage in ex vivo experiments. Yet, its superiority to tPA has only been tested in a micro-embolic stroke model and using a binary neurological outcome analysis14. Given its high reproducibility and quantitative infarct size analysis, the thrombin-enhanced photothrombotic stroke model can be used to compare the benefits and adverse effects of tPA-versus-TNKase in multiple aspects (e.g., dose responses, therapeutic window, comorbidity impacts, and potential adverse effects in delayed treatment). Second, the thrombin-enhanced photothrombosis model may be useful for investigating the effects of combined tPA and anti-platelet treatment in acute ischemic stroke28. Recent advances of endovascular procedures in ischemic stroke have enabled researchers to analyze the histological composition of acute thrombi and identified a dominant, intermixed platelet:fibrin pattern21,22. Accordingly, the combination of a fibrinolytic agent (tPA) and anti-platelet agents may boost the overall efficacy of thrombolysis, but a stroke model that simulate the clinical platelet:fibrin composition of thrombus is crucial for such research. Along with the tHI and emboli-MCAO models, thrombin-photothrombosis meets this requirement and stands out for its low mortality, simple surgical procedures, and lack of systemic cardiovascular effects (Table 1).
Last but not least, thrombin-enhanced photothrombosis may be particularly useful for investigating stroke-induced collateral circulation, given its predictable peri-infarct location in the MCA-supplying territory. By sustaining the penumbra to offset infarct growth, collateral circulation is increasingly recognized as an important predictor of ischemic stroke outcomes, because acute vascular obstruction promotes blood flow across collateral network, followed by remodeling and angiogenesis to form neo-collateral vessels29,30. The results suggest that tPA not only promotes recanalization of the proximal MCA, but also increases collateral circulation in the peripheral of MCA-supplying area (Figure 4). Better understanding the mechanisms that regulates the plasticity of collateral circulation may suggest novel therapies. As the thrombin-enhanced photothrombotic stroke model offers the advantage of predictable peri-infarct region and sensitivity to lytic treatment, it will assist the research of post-stroke collateral circulation.
Disclosures
The authors have nothing to disclose.
Acknowledgements
This work was supported by the NIH grants (NS108763, NS100419, NS095064, and HD080429 to C.Y. K.; and NS106592 to Y.Y.S.).
Materials
| Name | Company | Catalog Number | Comments |
|---|---|---|---|
| 2,3,5-triphenyltetrazolium chloride (TTC) | Sigma | T8877 | infarct |
| 4-0 Nylon monofilament suture | LOOK | 766B | surgical supplies |
| 5-0 silk suture | Harvard Apparatus | 624143 | surgical supplies |
| 543nm laser beam | Melles Griot | 25-LGP-193-249 | photothrombosis |
| adult male mice | Charles River | C57BL/6 | 10~14 weeks old (22~30 g) |
| Anesthesia bar for mouse adaptor | machine shop, UVA | surgical setup | |
| Avertin (2, 2, 2-Tribromoethanol) | Sigma | T48402 | euthanasia |
| Dental drill | Dentamerica | Rotex 782 | surgical setup |
| Digital microscope | Dino-Lite | AM2111 | brain imaging |
| Dissecting microscope | Olympus | SZ40 | surgical setup |
| Fine curved forceps (serrated) | FST | 11370-31 | surgical instrument |
| Fine curved forceps (smooth) | FST | 11373-12 | surgical instrument |
| goat anti-rabbit Alexa Fluro 488 | Invitrogen | A11008 | Immunohistochemistry |
| Halsted-Mosquito hemostats | FST | 13008-12 | surgical instrument |
| Heat pump with warming pad | Gaymar | TP700 | surgical setup |
| infusion pump | KD Scientific | 200 | thrombolytic treatment |
| Insulin syringe with 31G needle | BD | 328291 | photothrombosis |
| Ketamine | CCM, UVA | anesthesia | |
| Laser protective google 532nm | Thorlabs | LG3 | photothrombosis |
| Ketoprofen | CCM, UVA | NSAID analgesia | |
| micro needle holders | FST | 12060-01 | surgical instrument |
| micro scissors | FST | 15000-03 | surgical instrument |
| MoorFLPI-2 blood flow imager | Moor | 780-nm laser source | Laser Speckle Contrast Imaging |
| Mouse adaptor | RWD | 68014 | surgical setup |
| Puralube Vet ointment | Fisher | NC0138063 | eye dryness prevention |
| Retractor tips | Kent Scientific | Surgi-5014-2 | surgical setup |
| Rose Bengal | Sigma | 198250 | photothrombosis |
| Thrombin | Sigma | T7513 | photothrombosis |
| Tissue glue | Abbott Laboratories | NC9855218 | surgical supplies |
| tPA | Genetech | Cathflo activase 2mg | thrombolytic treatment |
| Vibratome | Stoelting | 51425 | TTC infacrt |
| Xylazine | CCM, UVA | anesthesia |
References
- Lyden, P. D. Thrombolytic Therapy for Acute Stroke. 3/e. , Springer. (2015).
- Linfante, I., Cipolla, M. J. Improving reperfusion therapies in the era of mechanical thrombectomy. Translational Stroke Research. 7 (4), 294-302 (2016).
- Campbell, B. C., et al. Endovascular Therapy for Ischemic stroke with perfusion-imaging selection. The New England Journal of Medicine. 372 (11), 1009-1018 (2015).
- Hossmann, K. A. The two pathophysiologies of focal brain ischemia: implications for translational stroke research. Journal of Cerebral Blood Flow and Metabolism. 32 (7), 1310-1316 (2012).
- Longa, E. Z., Weinstein, P. R., Carlson, S., Cummins, R. Reversible middle cerebral artery occlusion without craniectomy in rats. Stroke. 20 (1), 84-91 (1989).
- Watson, B. D., Dietrich, W. D., Busto, R., Wachtel, M. S., Ginsberg, M. D. Induction of reproducible brain infarction by photochemically initiated thrombosis. Annals of Neurology. 17 (5), 497-504 (1985).
- Watson, B. D., Prado, R., Veloso, A., Brunschwig, J. P., Dietrich, W. D. Cerebral blood flow restoration and reperfusion injury after ultraviolet laser-facilitated middle cerebral artery recanalization in rat thrombotic stroke. Stroke. 33 (2), 428-434 (2002).
- Uzdensky, A. B. Photothrombotic stroke as a model of ischemic stroke. Translational Stroke Research. 9 (5), 437-451 (2018).
- Karatas, H., et al. Thrombotic distal middle cerebral artery occlusion produced by topical FeCl(3) application: a novel model suitable for intravital microscopy and thrombolysis studies. Journal of Cerebral Blood Flow and Metabolism. 31 (3), 1452-1460 (2011).
- Orset, C., et al. Mouse model of in situ thromboembolic stroke and reperfusion. Stroke. 38 (10), 2771-2778 (2007).
- Orset, C., et al. Efficacy of Alteplase in a mouse model of acute ischemic stroke: A retrospective pooled analysis. Stroke. 47 (5), 1312-1318 (2016).
- Kudo, M., Aoyama, A., Ichimori, S., Fukunaga, N. An animal model of cerebral infarction. Homologous blood clot emboli in rats. Stroke. 13 (4), 505-508 (1982).
- Busch, E., Kruger, K., Hossmann, K. A. Improved model of thromboembolic stroke and rt-PA induced reperfusion in the rat. Brain Research. 778 (1), 16-24 (1997).
- Lapchak, P. A., Araujo, D. M., Zivin, J. A. Comparison of Tenecteplase with Alteplase on clinical rating scores following small clot embolic strokes in rabbits. Experimental Neurology. 185 (1), 154-159 (2004).
- Sun, Y. Y., et al. Synergy of combined tPA-Edaravone therapy in experimental thrombotic stroke. PLoS One. 9 (6), 98807(2014).
- Sun, Y. Y., et al. Prophylactic Edaravone prevents transient hypoxic-ischemic brain injury: Implications for perioperative neuroprotection. Stroke. 46 (7), 1947-1955 (2015).
- Sun, Y. Y., et al. Sickle mice are sensitive to hypoxia/ischemia-induced stroke but respond to tissue-type plasminogen activator treatment. Stroke. 48 (12), 3347-3355 (2017).
- Sun, Y. Y., Kuan, C. Y. A thrombotic stroke model based on transient cerebral hypoxia-ischemia. Journal of Visualized Experiments. (102), e52978(2015).
- Pena-Martinez, C., et al. Pharmacological modulation of neutrophil extracellular traps reverses thrombotic stroke tPA (tissue-type plasminogen activator) resistance. Stroke. 50 (11), 3228-3237 (2019).
- Denorme, F., et al. ADAMTS13-mediated thrombolysis of t-PA-resistant occlusions in ischemic stroke in mice. Blood. 127 (19), 2337-2345 (2016).
- Marder, V. J., et al. Analysis of thrombi retrieved from cerebral arteries of patients with acute ischemic stroke. Stroke. 37 (8), 2086-2093 (2006).
- Bacigaluppi, M., Semerano, A., Gullotta, G. S., Strambo, D. Insights from thrombi retrieved in stroke due to large vessel occlusion. Journal of Cerebral Blood Flow and Metabolism. 39 (8), 1433-1451 (2019).
- Sun, Y. Y., et al. A murine photothrombotic stroke model with an increased fibrin content and improved responses to tPA-lytic treatment. Blood Advances. 4 (7), 1222-1231 (2020).
- Su, E. J., et al. Activation of PDGF-CC by tissue plasminogen activator impairs blood-brain barrier integrity during ischemic stroke. Nature Medicine. 14 (7), 731-737 (2008).
- Gupta, A. K., et al. Protective effects of gelsolin in acute pulmonary thromboembolism and thrombosis in the carotid artery of mice. PLoS One. 14 (4), 0215717(2019).
- Carroll, B. J., Piazza, G. Hypercoagulable states in arterial and venous thrombosis: When, how, and who to test. Vascular Medicine. 23 (4), 388-399 (2018).
- Coutts, S. B., Berge, E., Campbell, B. C., Muir, K. W., Parsons, M. W. Tenecteplase for the treatment of acute ischemic stroke: A review of completed and ongoing randomized controlled trials. International Journal of Stroke. 13 (9), 885-892 (2018).
- McFadyen, J. D., Schaff, M., Peter, K. Current and future antiplatelet therapies: emphasis on preserving haemostasis. Nature Reviews Cardiology. 15 (3), 181-191 (2018).
- Bang, O. Y., Goyal, M., Liebeskind, D. S. Collateral crculation in ischemic stroke: Assessment tools and therapeutic strategies. Stroke. 46 (11), 3302-3309 (2015).
- Faber, J. E., Chilian, W. M., Deindl, E., van Royen, N., Simons, M. A brief etymology of the collateral circulation. Arteriosclerosis, Thrombsis, Vascular Biology. 34 (9), 1854-1859 (2014).
Reprints and Permissions
