A number of different procedures for preparing nanoparticles for surface analysis are presented (drop casting, spin coating, deposition from powders, and cryofixation). We discuss the challenges, opportunities, and possible applications of each method, particularly regarding the changes in the surface properties caused by the different preparation methods.
Method Article
Preparation of Nanoparticles for ToF-SIMS and XPS Analysis
Opens in a new tab
In This Article
Summary
Loading...
$$\rightleftharpoonup{xx}$$
$$\longleftharp{xx}$$,
$$\longrightharp{xx}$$,
Abstract
Loading...
$$\rightleftharpoonup{xx}$$
$$\longleftharp{xx}$$,
$$\longrightharp{xx}$$,
Nanoparticles have gained increasing attention in recent years due to their potential and application in different fields including medicine, cosmetics, chemistry, and their potential to enable advanced materials. To effectively understand and regulate the physico-chemical properties and potential adverse effects of nanoparticles, validated measurement procedures for the various properties of nanoparticles need to be developed. While procedures for measuring nanoparticle size and size distribution are already established, standardized methods for analysis of their surface chemistry are not yet in place, although the influence of the surface chemistry on nanoparticle properties is undisputed. In particular, storage and preparation of nanoparticles for surface analysis strongly influences the analytical results from various methods, and in order to obtain consistent results, sample preparation must be both optimized and standardized. In this contribution, we present, in detail, some standard procedures for preparing nanoparticles for surface analytics. In principle, nanoparticles can be deposited on a suitable substrate from suspension or as a powder. Silicon (Si) wafers are commonly used as substrate, however, their cleaning is critical to the process. For sample preparation from suspension, we will discuss drop-casting and spin-coating, where not only the cleanliness of the substrate and purity of the suspension but also its concentration play important roles for the success of the preparation methodology. For nanoparticles with sensitive ligand shells or coatings, deposition as powders is more suitable, although this method requires particular care in fixing the sample.
Introduction
Loading...
$$\rightleftharpoonup{xx}$$
$$\longleftharp{xx}$$,
$$\longrightharp{xx}$$,
Nanomaterials are defined as materials having any external dimension between 1 nm and 100 nm or having an internal or surface structure on this scale1. Due to the unique properties arising from their small scale and correspondingly large surface area (among other factors), they find increasing use in a wide variety of fields including agriculture, chemistry, automotive construction, cosmetics, environment, medicine, printing, energy, and textiles. This increased use means that both humans and the environment will be exposed, on a hitherto unknown scale, to these materials whose toxicological properties are not yet fully known, and whose size enables their facile integration into biological or environmental systems2.
After the fundamental properties of surface area and particle size/size distribution, surface chemistry and coatings were identified as the most crucial property of nanomaterials3; smaller particles have a higher surface area per unit mass, and therefore a higher ratio of surface to bulk atoms. Indeed, for nanoparticles of 1 nm size, over 70% of atoms can be found at corners or edges; this strongly influences surface properties such as chemisorption which is highly dependent on the atomic-scale surface morphology4. Regulations dealing with nanomaterials require accurate data regarding physicochemical properties and reliable estimates of the toxicological properties of these materials. In order to efficiently estimate toxicological properties from physical and chemical properties of nanomaterials, the nanomaterials community requires reliable, standardized, and verified analytical procedures. Projects such as ACEnano5 aim to collect and correlate accurate and verifiable physical data from nanoparticles in a framework allowing better regulation and characterization of nanomaterials. This drive towards standardized analytical procedures has also been supported by the editors of ACS Nano, wishing “to consolidate and to agree on methods of characterization and minimum levels of analysis of materials6”. Furthermore, XPS and ToF-SIMS offers new possibilities for elucidating the particle architecture of core-shell nanoparticles7,8.
X-ray photoelectron spectroscopy (XPS) and Time-of-Flight Secondary Ion Mass Spectrometry (ToF-SIMS), compared in Table 1, are well-established methods for investigation of surface atoms. In XPS, the sample is irradiated with x-rays having an energy between 1 and 2 keV, causing emission of electrons due to the photoelectric effect. These emitted electrons, having a kinetic energy in the same range, correlate to the binding energy of the electrons in the solid; the appearance of photoelectrons at these defined binding energies and measurable intensities therefore allows quantitative analysis of the composition. Since the mean free pathway of these photoelectrons is below 10 nm, XPS is a highly surface sensitive technique for quantitative analysis. Furthermore, detailed analysis of the binding energies in highly resolved spectra enables the quantitative determination of the valence states of these electrons.
In ToF-SIMS the surface is sputtered with a focused ion beam (primary ions), with the ions ejected from the material (secondary ions) collected and analyzed in a time-of-flight mass spectrometer. The mass/charge pattern obtained allows the determination of the elemental, isotopic, or molecular composition. Due to the mean free pathway of the secondary ions, this technique is also highly surface sensitive and has an information depth of 1–2 nm but is at best semi-quantitative, due to the matrix effect whereby the ionization probability (and therefore yield) of secondary ions is strongly influenced by their surrounding matrix. ToF-SIMS can be operated in either static or dynamic mode; the difference between the two is the primary ion flux impacting the surface. Static SIMS keeps the primary ion flux to a level that impacts (i.e., fragments) a maximum of 1%-10% of the surface; the surface remains relatively undisturbed, which allows analysis of the top atomic layers of material. Since even static SIMS causes some destruction to the surface, it is considered to be less “non-destructive” of the two methods.
These surface-sensitive techniques allow analysis of the first few nanometers of the material, including intentional or unintentional coatings, which, for nanomaterials, can significantly influence material properties. Examples of intentional coatings are capping layers on quantum dots to improve photoluminescence quantum yields and reduce environmental reactivity9, alumina or silica coatings for the prevention of photocatalytic activity of titania nanoparticles in sun blockers10, surface functionalization to enable bioconjugation and subsequent biological activity11, coatings for diagnostic and drug delivery applications12, and fluorocarbon coatings on magnetic particles for ferrofluids and core-shell metallic systems to enhance catalyst properties13. Unintentional coatings, such as oxidation, surface contamination, or protein coronas in biological systems have a similarly strong influence on nanoparticle properties and it is crucial that experimental preparation procedures ensure that the coating and more generally the surface chemistry of the nanomaterial is not destroyed or transformed. It is also crucial to evaluate the properties of the nanoparticles as they are in-situ, as their properties can be drastically altered by the change2,14,15. In addition, the concentration of stabilizers in the nanoparticle suspension can dramatically influence the analysis and structural integrity of the nanoparticles; the presence of a stabilizer can result in large unwanted signals (for example, C, H, O, and Na) in the analysis, while its removal can result in damage or agglomeration of the nanoparticles.
Due to their size and surface area, the storage conditions of nanoparticles also affect their behavior, both as stored powders/suspensions and as prepared samples. The effect of sub-optimal storage conditions, particularly room-temperature storage and exposure to light, have been shown in various studies to cause degradation of the nanoparticles which has been shown to alter the particles’ physical, chemical, and/or toxicological properties14,15,16,17,18. Smaller nanoparticles have been shown to oxidize more rapidly than larger ones with oxidation/degradation rates dependent on storage conditions15 as well as surface chemistry14. The effects of the nanoparticle degradation during storage have been shown to significantly affect physicochemical properties including toxicity14, while the oxidative growth can proceed inwards at the expense of the core15.
The careful storage and preparation of nanomaterials is therefore essential for an accurate surface analysis, and any factors which could influence the sample surface and/or the quality of the measurements should be carefully considered. It should be noted that due to the relatively low spatial resolution of XPS (in the µm range) and ToF-SIMS (a few hundred nm), only a small subset of the nanoparticles can be investigated; these methods average over an area and do not have the ability to image single particles as is possible with techniques such as electron microscopy. For this reason, any analysis requires deposition of the nanoparticles in a continuous layer to ensure no interference from the substrate. Electron microscopy and XPS/ToF-SIMS are therefore often used together as complementary methods for nanomaterial analysis.
Aside from changes in surface chemistry, the main challenges for preparation of nanoparticle samples for XPS and ToF-SIMS analysis are to prepare a layer that is: homogeneous, to increase reproducibility; gapless, to minimize the contribution of the substrate to the spectra; thin enough to avoid charging effects (for non-conductive samples); and securely fixed to the substrate, to avoid free nanoparticles entering and damaging ultrahigh vacuum instruments
Nanoparticles can be deposited onto the substrate from suspension or as a powder. Firstly, we will discuss the different methods for depositing nanoparticles from suspension. Silicon wafers are a commonly used substrate for suspension deposition, because they are relatively cheap, readily available as a highly pure product consisting of pure or doped silicon (doping avoids charging effects), and for most nanoparticles the spectral peaks do not overlap with peaks typical for nanoparticles. This last point is important; before analysis it should be ensured that the substrate peaks are well separated from the peaks expected from the nanoparticles, otherwise interpretation of the spectra is complicated or impossible and the continuous coverage of the substrate by the nanoparticles cannot be verified. Before using silicon wafers, an extensive cleaning procedure (described in this publication) is necessary to remove (organic) contaminants and to increase the surface wettability. Other suitable substrates such as gold films, highly ordered pyrolytic graphite (HOPG), or indium foils have been successfully used, but a discussion about their preparation is beyond the scope of this work19,20,21,22.
Secondly, we present methods for depositing nanoparticle powders on a substrate for XPS and ToF-SIMS analysis and present the advantages and disadvantages of each method, allowing researchers new to the techniques to find the optimal preparation method for their purposes. Thirdly, we discuss cryofixation, which is a suitable preparation method to conserve features such as the agglomeration behavior, organic corona, solid/aqueous interface23,24 or distribution in biological media25 of NPs. Cryofixation, typically fast freezing of material in a liquid nitrogen–cooled cryogen and analysis in the frozen-hydrated state, allows the analysis and visualization of nanoparticles directly in complex matrices. This procedure does not cause ice crystal formation but forms amorphous ice that keeps membranes and cellular and tissue structures in their native biological state, avoiding damage caused by water crystallization processes and enabling the exact chemical distribution of all cell metabolites and cell membrane compounds to be maintained26,27,28. This preparation method may be of particular interest for presenting an exact chemical map of the actual NP agglomerate or heteroagglomerate, visualizing the exact chemical space in close proximity to the nanoparticle directly in suspension, or correlating either cell tissue-specific features or intra-cellular compartments within NP agglomerates or heteroagglomerates.
As shown through the results presented in this work, the most suitable procedure in a particular case is dependent on a variety of parameters such as the nanoparticles’ hydrophilicity, stability, conductivity, state (e.g., powder or suspension) and the analytical question at hand (e.g., size, bulk properties, or surface coatings). A variety of methods are presented here that can be used for preparation of NPs for surface analysis, as well as a comparison of their advantages and disadvantages.
Protocol
Loading...
$$\rightleftharpoonup{xx}$$
$$\longleftharp{xx}$$,
$$\longrightharp{xx}$$,
CAUTION: The toxicological properties of nanoparticles are still under investigation; due to their size they can present unique hazards in humans as well as in the environment even when they consist of intrinsically non-hazardous materials. Before undertaking any work with nanoparticles, a proper risk assessment should be completed, and appropriate engineering controls, lab procedures, and PPE (personal protective equipment) put in place, depending on the hazard level of the materials to be studied29,30,31,32.
1. Preparation of Si wafers
NOTE: These steps are necessary to remove undesired (organic) contamination and increase the surface wettability. All solvents used should be at least ACS grade. A standard sonication bath (35 kH and 120 Watts) is suitable.
- Wet chemical cleaning of Si wafers
- Put the Si wafer in a beaker with isopropanol and ultrasonicate for 5 min.
- Transfer the Si wafer to a beaker with an alkali glass cleaning solution and ultrasonicate for 10 min.
- Put the wafer in a beaker with ultrapure water. Change the water 10 times by pouring out the water and refilling the beaker; the Si wafers will remain at the bottom due to the capillary effect.
- Dry the wafer with clean N2 gas.
NOTE: Drying with N2 prevents the formation of “coffee rings” and other artefacts from water drying. - Put the wafer in a second beaker with isopropanol and ultrasonicate for 10 min.
- Dry the wafer with clean N2 gas.
- Put the wafer in a beaker with ethanol and ultrasonicate for 10 min.
- Dry the wafer with clean N2 gas. The protocol can be paused here.
- Plasma or UV/ozone cleaning of silicon wafers
- Introduce the Si wafer in the plasma or the UV/ozone cleaner and switch on for 30 min.
NOTE: Wafers should be plasma- or UV/ozone-cleaned immediately before use.
- Introduce the Si wafer in the plasma or the UV/ozone cleaner and switch on for 30 min.
2. Nanoparticle deposition from suspension
NOTE: The most common exposure route for nanoparticles is by inhalation. Working with suspensions can minimize exposure hazards.
- Preparation of nanoparticle suspension from powder
NOTE: All quantities described here are examples. The method should be optimized for the particular nanoparticles used in each case.- Accurately weigh 15 mg of nanoparticle powder (± 10%) into a 10 mL tube.
- Accurately weigh in approximately 8 mL ultrapure water.
- Close the tube, pack in a 50 mL centrifuge tube with paper towel and place in the vortexer at 3,000 rpm for 15 min.
- Drop-casting of electrically conductive nanoparticles from aqueous suspension
- Place the wafer in the UV/ozone cleaner for 30 min.
- Place the wafer in one half of the wafer holder and place a 3 µL drop of nanoparticle suspension in the center of the ring.
- Mount a 6.07 mm diameter Viton O-ring on the wafer around the droplet. Take care that the ring does not touch the droplet.
- Place the wafer in a vacuum desiccator under a vacuum of 4 mbar for 15 min to dry the wafer.
- Remove the wafer from the desiccator and examine using light microscopy and XPS to determine that the particle layer is homogeneous and closed. Repeat steps 2.2.1 and 2.2.2 until analysis shows a closed and homogeneous layer. The protocol can be paused here.
- Spin-coating of electrically non-conductive nanoparticles from aqueous suspension
- Place the wafer in the UV/ozone cleaner for 30 min.
NOTE: By spin-coating suspensions of different concentrations using the same protocol, different levels of surface coverage can be achieved. - Program the spin-coater. A suitable sample program is: step 1: 500 rpm/s ramp to 1,000 rpm (5 s); step 2: 1,000 rpm/s ramp to 2,000 rpm (3 min); step 3: deceleration at 2,000 rpm/s to 0 rpm.
- Insert the wafer into the spin-coater and switch on the vacuum for fixation.
- Deposit 80 µL of the suspension on the wafer and start the program.
- Remove the wafer from the spin-coater.
- Store the sample in a new, clean wafertray. The protocol can be paused here.
- Analyze the sample using SEM to confirm gapless coverage of the substrate.
- Place the wafer in the UV/ozone cleaner for 30 min.
3. Nanoparticle deposition from powder
- Nanoparticle deposition on double-sided adhesive tapes (“stick and go”)
- Fix the double-sided adhesive to the sample holder and remove the liner.
- Take a spatula-tip of the nanoparticle powder and dip it onto the adhesive.
- Spread the sample over the adhesive and press into the adhesive with the spatula, until as much of the powder is adhered as possible.
- Check that the powder is fixed on the tap by inverting and tapping the sample holder, and by blowing a stream of gas (e.g., nitrogen) across it. The protocol can be paused here.
NOTE: Alternatively, a small amount of powder can be placed on a cleaned surface (Alu foil or glass slide) and pressed from above with the adhesive and double-sided sample holder. - Place a spatula-tip of the powder onto the cleaned surface. Press the sample holder with the adhesive onto the powder from above.
- Check that the powder is fixed on the tap by inverting and tapping the sample holder, and by blowing a stream of gas (e.g., nitrogen) across it. The protocol can be paused here.
- Preparation of pressed powder pellets
- Thoroughly clean all parts of the pellet die, taking care not to scratch the polished surface.
- Invert the pellet die and rest on a small spacer.
- Insert the plunger and one stainless steel pellet, with polished side up, and pull the plunger through until there is enough space to fill with the powdered sample.
- Fill the die with a small amount of sample (1 large spatula tip), and then insert the second stainless steel pellet with the polished side facing the sample.
- Place the base onto the body and carefully invert. If a vacuum is desired and available, attach the vacuum pump to the base of the pellet die.
- Place the die into a press, making sure it is centered.
- Apply a light load (2 kN) for approximately 20 s and release.
- Apply a heavier load (6 kN) for 2 min and release.
- After the load is released, release the vacuum pump.
NOTE: Due to the different material properties of various nanoparticles, it may be advantageous to prepare a series of pellets with different loads and load times to determine the optimum pellet pressing conditions. - Invert the die, place the extractor ring into position, and place a light load (up to 1 kN) between the plunger and the extractor ring.
- Remove the die parts from the press and carefully extract the sample pellet with tweezers.
- Gently mount the sample on a cleaned Si wafer using double-sided adhesive. The protocol can be paused here.
4. Cryofixation of nanoparticle suspensions
- Fill the main chamber of the fast-freeze device with liquid nitrogen.
- Fill the cooled fast-freeze chamber with the cryogen (propane).
- Allow the fast-freeze device to cool to its operating temperature.
NOTE: The fast-freeze device requires some time to reach operating temperature prior to the sample preparation, therefore a reasonable timeframe (a few hours) is required for cryofixing the samples. - Drop-cast 10–20 µL of NP suspension onto a cleaned Si wafer with a pipette.
- Holding the Si wafer with fixing tweezers, place it inside the plunge freeze device.
- Move the fixing tweezers to the plunge position.
- Press the button to drop the sample inside the cryogen.
- Wait several seconds until the sample is completely frozen.
- Transfer the frozen samples as fast as possible into a cooled environment.
- Place the cryofixed sample (Si wafer) into the sample holder and transfer it inside the instrument.
NOTE: For transport, dry ice is recommended and short-term sample storage is possible. The samples can be measured in a frozen state with a cooled instrument or with conventional ToF-SIMS settings after stabilization by freeze-drying the sample.
Results
Loading...
$$\rightleftharpoonup{xx}$$
$$\longleftharp{xx}$$,
$$\longrightharp{xx}$$,
This paper presents a variety of sample preparation methods for surface analysis of nanoparticles. Since the physicochemical properties of a specific NP will define both the optimal method for sample preparation (e.g., drop-casting vs. spin coating) and the best procedure for that method (for example, requiring different substrates or solvents), the suitability of the method used should be validated via alternative analytical methods and optimized if necessary. The results seen in this publication are consistent with previously published literature in showing the need for consistent protocols and procedures for sample preparation as well as the need for quality checks to ensure that the sample preparation and purification methods are appropriate, successful, and do not damage the nanoparticles22,33,34,35,36.
Sampling and storage methods for NPs have not been addressed here, as they are described in detail in various other references14,15,16,17,18,34,37,38,39. Naturally, great care should be taken that the samples analyzed are representative of the overall nanoparticle distribution and suitable sampling methods developed and validated. Storage conditions have also been shown to strongly affect nanoparticle properties over a period of months and should therefore be carefully considered. As an example, we recommend that nanoparticles should be stored in small amounts in sealed containers away from light, ideally below 4 °C. It is also crucial that storage, sampling and sample preparation is consistently performed according to validated procedures as well as is being documented in detail. This documentation should include the metadata from the NPs themselves, such as provenance information and storage conditions40. Tools such as electronic lab notebooks (ELNs) may be useful for consistent documentation of procedures and NP metadata, as well as enabling the production of data according to the FAIR principle (Findable, Accessible, Interoperable, and Reusable).
Accurate and correct surface analysis of NPs firstly requires a suitable choice of substrate. We have used cleaned Si wafers as substrates because they are readily available, durable, easily cleaned, conducting and sufficiently flat, however depending on the goals of the analysis the oxide surface layer can be a drawback, as the adventitious hydrocarbons on the substrate cannot be differentiated from those on the nanoparticles. When necessary, other materials such gold or polymeric coatings on Si wafers, Si3N4 wafers, or HOPG (highly oriented pyrolytic graphite) can be used19,20,21,22. The first step in sample preparation described in this paper is cleaning the Si wafer, shown as a schematic in Figure 1. The efficacy of the cleaning process can be verified by a variety of methods including XPS, as shown in Figure 2. The main contaminant (adventitious carbon) is typical for samples stored in air and is significantly reduced after the cleaning process. Additionally, hydroxylating the wafer surface via UV or ozone treatment avoids the coffee-ring effect from deposition from aqueous suspension by enhancing wettability and leading, therefore, to a more homogeneous distribution of the nanoparticles as shown in Figure 3. Alternative wet chemical cleaning methods for Si wafers may be used as needed; here only a reproducibly clean surface is required rather than the complete removal of all organic contaminants or the oxide layer. If the protocol is paused between the cleaning and suspension deposition steps, the wafer should be treated again under plasma or UV/ozone and the suspension deposited ideally within 15 min of treatment.
The suspension of 60 nm Au-Ag core-shell nanoparticles shown in section 2.2 contained a significant amount of sodium citrate as a stabilizer, which is a common occurrence in nanoparticle suspensions. For accurate analysis of these particles and their surface properties, particularly via XPS, as much stabilizer should be removed as possible, as it attenuates the signal from the nanoparticles and causes charging effects. In order to establish the optimal purification method for these nanoparticles, shown as SEM micrographs in Figure 4, they were either dialyzed in ultrapure water or purified using centrifugation and re-dispersion in triplicate. Although dialysis would seem a gentler method and centrifugation and re-dispersion more likely to cause agglomeration and aggregation of the particles, the SEM images show significant deformation and damage of the Au-Ag nanoparticles after dialysis (Figure 4B), while the centrifuged/re-dispersed particles are still intact (Figure 4C). This is particularly remarkable with metallic nanoparticles; our hypothesis is that there is an optimum amount of sodium citrate that enables some stabilization of the solution while not interfering with the signal for the nanoparticles, and removal of too much stabilizer causes damage to the nanoparticles. A previous report shows that there is an optimum number of centrifugation cycles for removal of most of the sodium citrate; exceeding this number causes some NP aggregation33. In this study, nine dialysis cycles (a total of 36 h) were required to obtain similar citrate concentration; however, this method resulted in a higher amount of aggregation than centrifugation as well as causing a decrease in surface functionalization. These results demonstrate the importance of verifying each step in the preparation procedure for each different type of nanoparticle, particularly with unknown samples.
The 60 nm Au-Ag core-shell nanoparticles used in this example are suitable for drop-casting due to their electrical conductivity, because charging effects are not an issue and a thick spot can be generated by repeated deposition using relatively little equipment. This thicker layer has the advantage of giving more reproducible measurements, and casting from a more concentrated suspension can save time by reducing the number of deposition steps. The deposition can be influenced by the substrate wettability; poor wetting can produce a thick nanoparticle spot which is advantageous for conductive samples, while good wetting can produce a more homogeneous nanoparticle layer, which can be useful for both conductive and insulating samples. As described in the protocol, drop-casting of nanoparticle suspensions usually requires repeated applications to obtain a thick layer with full coverage; this should be verified using XPS, but may also be quickly and easily verified using optical microscopy. Figure 5 shows the evolution of droplet coverage in a drop-casting of Au-Ag core-shell nanoparticles from aqueous solution; in this case, 13 drop-casting steps are required to achieve full coverage. Drop casting is particularly suitable for conductive particles, or the ones where charging effects can be adequately compensated. As with the other methods described in this publication, drop-casting should be optimized for each sample as different NP materials will have different properties concerning information depth and concentration and film thickness limits. It is important to avoid too thick films which can cause stacking of organics in turn inhibiting the NP signal.
A homogeneous and good quality coating helps to ensure consistent and reproducible results. In addition to the suspension concentration, solvent, and spin-coating parameters, the quality of spin-coated suspensions can also be negatively influenced by the presence of dust or other large macro- or microscopic particles. Figure 6 shows the improvement in spin-coating quality of a nanoparticle suspension after filtration with an 0.45 µm syringe filter. The filter should be selected to ensure that it does not remove nanoparticles from the suspension. The three different suspension concentrations described in the protocol (90, 9.0 and 0.9 mg/mL of 135 nm PS-PTFE core-shell nanoparticles) were spin-cast under the same conditions and analyzed using SEM and XPS. The top image and spectrum in Figure 7 show the film cast from the 90 mg/mL suspension, which shows a thick and gapless multilayer coverage in the SEM image as well as a notable absence of Si peaks in the CPS spectra, indicating no contribution of the substrate to the spectrum. This sample is ideal for XPS or ToF-SIMS analysis; additionally, the smaller F1s peaks from the shell of the particles can be clearly seen in the absence of a large signal from the substrate. The second sample cast from the 9.0 mg/mL suspension shows the particles in small single-layer agglomerates, which do not completely cover the surface. This sample is too thin and inhomogeneous for XPS or ToF-SIMS analysis. Furthermore, quantitative analysis can be impaired due to the contribution of adventitious carbon on the substrate even after careful cleaning; at the very least, such an effect must be considered in the uncertainty budget of the measurement. This sample would, however, be ideal for SEM or TEM analysis of particle size distribution using image analysis software, as the particles exist in a single layer and in a sufficient number (within the image) to provide a statistically significant evaluation. The sample cast from the lowest concentration (0.9 mg/mL) does not provide either continuous coverage or sufficient particle density to make it suitable for analysis of either surface chemistry or particle size distribution. A reliable quantitative analysis is not at all possible due to the dominant influence of the substrate.
Al2O3-TiO2 core-shell NPs with either a PDMS or glycerol outer layer were prepared via drop-casting from suspension as well as from powder using the “stick-and-go” method in order to compare the effects of the different preparation methods on the sensitive outer layer. The samples were analyzed with ToF-SIMS, where in the spectra was analyzed using Principal Components Analysis (PCA). PCA is a statistical technique for reducing the dimensionality of large data sets by creating new uncorrelated variables (the principal components), which maximize the variance in the data41,42,43,44,45. The separation of different sample sets on the principal component graph allows the results to be more easily analyzed and grouped. On the PCA scores plot in Figure 8B, which shows the discrimination power of each data set in comparison to all other data sets (i.e., between different sample sets) the two samples prepared from powder show very different scores, while the samples prepared from dispersion show very similar scores. The loading plots shown in Figure 8C indicate the relationship between variables, i.e., which peaks contribute the most to the respective principal components. All principal components are sorted according to their contribution to the observed difference between the data sets, i.e., PCA1 contributes the most to the observed separation of the different data sets. PC1 is dominated by the presence (PDMS-coated NPs prepared from powder) or absence (all other samples) of PDMS peaks, while PC2, the factor accounting for the second largest variation within the data sets, enables the differentiation of the Al2O3 and the organic capping on the NPs. This indicates that the measured spectra of NPs prepared from suspension are very similar and suggests that the PDMS and glycerol layers may have been removed or damaged by preparation from suspension, from either the suspension itself or the drying process, with dominating signals from the Al2O3 or TiO2.
While pressed pellets can provide advantages for preparation of powdered samples such as ease of handling and stability in ultrahigh-vacuum instruments (including the ability to sputter without dislodging NPs in the high-vacuum chamber), the high forces involved may also damage sensitive nanoparticles, as has already been seen with other preparation methods. A suitable protocol should be prepared and validated.
In the case of NP dispersions, cryofixation of drop-cast sample suspensions avoids coffee ring effects (because of the instantaneous fixing of the NP suspension and therefore elimination of drying effects) as well as the preservation of larger structures present in the suspension. Additionally, the application of adhesive tape is avoided. This in turn is reflected in reduced signals, which may be attributed to salts, contaminants, or other artifacts of the sample preparation procedure in the respective mass spectra as shown in Figure 9. The main advantage of cryofixation is the ability to conserve “as is” the chemical space around the nanoparticles and/or the chemical entity of the particle agglomerates or heteroagglomerates as well as their correlation to biological features within tissues or single cells or even the co-localization to intracellular compartments, without disruption from sample handling steps such as drying, drop-casting, etc46’47. We have demonstrated the applicability of the cryofixation technique within the current paper and have highlighted the advantages of cryofixation for TiO2 nanoparticles. We stress that cryofixation is particularly suitable for the analysis of biological samples due in their natural state without the dislocation of chemicals due to sample preparation artifacts. For more in-depth information about fixation techniques for biological samples the reader is referred to literature19,25,27,48,49.
| XPS | ToF-SIMS | |
| Probe Beam | Photons | Ions |
| Analysis Beam | Electrons | Ions |
| Spatial Resolution* | > 1 µm | 0.1 µm |
| Sampling Depth | 0.5 – 7.5 nm | <2 nm |
| Detection Limit | 0.01 -0.1 atom % | ppb |
| Quantification | Excellent (semi quantitative) | Challenging (matrix effects) |
| Information Content | Elemental Chemical bonding | Elemental Molecular |
| Organic Analysis | Excellent | Excellent in static mode |
| * specified by the manufacturer | ||
Table 1: Comparison of various methods for surface analysis.
| Method | Suitable for | Gives | Advantages | Disadvantages | Caution | Controls | Check |
| Dialysis | Purification | Removal of stabilisers/ impurities | Simple, low effort, no complicated equipment | Lack of control over process | May cause damage to nanoparticles | Time | Damage to nanoparticles (SEM) |
| Centrifugation/re-dispersion | Purification | Removal of stabilisers/ impurities | More control over process, simultaneous concentration | Labour-intensive, requires centrifuge | May cause aggregation or agglomeration | Centrifuge rotation speed, quantity of solvent | Agglomeration/ aggregation/ damage to nanoparticles (SEM) |
| Drop casting (suspension) | Conductive NPs without sensitive outer layer | Relatively thick coated spot | Simple, no complicated equipment | Can give inhomogeneous thickness, time-intensive | Suspension preparation may damage sensitive NP shells | Suspension concentration, solvent (substrate wettability) | Coverage (light microscopy/XPS) |
| spin coating (suspension) | Conductive or non-conductive NPs without sensitive outer layer | Thin homogeneous layer, or single particles | Consistent settings | Requires experimental determination of optimal parameters | Filter out dust/impurities, coverage may be inconsistent | Concentration, spin coating parameters, solvent | Pre-filtration, Coverage, layer thickness (SEM/XPS) |
| "stick and go" (powder) | Inorganic conductive and non-conductive NPS with sensitive outer layer | Powder spot on adhesive | Simple, low effort, no complicated equipment | Unsuitable for organic or C-containing NPs, Inconsistent film thickness | Danger of NP release into instruments | Fixation of NPs onto adhesive | Stability under high vacuum conditions |
| deposition in hole of a stub (powder) | XPS analysis; conductive/non-conductive organic or inorganic particles | Lightly pressed nanoparticle sample | No contact with other materials | No secure fixation of NPs; unsuitable for ToF-SIMS | Dager of NP release into instruments | None | Lightly tilt to the side, to ensure powder is compacted |
| Pressed pellets (powder) | Conductive and non-conductive NPS, polymeric NPs | Solid pellet | Enables analysis of polymeric NPs as powder | May damage or contaminate NP surface | Materials should be cleaned thoroughly to avoid surface contamination; may damage surface | Size, pressure, time | Stability under high vacuum conditions |
| Cryo-fixation (suspension) | NP suspensions with sensitive ligand layer; biological samples | Solid sample | Conserves morphology, native biological state and corona, reduces coffee ring effect | Sophisticated and expensive preparation and sample handling, requires skilled user | high degree of skills required for sample handling and sample storage | Concentration, droplet size, temperature | Preservation of vitrification |
Table 2: Comparison of different sample preparation methods.
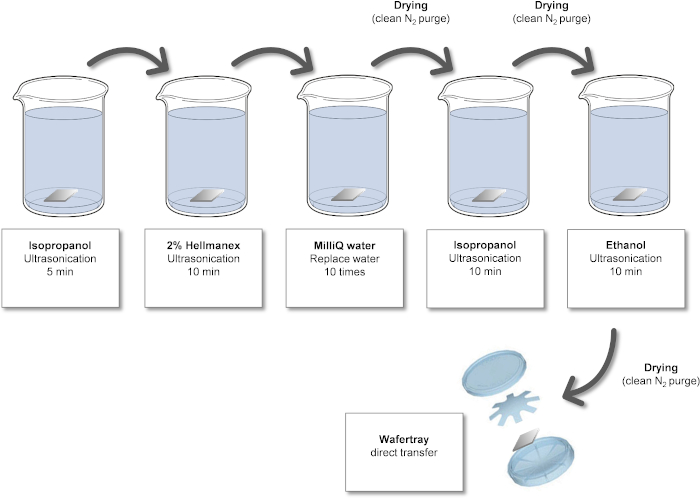
Figure 1: Cleaning process for Si wafers. Please click here to view a larger version of this figure.
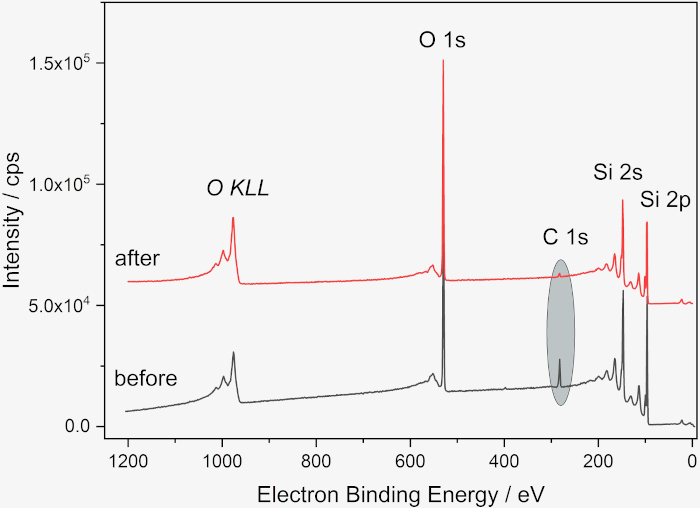
Figure 2: XP spectra of Si wafer before and after cleaning. Survey before (gray) and after (red) cleaning, showing the decrease of the carbon amount from 13 at% to 2 at%. The spectra were obtained with a Kratos Supra DLD (Manchester, UK) with a monochromatic Al Kα radiation. The samples were fixed with double-adhesive tape on the sample holder, pass energy was 80 eV, step width 1 eV, dwell time 500 ms. The “hybrid lens mode” was used. The X-ray spot size was 300 x 700 µm². A flood gun was used for charge compensation. For quantitative analysis, the software package UNIFit 202050 was used, using the peak areas of the corresponding photoelectron peaks corrected with a Tougaard background and normalized with Scofield factors, inelastic mean free pathways and the transmission function. Please click here to view a larger version of this figure.
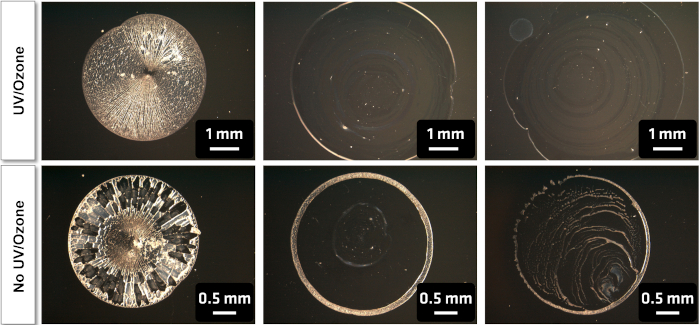
Figure 3: Effect of UV/Ozone cleaning on homogeneity of particle dispersion in the drop-casting of PTFE-PMMA core-shell nanoparticles from aqueous suspension. The wafers cleaned with UV/ozone show a significant decrease in coffee-rings, as well as better adhesion of the particles to the surface. Please click here to view a larger version of this figure.
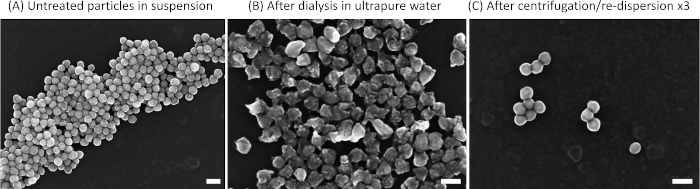
Figure 4: Treatment options for removing impurities (e.g., stabilizers) from nanoparticle suspensions SEM images showing the effect of dialysis (top right) and centrifugation and re-dispersion in triplicate (bottom right) on 60 nm Au-Ag core-shell nanoparticles. The nanoparticles are clearly damaged by the dialysis, while centrifugation has no visible affect. All scale bars are 100 nm. Please click here to view a larger version of this figure.
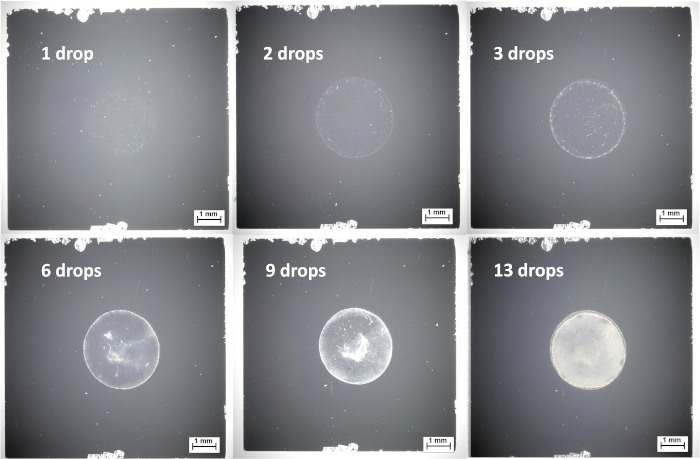
Figure 5: Optical microscope images from drop-casting of 60 nm diameter Au-Ag core-shell nanoparticles from aqueous suspension onto silicon wafers, showing sufficient coverage after 13 drops. Please click here to view a larger version of this figure.
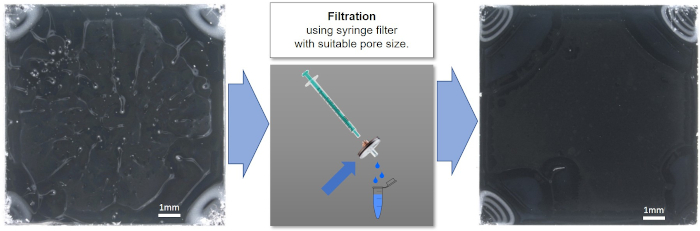
Figure 6: Spin-coated nanoparticle suspension, before (left) and after (right) filtration with an 0.45 µm syringe filter. The improvement in quality after filtration can clearly be seen. Please click here to view a larger version of this figure.
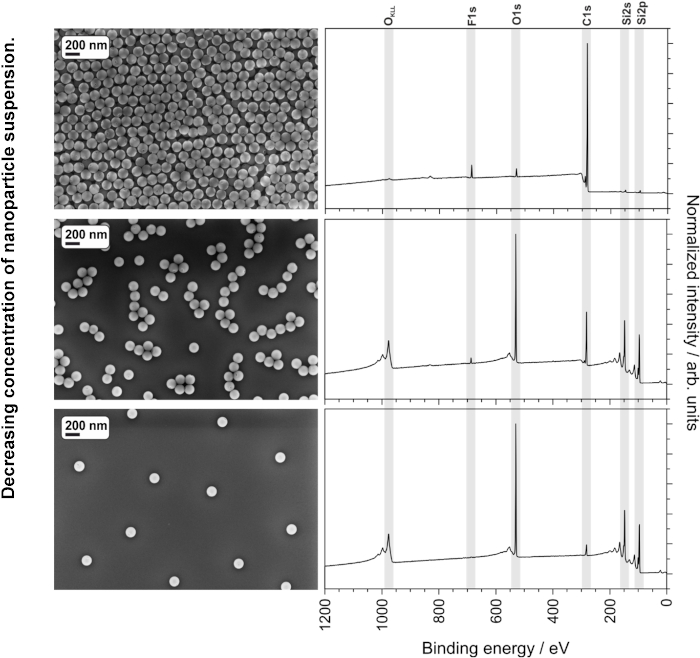
Figure 7: SEM images and XPS spectra of PMMA-PTFE core-shell nanoparticles spin-cast at various concentrations, showing the effect of substrate peaks (from insufficient coverage) on the XPS spectra. Please click here to view a larger version of this figure.

Figure 8: Principal Component Analysis (PCA) score plot, derived from ToF-SIMS spectra of glycerol- and PDMS-coated Al2O3-TiO2 core-shell NPs. (A) Schematic of NP structure; (B) Scores and (C) Loading plots after ToF-SIMS analysis of drop-cast (dispersion) and ”stick-and go“ (powder) preparation methods. PC1 represents peaks correlating to PDMS fragments; PC2 separates samples with an organic coating (samples prepared from powder) from Al2O3 peaks seemingly without surface coating. Spectra were measured in positive mode on an IONTOF ToF-SIMS IV instrument (ION-TOF GmbH, Münster, Germany) in the spectrometry mode (HCBU) with a 25 kV Bi3+ ion beam with a maximum dose density of 1012 ions/cm2. A field of view of 150 x 150 µm was scanned in sawtooth mode with 125 x 125 pixels. Please click here to view a larger version of this figure.
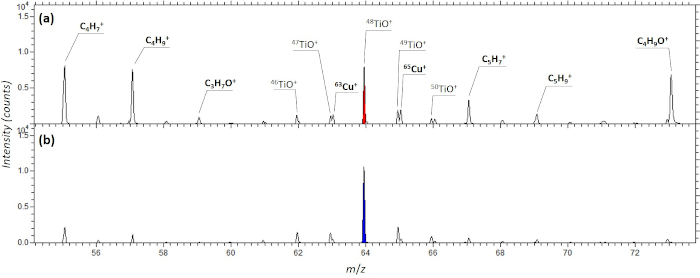
Figure 9: Section of ToF-SIMS mass spectra of TiO2 NPs. (A) prepared from powder with the “stick and go” method and (B) after cryofixation of the NP dispersion. A ToF-SIMS instrument (ION-TOF V; Ion-TOF GmbH, Münster, Germany) was used for mass spectrometry analyses with a pulsed 30 keV Bi3+ liquid metal ion gun (LMIG, direct current (dc), 16 nA). Each spectrum was acquired by scanning the ion beam over a sample area of 500 × 500 µm. Positive secondary ions were acquired in the mass range 0–1,200 Da using 106 Bi3+ pulses. Please click here to view a larger version of this figure.
Discussion
Loading...
$$\rightleftharpoonup{xx}$$
$$\longleftharp{xx}$$,
$$\longrightharp{xx}$$,
A number of methods have been presented for the preparation of nanoparticles for surface analysis using XPS and ToF-SIMS. We have summarized the advantages and disadvantages of these methods, as well as possible sources of error and suitability for different materials, in Table 2. As shown in the representative results, the preparation of nanoparticles can strongly influence the success of the resulting surface analysis. In addition, not all methods are suitable for all particle types due to factors such as signal interference with the substrate or mounting materials, charging effects in non-conducting thick films, state of the nanoparticles as a powder or suspension, potential damage to sensitive outer layers, destruction of biological structures and information on aggregation and interfaces, or vulnerability of sensitive ultrahigh-vacuum instruments to free nanoparticles.
Because XPS and ToF-SIMS measurements average over an area rather than measuring single particles, it is only possible to obtain reproducible results from homogeneous layers; aggregation or agglomeration of the particles on the substrate should therefore be avoided. Additionally, too-thick layers of non-conductive materials cause charging effects during analysis, which can lead to undesired artefacts in the spectra, especially partial charging which cannot be compensated with a flood gun. On the other hand, incomplete films show strong signals from the substrate or mounting materials (e.g., adhesives), which can interfere with sensitive peaks from the particle surface. The ideal thickness of the film is material dependent and should be determined experimentally by analysis of films of different thicknesses. In particular, samples prepared using spin coating should be analyzed with SEM to ensure completeness of the coating.
Working with NP suspensions presents fewer exposure hazards and safety requirements compared to working with NP powders. Drop-casting is a relatively simple method with low equipment requirements and is particularly suitable for conductive nanoparticles in suspension where film thickness is not a concern. While the samples can easily be dried under atmospheric conditions, the vacuum desiccator serves to reduce the drying time for the droplets as well as protecting the wafers from contamination. The Viton ring is used to modify the evaporation patterns of the droplet and thereby minimize the formation of coffee-rings. Evaporation patterns can also be influenced by varying the substrate hydrophilicity using cleaning protocols or by application of alternative coatings51,52, by evaporating in solvent atmospheres53, or even by heating the substrate54. Spin-coating is recommended for suspensions of non-conductive nanoparticles in suspension because it is capable of generating a homogeneous particle layer that is thin enough to avoid charging effects but still thick enough to prevent the Si substrate from contributing to the XPS and ToF-SIMS spectra. For each individual NP system and concentration, both the centrifuge and spin-coating parameters must be optimized but can then very reliably be reproduced even on different instruments. Because the spin-coated drop is always in the middle of the wafer, the radius of rotation is irrelevant and the unit “revolutions per minute” (rpm) can be used. The suspension could alternatively be deposited on the wafer after starting the program; however, this would require different spin-coating parameters and a greater amount of suspension to obtain a thicker coating.
Because of their extremely small size, nanoparticles may detach from the substrate and move freely inside the ultrahigh-vacuum chamber when impacted with an ion or x-ray beam. This is a particular problem for samples prepared with powder. In some cases, the nanoparticles can penetrate into the sensitive components of the instrument requiring expensive and time-consuming maintenance. Due to the applied acceleration voltage, the danger of damaging sensitive parts is larger with ToF-SIMS than with XPS. Powdered samples, particularly those prepared using the “stick and go” method, should be carefully checked to ensure the powders are fixed securely enough, especially for ToF-SIMS analysis. This can be confirmed by, for example, holding the sample upside down and blowing a stream of gas (e.g., N2) across it. Prior to analysis, the samples can also be left overnight in the airlock or other initial sample entry chamber of the instrument, where a stable vacuum can indicate that there are no loose particles from the sample. Nanoparticles prepared as pellets, however, can even be sputtered (at low acceleration voltages) without damaging the instrument; this method can eliminate contaminants, particularly hydrocarbons, introduced from the press and can also enable bulk analysis of the particles.
Preparation of NP powders in the sample holder stub allows for the preparation of samples with defined geometry and a macroscopically flat surface. Critical points are the cleanliness of the tool for pressing the sample, and the use of a low pressure to avoid changes in the nanoparticle surface due to this procedure. It has the disadvantages of needing a relatively high amount of material, and potential problems with loss of material in high-vacuum instruments. We do not recommend this method for ToF-SIMS analysis, as the particles are not compressed or secured in any way.
Regarding the NP material, the first consideration for sample preparation is elimination or minimizing of interference between NPs and substrates of similar material; for example, Si wafers are an unsuitable substrate for analysis of SiO2 NPs using XPS and ToF-SIMS, even with sufficient sample coverage. Metallic or inorganic nanoparticles can be readily analyzed as powder on an adhesive (assuming they contain no organic layers or coatings) due to the lack of signal interference between the nanoparticles and the double-sided adhesive, a preparation method which would be unsuitable for polymeric NPs. Metallic nanoparticles have more flexibility in terms of possible film thickness used due to the absence of charging effects, and may be drop-cast with relatively little equipment; however, they are likely to contain large amounts of impurities and stabilizers from their synthesis, which must be carefully removed without damage to the particles. Polymeric nanoparticles may more easily be damaged by die pressing but may also more readily hold together in the pellet, depending on the pressures used. Pellets or soft organic coatings on the NP surface also can be damage sensitive. Direct deposition from the solution has the potential to damage sensitive coatings either through the suspension or the drying process but is advantageous for analyzing NPs already present in suspension. Cryofixation is a suitable method for the analysis of chemical structures, surfaces or interfaces in suspension which would be damaged or destroyed by various other sample preparation techniques, but requires a specialized cryoequipment for both XPS and ToF-SIMS46’47.
While this paper describes several exemplary methods that can be used for sample preparation, in every case the method should be optimized and validated using alternative analytical methods. A detailed overview of the influence of different factors was recently published22. Besides the development and validation of suitable preparation methods, the documentation of these steps is also of paramount importance40. This publication presents some easy-to-handle methods and is a guide to modify or develop new methods according to the requirements of the specific task.
Disclosures
Loading...
$$\rightleftharpoonup{xx}$$
$$\longleftharp{xx}$$,
$$\longrightharp{xx}$$,
The authors have no competing interests to disclose.
Acknowledgements
Loading...
$$\rightleftharpoonup{xx}$$
$$\longleftharp{xx}$$,
$$\longrightharp{xx}$$,
This project has received funding from the European Union Horizon 2020 Programme (H2020) under grant agreement no. 720952 (ACEnano). The authors would like to thank Sigrid Benemann for SEM measurements, Markus Schneider for ToF-SIMS measurements and PCA, and Philipp Reichardt for assistance with filming.
Materials
| Name | Company | Catalog Number | Comments |
|---|---|---|---|
| 4-figure Laboratory balance | Kern & Sohn GmbH | ADB200-4A | |
| 5 mm Pellet die | Specac | GS03060 | |
| Alkali glass cleaning solution | Sigma-Aldrich | Hellmanex™ III Z805939 | Special cleaning solution for cuvettes |
| Carbon adhesive tabs | Plano | "Leit-Tabs" G3347 | |
| Clean laboratory beakers | any | e.g. 300 mL | |
| Cryo-freezer | Electron Microscopy Sciences | EMS-002 Cryo Workstation | |
| Dialysis tube with fasteners | Medicell Membranees Ltd | DTV12000.06.30 | Molecular weight cut-off (MWCO) 12-14 kDa |
| Die press | any | Capable of 2 kN force | |
| Disposable syringe, 1 mL, Luer-slip | TH Geyer | Labsolute 7657545 | Any appropriate volume can be used |
| Double-sided adhesive | 3M | Removable Repositionable Tape 665 | |
| Dry ice | Linde AG | ICEBITZZZ® | For short term storage/cooling |
| Eppendorf transfer pipette and tips | Eppendorf | various | Check correct size for planned pipetting volume |
| Ethanol, ACS grade | Merck KGaA | 1009832500 | |
| FFP2 or FFP3 mask | various | For working with nanoparticles from non-hazardous materials, when not in a fume hood or glove box | |
| Isopropanol, ACS grade | Merck KGaA | 1096342500 | |
| Lab coat, gloves and goggles | any | ||
| Laboratory centrifuge | Eppendorf | Centrifuge 5430 | |
| Laboratory fume hood | any | necessary for working with nanoparticles | |
| Laboratory stirrer & stirrer bar | NeoLab | D-6010 | |
| Lint-free wipes | Kimberley Clark Professional | Kimtech Science Precision wipes | Recommended for working with Si wafers |
| Liquid Nitrogen | Linde AG | Stickstoff flüssig 5.0 | Only for cooling of the cryogen. |
| Microtube/centrifuge tube 1,5 mL | T.H. Geyer GmbH & Co. KG | Labsolute 7696751 | |
| Nitrogen 5.0 | any | 99.999% purity | |
| Pasteur pipette, PE, plastic 3 mL | TH Geyer | Labsolute 7 691 203 | |
| Pasteur pipette, PE, plastic 3 mL | TH Geyer | Labsolute 7 691 203 | |
| Powder sample holder | BAM workshop | "Home-made" sample holder | |
| Propane | Sigma-Aldrich | 769037 | The cryogen should be of highest possible purity. |
| Sample vial or centrifuge tube 1 mL | Greiner Bio-One GmbH | Cellstar 188 261 | Should be capable of being fixed in the Vortexer |
| Silicon wafers | any | ideally 1cm2 pre-cut | |
| Spin-coater | SPS Europe | SPIN150i-NPP | |
| Syringe filter 0,45 µm | Th Geyer | Labsolute 7699803 | For smaller samples; larger versions exist for larger sample volumes |
| ToF-SIMS | IONTOF GmbH | ToF-SIMS IV or V, equipped with Bi LMIG and flood gun | |
| Tweezers for handling Si wafers | any | ||
| ultrapure water | TKA | MicroPure 08.1202 | |
| Ultrasonicator | Bandelin | Sonorex Super | |
| UV/Ozone cleaner | NanoBioAnalytics | UVC-1014 | |
| Vacuum dessicator | any | ||
| Vacuum pump (membrane/diaphragm) | Vacuubrand GmbH | Type MD-4T | |
| Viton O-ring 6.07 x 1.78 mm | Betech GmbH | 2-010, FKM 80 | |
| Vortexer | Heathrow Scientific | Vortexer HS120212 | |
| Wafer Holder 25mm coin style | Semiconductor Production Systems Europe | eWB0091-ASSY-1 | |
| XPS | Kratos | Kratos Axis Ultra DLD |
References
Loading...
$$\rightleftharpoonup{xx}$$
$$\longleftharp{xx}$$,
$$\longrightharp{xx}$$,
- https://www.iso.org/obp/ui/iso:std:61482:en (2015).">ISO/TS 18110:2015 in Nanotechnologies - Vocabularies for science, technology and innovation indicators. International Organization for Standardization. , Available from: https://www.iso.org/obp/ui/iso:std:61482:en (2015).
- How safe are nanomaterials. Science. 350, 388-389 (2015).">Valsami-Jones, E., Lynch, I. How safe are nanomaterials. Science. 350, 388-389 (2015).
- Official Journal of the European. , (2018).">EU Regulation Commission. Commission Regulation (EU) 2018/1881. Official Journal of the European. , (2018).
- Nanoparticles: Building Blocks for Nanotechnology. , 9042-9046 (2004).">Rotello, V. Nanoparticles: Building Blocks for Nanotechnology. , 9042-9046 (2004).
- http://www.acenano-project.eu/ (2020).">ACEnano Analytical and Characterisation Excellence. , Available from: http://www.acenano-project.eu/ (2020).
- Standardizing nanomaterials. ACS Nano. 10 (11), 9763-9764 (2016).">Mulvaney, P., Parak, W. J., Caruso, F., Weiss, P. S. Standardizing nanomaterials. ACS Nano. 10 (11), 9763-9764 (2016).
- Determining the thickness and completeness of the shell of polymer core-shell nanoparticles by X-ray photoelectron spectroscopy, secondary ion mass spectrometry, and transmission scanning electron microscopy. The Journal of Physical Chemistry C. 123 (49), 29765-29775 (2019).">Müller, A., et al. Determining the thickness and completeness of the shell of polymer core-shell nanoparticles by X-ray photoelectron spectroscopy, secondary ion mass spectrometry, and transmission scanning electron microscopy. The Journal of Physical Chemistry C. 123 (49), 29765-29775 (2019).
- Evaluation of Two Methods for Determining Shell Thicknesses of Core-Shell Nanoparticles by X-ray Photoelectron Spectroscopy. The Journal of Physical Chemistry C. 120 (39), 22730-22738 (2016).">Powell, C. J., Werner, W. S. M., Shard, A. G., Castner, D. G. Evaluation of Two Methods for Determining Shell Thicknesses of Core-Shell Nanoparticles by X-ray Photoelectron Spectroscopy. The Journal of Physical Chemistry C. 120 (39), 22730-22738 (2016).
- Emergence of colloidal quantum-dot light-emitting technologies. Nature Photonics. 7 (1), 13-23 (2013).">Shirasaki, Y., Supran, G. J., Bawendi, M. G., Bulović, V. Emergence of colloidal quantum-dot light-emitting technologies. Nature Photonics. 7 (1), 13-23 (2013).
- Titanium dioxide and zinc oxide nanoparticles in sunscreens: focus on their safety and effectiveness. Nanotechnology, Science and Applications. 4, 95-112 (2011).">Smijs, T. G., Pavel, S. Titanium dioxide and zinc oxide nanoparticles in sunscreens: focus on their safety and effectiveness. Nanotechnology, Science and Applications. 4, 95-112 (2011).
- Quantum dot bioconjugates for imaging, labelling and sensing. Nature Materials. 4 (6), 435-446 (2005).">Medintz, I. L., Uyeda, H. T., Goldman, E. R., Mattoussi, H. Quantum dot bioconjugates for imaging, labelling and sensing. Nature Materials. 4 (6), 435-446 (2005).
- Active targeting schemes for nanoparticle systems in cancer therapeutics. Advanced Drug Delivery Reviews. 60 (15), 1615-1626 (2008).">Byrne, J. D., Betancourt, T., Brannon-Peppas, L. Active targeting schemes for nanoparticle systems in cancer therapeutics. Advanced Drug Delivery Reviews. 60 (15), 1615-1626 (2008).
- Core@shell bimetallic nanoparticle synthesis via anion coordination. Nature Chemistry. 3 (6), 478-483 (2011).">Serpell, C. J., Cookson, J., Ozkaya, D., Beer, P. D. Core@shell bimetallic nanoparticle synthesis via anion coordination. Nature Chemistry. 3 (6), 478-483 (2011).
- Impact of storage conditions and storage time on silver nanoparticles' physicochemical properties and implications for their biological effects. RSC Advances. 5 (102), 84172-84185 (2015).">Izak-Nau, E., et al. Impact of storage conditions and storage time on silver nanoparticles' physicochemical properties and implications for their biological effects. RSC Advances. 5 (102), 84172-84185 (2015).
- Keeping Nanoparticles Fully Functional: Long-Term Storage and Alteration of Magnetite. ChemPlusChem. 79 (8), 1225-1233 (2014).">Widdrat, M., et al. Keeping Nanoparticles Fully Functional: Long-Term Storage and Alteration of Magnetite. ChemPlusChem. 79 (8), 1225-1233 (2014).
- Storage wars: how citrate-capped silver nanoparticle suspensions are affected by not-so-trivial decisions. Journal of Nanoparticle Research. 16 (4), 2339(2014).">Gorham, J. M., et al. Storage wars: how citrate-capped silver nanoparticle suspensions are affected by not-so-trivial decisions. Journal of Nanoparticle Research. 16 (4), 2339(2014).
- Effect of storage conditions on long-term stability of Ag nanoparticles formed via green synthesis. International Journal of Minerals, Metallurgy, and Materials. 24, (2017).">Velgosová, O., Elena, Č, Malek, J., Kavuličová, J. Effect of storage conditions on long-term stability of Ag nanoparticles formed via green synthesis. International Journal of Minerals, Metallurgy, and Materials. 24, (2017).
- Different storage conditions influence biocompatibility and physicochemical properties of iron oxide nanoparticles. International Journal of Molecular Sciences. 16 (5), (2015).">Zaloga, J., et al. Different storage conditions influence biocompatibility and physicochemical properties of iron oxide nanoparticles. International Journal of Molecular Sciences. 16 (5), (2015).
- Identification of nanoparticles and their localization in algal biofilm by 3D-imaging secondary ion mass spectrometry. Journal of Analytical Atomic Spectrometry. 34 (6), 1098-1108 (2019).">Benettoni, P., et al. Identification of nanoparticles and their localization in algal biofilm by 3D-imaging secondary ion mass spectrometry. Journal of Analytical Atomic Spectrometry. 34 (6), 1098-1108 (2019).
- Epitaxial deposition of silver ultra-fine nano-clusters on defect-free surfaces of HOPG-derived few-layer graphene in a UHV multi-chamber by in situ STM, ex situ XPS, and ab initio calculations. Nanoscale Research Letters. 7 (1), 173(2012).">Ndlovu, G. F., et al. Epitaxial deposition of silver ultra-fine nano-clusters on defect-free surfaces of HOPG-derived few-layer graphene in a UHV multi-chamber by in situ STM, ex situ XPS, and ab initio calculations. Nanoscale Research Letters. 7 (1), 173(2012).
- Interaction of l-cysteine with naked gold nanoparticles supported on HOPG: a high resolution XPS investigation. Nanoscale. 4 (24), 7727-7734 (2012).">Caprile, L., et al. Interaction of l-cysteine with naked gold nanoparticles supported on HOPG: a high resolution XPS investigation. Nanoscale. 4 (24), 7727-7734 (2012).
- Characterization of Nanoparticles. , 295-347 (2020).">Baer, D. R., et al. Chapter 4.2 - Preparation of nanoparticles for surface analysis. Characterization of Nanoparticles. , 295-347 (2020).
- Cryo-XPS - A new technique for the quantitative analysis of the structure of electric double layer at colloidal particles. Colloids and Surfaces A: Physicochemical and Engineering Aspects. 586, 124234(2020).">Škvarla, J., Kaňuchová, M., Shchukarev, A., Girová, A., Brezáni, I. Cryo-XPS - A new technique for the quantitative analysis of the structure of electric double layer at colloidal particles. Colloids and Surfaces A: Physicochemical and Engineering Aspects. 586, 124234(2020).
- Cryo-XPS: probing intact interfaces in nature and life. Surface and Interface Analysis. 49 (4), 349-356 (2017).">Shchukarev, A., Ramstedt, M. Cryo-XPS: probing intact interfaces in nature and life. Surface and Interface Analysis. 49 (4), 349-356 (2017).
- Intracellular uranium distribution: Comparison of cryogenic fixation versus chemical fixation methods for SIMS analysis. Microscopy Research and Technique. 81 (8), 855-864 (2018).">Suhard, D., et al. Intracellular uranium distribution: Comparison of cryogenic fixation versus chemical fixation methods for SIMS analysis. Microscopy Research and Technique. 81 (8), 855-864 (2018).
- Effects of cryogenic sample analysis on molecular depth profiles with TOF-secondary ion mass spectrometry. Analytical Chemistry. 82 (19), 8291-8299 (2010).">Piwowar, A. M., et al. Effects of cryogenic sample analysis on molecular depth profiles with TOF-secondary ion mass spectrometry. Analytical Chemistry. 82 (19), 8291-8299 (2010).
- Sample preparation for 3D SIMS chemical imaging of cells. Methods in Molecular Biology. 1203, Clifton, N.J. 9-19 (2015).">Winograd, N., Bloom, A. Sample preparation for 3D SIMS chemical imaging of cells. Methods in Molecular Biology. 1203, Clifton, N.J. 9-19 (2015).
- Characterization of Nanoparticles. , 481-509 (2020).">Schaepe, K., et al. Characterization of Nanoparticles. , 481-509 (2020).
- https://osha.europa.eu/en/emerging-risks/nanomaterials (2020).">Managing nanomaterials in the workplace. European Agency for Safety and Health at Work. , Available from: https://osha.europa.eu/en/emerging-risks/nanomaterials (2020).
- European Union Programme for Employment and Social Solidarity. , (2014).">European Union Programme for Employment and Social Solidarity. Working safely with manufactured nanomaterials: guidance for workers. European Union Programme for Employment and Social Solidarity. , (2014).
- https://legalinstruments.oecd.org/en/instruments/298 (2013).">Recommendation of the council on the safety testing and assessment of manufactured nanomaterials in C(2019)55/REV1. , Available from: https://legalinstruments.oecd.org/en/instruments/298 (2013).
- https://www.safenano.org/media/64896/Working_Safely_with_Nanomaterials_-_Release_200_-_Aug2012.pdf (2012).">Working safely with nanomaterials in research and development. NanoSafety Partnership Group. , Available from: https://www.safenano.org/media/64896/Working_Safely_with_Nanomaterials_-_Release_200_-_Aug2012.pdf (2012).
- Influence of different cleaning processes on the surface chemistry of gold nanoparticles. Biointerphases. 12 (3), 031003(2017).">La Spina, R., Spampinato, V., Gilliland, D., Ojea-Jimenez, I., Ceccone, G. Influence of different cleaning processes on the surface chemistry of gold nanoparticles. Biointerphases. 12 (3), 031003(2017).
- Versailles Project on Advanced Materials and Standards Interlaboratory Study on Measuring the Thickness and Chemistry of Nanoparticle Coatings Using XPS and LEIS. The Journal of Physical Chemistry C. 120 (42), 24070-24079 (2016).">Belsey, N. A., et al. Versailles Project on Advanced Materials and Standards Interlaboratory Study on Measuring the Thickness and Chemistry of Nanoparticle Coatings Using XPS and LEIS. The Journal of Physical Chemistry C. 120 (42), 24070-24079 (2016).
- Challenges in sample preparation for measuring nanoparticles size by scanning electron microscopy from suspensions, powder form and complex media. Powder Technology. 359, 226-237 (2020).">Ghomrasni, N. B., Chivas-Joly, C., Devoille, L., Hochepied, J. F., Feltin, N. Challenges in sample preparation for measuring nanoparticles size by scanning electron microscopy from suspensions, powder form and complex media. Powder Technology. 359, 226-237 (2020).
- Methodology for sample preparation and size measurement of commercial ZnO nanoparticles. Journal of Food and Drug Analysis. 26 (2), 628-636 (2018).">Lu, P. J., et al. Methodology for sample preparation and size measurement of commercial ZnO nanoparticles. Journal of Food and Drug Analysis. 26 (2), 628-636 (2018).
- Powder Sampling and Particle Size Determination. , Elsevier Science. 1-55 (2003).">Allen, T. Powder Sampling and Particle Size Determination. , Elsevier Science. 1-55 (2003).
- Particle Size Measurement. Powder Technology Series. , Springer. (1981).">Allen, T. Particle Size Measurement. Powder Technology Series. , Springer. (1981).
- Pharmaceutical Technology. 67-73, (2002).">Brittain, H. G. Pharmaceutical Technology. 67-73, (2002).
- ISO. , (2018).">ISO. Part 4: Reporting information related to the history, preparation, handling and mounting of nano-objects prior to surface analysis. ISO. , (2018).
- Principal component analysis. Analytical Methods. 6 (9), 2812-2831 (2014).">Bro, R., Smilde, A. K. Principal component analysis. Analytical Methods. 6 (9), 2812-2831 (2014).
- Multivariate Analysis of ToF-SIMS Data from Multicomponent Systems: The Why, When, and How. Biointerphases. 7 (1), 49(2012).">Graham, D. J., Castner, D. G. Multivariate Analysis of ToF-SIMS Data from Multicomponent Systems: The Why, When, and How. Biointerphases. 7 (1), 49(2012).
- Principal component analysis: a review and recent developments. Philosophical Transactions of the Royal Society A: Mathematical, Physical and Engineering Sciences. 374 (2065), 20150202(2016).">Jolliffe, I. T., Cadima, J. Principal component analysis: a review and recent developments. Philosophical Transactions of the Royal Society A: Mathematical, Physical and Engineering Sciences. 374 (2065), 20150202(2016).
- Principal component analysis. Nature Methods. 14 (7), 641-642 (2017).">Lever, J., Krzywinski, M., Altman, N. Principal component analysis. Nature Methods. 14 (7), 641-642 (2017).
- A tutorial on principal component analysis. , (2014).">Shiens, J. A tutorial on principal component analysis. , (2014).
- TOF-SIMS 3D biomolecular imaging of xenopus laevis oocytes using buckminsterfullerene (C60) primary ions. Analytical Chemistry. 79 (6), 2199-2206 (2007).">Fletcher, J. S., Lockyer, N. P., Vaidyanathan, S., Vickerman, J. C. TOF-SIMS 3D biomolecular imaging of xenopus laevis oocytes using buckminsterfullerene (C60) primary ions. Analytical Chemistry. 79 (6), 2199-2206 (2007).
- Three-dimensional mass spectral imaging of HeLa-M cells - preparation, data interpretation and visualisation. Rapid Communications in Mass Spectrometry: RCM. 25 (7), 925-932 (2011).">Fletcher, J. S., Rabbani, S., Henderson, A., Lockyer, N. P., Vickerman, J. C. Three-dimensional mass spectral imaging of HeLa-M cells - preparation, data interpretation and visualisation. Rapid Communications in Mass Spectrometry: RCM. 25 (7), 925-932 (2011).
- Fixation and Drying Protocols for the Preparation of Cell Samples for Time-of-Flight Secondary Ion Mass Spectrometry Analysis. Analytical Chemistry. 81, 7197-7205 (2009).">Malm, J., Giannaras, D., Riehle, M., Gadegaard, N., Sjövall, P. Fixation and Drying Protocols for the Preparation of Cell Samples for Time-of-Flight Secondary Ion Mass Spectrometry Analysis. Analytical Chemistry. 81, 7197-7205 (2009).
- Challenges of biological sample preparation for SIMS imaging of elements and molecules at subcellular resolution. Applied Surface Science. 255, 1273-1284 (2008).">Chandra, S. Challenges of biological sample preparation for SIMS imaging of elements and molecules at subcellular resolution. Applied Surface Science. 255, 1273-1284 (2008).
- Automatic spike correction using UNIFIT 2020. Surface and Interface Analysis. 51 (13), 1342-1350 (2019).">Hesse, R., Bundesmann, C., Denecke, R. Automatic spike correction using UNIFIT 2020. Surface and Interface Analysis. 51 (13), 1342-1350 (2019).
- Study of residue patterns of aqueous nanofluid droplets with different particle sizes and concentrations on different substrates. International Journal of Heat and Mass Transfer. 105, 230-236 (2017).">Lee, H. H., Fu, S. C., Tso, C. Y., Chao, C. Y. H. Study of residue patterns of aqueous nanofluid droplets with different particle sizes and concentrations on different substrates. International Journal of Heat and Mass Transfer. 105, 230-236 (2017).
- Effect of surface hydrophobicity on critical pinning concentration of nanoparticles to trigger the coffee ring formation during the evaporation process of sessile drops of nanofluids. Journal of Physical Chemistry. C. 119 (6), 3050-3059 (2015).">Lin, S. Y., Yang, K. C., Chen, L. J. Effect of surface hydrophobicity on critical pinning concentration of nanoparticles to trigger the coffee ring formation during the evaporation process of sessile drops of nanofluids. Journal of Physical Chemistry. C. 119 (6), 3050-3059 (2015).
- Overcoming the "Coffee-Stain" effect by compositional marangoni-flow-assisted drop-drying. Journal of Physical Chemistry. B. 116 (22), 6536-6542 (2012).">Majumder, M., et al. Overcoming the "Coffee-Stain" effect by compositional marangoni-flow-assisted drop-drying. Journal of Physical Chemistry. B. 116 (22), 6536-6542 (2012).
- From enhancement to elimination of dual-ring pattern of nanoparticles from sessile droplets by heating the substrate. Applied Thermal Engineering. 115, 1418-1423 (2017).">Zhong, X., Wu, C. L., Duan, F. From enhancement to elimination of dual-ring pattern of nanoparticles from sessile droplets by heating the substrate. Applied Thermal Engineering. 115, 1418-1423 (2017).
Reprints and Permissions
Request permission to reuse the text or figures of this JoVE article
Request Permission