This protocol demonstrates the study of the pathophysiologic effects of cigarette smoke (CS) with a whole-body inhalation (WBI) exposure system (WBIS) built in-house. This system can expose animals to CS under controlled repeatable conditions for research of CS-mediated effects on lung emphysema and hematopoiesis.
Method Article
Cigarette Smoke Exposure in Mice using a Whole-Body Inhalation System
In This Article
Summary
Abstract
Close to 14% of adults in the United States were reported to smoke cigarettes in 2018. The effects of cigarette smoke (CS) on lungs and cardiovascular diseases have been widely studied, however, the impact of CS in other tissues and organs such as blood and bone marrow remain incompletely defined. Finding the appropriate system to study the effects of CS in rodents can be prohibitively expensive and require the purchase of commercially available systems. Thus, we set out to build an affordable, reliable, and versatile system to study the pathologic effects of CS in mice. This whole-body inhalation exposure system (WBIS) set-up mimics the breathing and puffing of cigarettes by alternating exposure to CS and clean air. Here we show that this do-it-yourself (DIY) system induces airway inflammation and lung emphysema in mice after 4-months of cigarette smoke exposure. The effects of whole-body inhalation (WBI) of CS on hematopoietic stem and progenitor cells (HSPCs) in the bone marrow using this apparatus are also shown.
Introduction
Cigarette smoking remains one of the major causes of preventable diseases in the US despite the steady decline in the number of cigarette-smoking adults in the past 50–60 years1. It is widely known that smoking is linked to multiple diseases of the lungs and blood including chronic obstructive pulmonary disease (COPD), a group of diseases that includes emphysema and chronic bronchitis2,3,4. According to the Center for Disease Control (CDC), in 2014, COPD was the third leading cause of death in the United States with over 15 million Americans suffering from this disease5.
CS has also recently been associated with a higher risk of developing clonal hematopoiesis (CH)6,7, a condition in which a single hematopoietic stem cell disproportionately produces a large percentage of a person’s peripheral blood. This finding indicates a potential connection between smoking and bone marrow function. Given the widespread and highly significant health implications of CS and given that murine models of diseases are a cornerstone of progress in biomedical research, it is useful to develop efficient and affordable systems to model CS in mice.
Here, we provide a step-by-step guide for building an affordable system for treating and studying the in vivo effects of CS on lung emphysema and bone marrow homeostasis. The assembly of this equipment does not require the user to have specialized knowledge and thus allows for DIY assembly.
Protocol
All the animals involved in the experiments and the development of this technique have been under our animal use protocol approved by the Institutional Animal Care and Use Committee (IACUC) and under Baylor College of Medicine and MD Anderson institutions that are accredited by the Association for Assessment and Accreditation of Laboratory Animal Care (AAALAC).
1. Building the apparatus
- Assembling the air compressor with the valve system.
- Connect the flowmeters (two 15 L/min with Y bar and 2 power takeoffs) to the miniature pressure regulator using a 1/8 inch threaded male adapter nipple fitting. Make sure to use the thread seal tape in all threaded ends.
- Connect the assembled pressure regulator with the flowmeter to the medical air compressor instrument using the following: a 1/8 inch hex nipple on the compressor air outlet, a 1/8 inch threaded coupling fitting, and a 1/8 inch threaded male adapter nipple fitting that connects to the pressure regulator.
- Install the oxygen swivel barbed connector on each (4) flowmeter.
- Install a male adaptor on the air compressor’s top air outlet (part included with the medical air compressor instrument).
- Assembling exposure chambers (make 4 units)
- Cut a 3/4 inch chlorinated polyvinyl chloride (CPVC) pipe into eight 4 inch segments.
- Insert each segment to one 3/4 inch 90° elbow CPVC fitting and attach the fitting side of the elbow to a 3/4 inch diameter CPVC male adapter. There should be eight CPVC segments, each attached to one CPVC elbow fitting and one CPVC male adapter.
- Drill two holes (1 ¼ inch diameter) on opposite sides most distant from each other of an 8.5 L airtight container (11.25 x 7.75 x 6 inch) with a lid (see Figure 1 exposure chamber). The positioning of the holes is to be centered top to bottom and left to right.
- Insert the threaded sides of the CPVC male adapter assembled before into each hole in the containers.
- From the inside of the container, attach a 3/4 inch CPVC cap on the other side (Chamber smoke input) and a 3/4 inch CPVC Drip irrigation female adapter on one side (Chamber smoke output).
- Drill five 3 mm holes on the top of the CPVC cap of the chamber smoke output in a quincunx (shower head) pattern. This will allow the cigarette smoke to enter the chamber with higher velocity and ensures that it spreads evenly inside the chamber in all directions.
- Assembling cigarette chambers (makes up to 4 murine exposure units)
- Take a one-hole rubber stopper (manufacturer size 8.5) and insert a 1/4 inch barbed Y connector on the wider side and a straight barbed fitting (8 mm opening) on the narrower side. The cigarette will be placed here during the smoking procedure (cigarette pedestal).
- Connect one end of a 12 inch long medical grade vinyl pipe to one of the barbed connectors on the Y connector attached to the rubber stopper and the other end to a 1/4 inch fitting and insert the opposite side of this fitting on a one-hole rubber stopper (manufacturer size 1).
- On another rubber stopper (manufacturer size 8.5), insert one 1/4 inch straight tubing connector on the wider side of the stopper and connect the outer end of the fitting to a 7 ft medical grade vinyl pipe.
- Connect the two rubber stopper structures assembled before in steps 1.3.1–1.3.3 to an 8 inch x 1.75 inch glass cylinder from a laboratory glass drain tube.
- Valve control system
- The system is controlled by a rhythmic opening and closing of solenoid valves that simulate inhalation (puffing) of cigarette smoke and clean air. The system that controls the solenoid valves was commercially designed (see Table of Materials).
- Assembling all components together (see Figure 1)
- Mount four solenoid valves to the sides of the valve control system using 1 inch fasteners.
- Connect the solenoid valves to the valve control system following the manufacturer’s instructions.
- Attach a 10–32 (M) threaded straight connector to the exhaust (“EXH”) connection on the solenoid valve and a threaded port adaptor on the “IN” and “OUT” connections of the same solenoid valve.
- Connect the flowmeter attached to the compressor to the solenoid valve through the “OUT” connection using a 7 ft medical grade vinyl tubing.
- Connect the 7 ft vinyl tube assembled with the rubber stopper in step 1.3.3. on the “IN” connector on the solenoid valve.
- Insert the small rubber stopper of the cigarette chamber on the chamber smoke input.
- Connect the solenoid valve to the second connection of the barbed Y connector on the cigarette pedestal assembled in step 1.3.1.
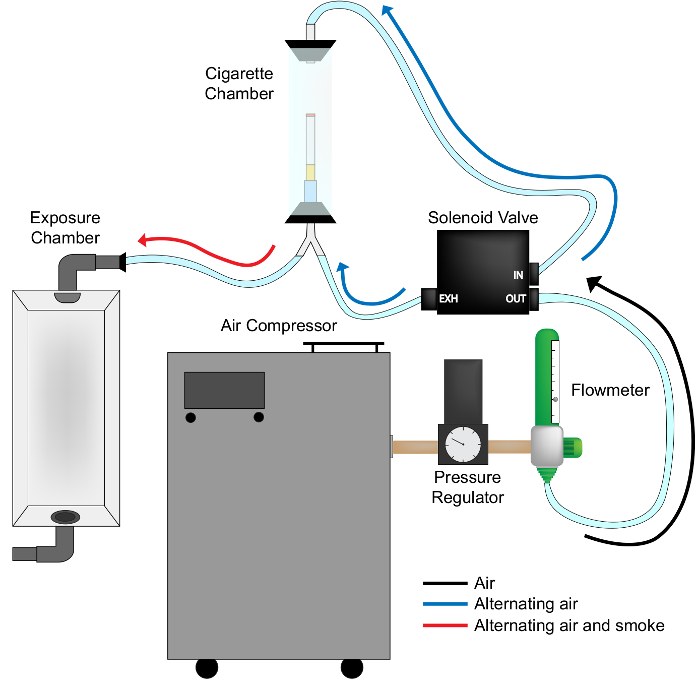
Figure 1: Schematic of the connections of our WBIS for exposure to CS. This figure demonstrates how all components are assembled to form a working apparatus. The figure shows only one assembled smoking chamber of the four that the machine is capable of operating. Please click here to view a larger version of this figure.
2. Cigarette smoke exposure
CAUTION: Avoid second- and third-hand exposure to cigarette smoke. Cigarette and exposure chambers should be used within a Class II Type B2 Laminar Flow Biological Safety Cabinets. Proper PPE should be worn while conducting the smoke exposure experiments (i.e., masks, gloves, hairnet, gown).
- Setting pressure and airflow
- Once all the components are assembled as shown in Figure 1, turn on the air compressor and wait for the safety alarm to turn off on its own.
- Adjust the pressure of the air compressor to 40–50 psi by turning the knob on the pressure regulator.
- Adjust the airflow from the air compressor to 5 L using the flowmeter.
- Turn on the valve controller.
- Adjust the digital timer on the valve controller to the PULSE-C (shown in the display as “Pu-c”) operating mode by pressing the SET/LOCK key while holding down the UP key at the first digit of the timer. Then, press the UP key until the Pu-c mode is reached. Press the RESET key to set the displayed operating mode (i.e., Pu-C) as the working mode.
- Press the SET/LOCK to change timer 1 (shown in the display as “T1”).
- Press the UP or DOWN keys to set T1 to 20 s.
- Press the SET/LOCK to change timer 2 (shown in the display as “T2”).
- Press the UP or DOWN keys to set T2 to 3 s.
NOTE: Steps 2.1.5 through 2.1.9 are tailored to be used with the specific timer (see Table of Materials). For further instructions on other uses for this product, see its corresponding user manual.
- Cigarette smoke treatment
NOTE: This system allows for the use of 1–4 murine exposure chambers at the same time.- Turn on the air compressor and wait for the safety alarm to turn off on its own.
- Turn on the valve controller.
- Transfer 5 mice into each of the four exposure chambers with airtight removable lids with a volume of 8.5 L. Place the four exposure chambers with mice within a Class II Type B2 Laminar Flow Biological Safety Cabinets.
- Inside the laminar flow biological safety cabinet, light up a cigarette and insert the cigarette inside of the cigarette chamber. Use commercially available cigarettes which contain 15 mg/cig tar and 1.1 mg/cig nicotine8 as compared to Kentucky 3RF4 research cigarettes (9.5 mg/cig tar and 0.73 mg/cig nicotine)9.
- Switch ON the valves on the valve controller that correspond to the chambers that are currently in use. The exposure is divided into 2 phases: (T1) clean air is pumped into the exposure chamber for 20 s and (T2) airflow causes the cigarette to burn and smoke from the cigarette chamber is pumped into the exposure chamber for 3 s. Allow the cigarette to burn out completely until it reaches the filter.
- Adjust the timer settings to perform an average of ~10 puffs/cigarette over an ~4-min period. Note that the timer and system are easily customizable for enhancing or lowering CS dosing regimen according to the research needs of the investigators.
- Remove the cigarette filter and dispose of it by placing the cigarette butt in a glass beaker with water to extinguish the flame and dampen the odor.
- Make sure the cigarette chamber is closed again and without a cigarette. Let the machine pump clean air for 10 min. It is of utmost importance to maintain constant monitoring of the vertebrate animals that are exposed to CS. This exposing regimen is optimized for 5 female mice over 9-weeks old per exposure chamber.
- Repeat steps 2.3.4 through 2.3.7 three times for a total of 4 cigarettes per chamber a day. This procedure is repeated 5 days a week for as long as the researcher needs for their experiments.
- Remove the mice from the exposure chambers back into their corresponding cages.
- Turn off the valve controller and the air compressor.
- Remove the exposure and cigarette chambers and wash with water and soap to remove any residue of tar.
- Let the chambers fully dry before using them again.
Results
One of the main hallmarks of CS exposure is emphysema that is characterized by the damage and destruction of air sacs (alveoli) in the lung. Thus, initial experiments focused on the DIY system’s ability to provoke emphysematous changes in the lungs of female mice upon repeated whole-body exposure to CS. The CS dosing regimen was chosen based on our prior publications in which we utilized the DIY system described here to treat mice with CS and study the molecular pathophysiology of emphysema10,11,12,13,14,15,16. Specifically, mice were exposed whole-body to the smoke of four commercial cigarettes with filter daily, with smoke-free intervals of 10 min in between each cigarette, five days a week for a duration of 4 months10,11,12,13,14,15,16.
Hematoxylin and eosin (H&E)-stained lung histology showed the destruction of the alveoli in mice exposed to CS in comparison to Air treated mice (Figure 2A). In agreement, histomorphometric analysis of lung sections in a blinded fashion showed that the mean linear intercept (MLI) was significantly higher in mice exposed to CS as compared to Air controls (Figure 2B). As expected, WBIS to CS provokes a drop in body weight (Figure 2C). Consistent with the above observations CS-exposed mice also showed enhanced airway infiltration of immune cells as well as induction of Matrix metalloproteases 9 and 12 (Mmp9 and Mmp12) gene expression, which are responsible for tissue damage (Figure 2D,E)17. Cotinine, a metabolite of nicotine and a biomarker for CS exposure, was detected to be significantly elevated in the serum of mice exposed to 4 months of CS but was undetectable in Air-exposed mice (Figure 2F).
There is an increasing appreciation of the multifaceted impact of CS exposure on the body’s cells and tissues. A prior study showed that WBI exposure of mice to CS with a regimen of 6 h/day, 5 days/week for 9 months with 3R4F cigarettes led to an alteration in the hematopoietic stem cell niche18. Therefore, we tested the ability of this DIY system to alter bone marrow homeostasis utilizing our pre-established CS dosing regimen10,11,12,13,14,15,16. After exposure, we analyzed BM populations using flow cytometry (Figure 3A). In accordance with the expectations, treatment of mice with CS on this DIY system resulted in an alteration in bone marrow (BM) populations. Specifically, flow cytometric analysis showed a significant increase in hematopoietic stem and progenitor (HSPC) populations after 4 months of CS exposure as compared to Air controls (Figure 3B). Extending these observations, whole-body exposure to CS of mice utilizing a commercially available system (see Table of Materials) also showed an alteration in HSPC populations (Figure 3C). The dosing regimen and duration of CS exposure used in the commercial system and the prior publication on CS and hematopoiesis18 were quite different than this DIY system suggesting that bone marrow homeostasis is exquisitely sensitive to a wide range of CS dosing and treatment regimens (Figure 3C). Overall, this data highlights that this DIY system is an affordable option that can be used to expose mice to CS under controlled conditions to reliably study its effects in a range of cells and tissues.
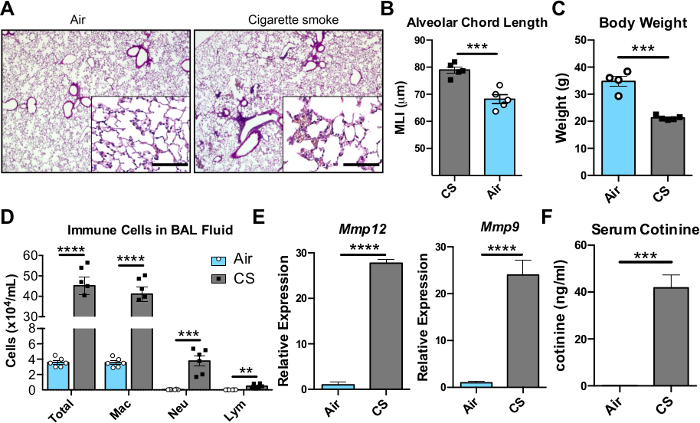
Figure 2: CS-mediated induction of airway inflammation and lung emphysematous changes of mice. (A) H&E stained lung sections from WT C57BL/6 mice exposed to Air or CS for 4 months. 4x magnification; inset 20x magnification. Scale bar 200 μM. (B) Mean linear intercept (MLI) as a measure of interalveolar wall distance was measured using unbiased histomorphometry from mice treated by Air or CS. (C) Mice weights after 4 months of Air or CS exposure. (D) Total and differential cell counts from bronchoalveolar lavage (BAL) fluid of control (Air) versus CS treated mice. Total leukocytes (Total), macrophages (Mac), neutrophils (Neu), and lymphocytes (Lym). Relative expression of (E) Mmp9 and (F) Mmp12 mRNA quantified by real-time PCR from BAL fluid of Air or CS exposed mice and normalized to Gapdh expression. n = 4–5 mice/group. (G) Serum levels of cotinine in mice exposed to Air or CS were measured by ELISA 24 h after the last CS treatment; n = 7–8 mice/group. Statistical comparisons were done using (B,C,D,E) Unpaired t-test and (F) Welch’s t-test. Data shown Mean ± SEM. **p < 0.01, ***p < 0.001, ****p < 0.0001. Please click here to view a larger version of this figure.

Figure 3: In line with expectations this DIY system can be used to study CS-mediated effects in the bone marrow of mice. (A) Gating strategies to identify HSPCs and HSCs by flow cytometry. Lineage markers include: Gr1, Mac1, B220, CD4, CD8, and Ter119. (B) Percentage of HSPC and HSCs in the whole bone marrow after CS exposure using this DIY system with the same 4-month regimen. (C) Percentage of HSPC and HSCs in the whole bone marrow after CS exposure using the commercially available system with the following exposure procedure: 24 3RF4 research cigarettes daily, 12 puffs/cigarette, 5 days a week for 4.5 weeks duration. (B–C) Mann-Whitney test; n = 5 mice/group. Data shown as Mean ± SEM. *p < 0.05. Please click here to view a larger version of this figure.
Discussion
Here we provide the information required for the construction of an apparatus for WBIS of mice to CS. After installation of the system, it is critically important that investigators calibrate the system based on the delivered dose of nicotine or cotinine in animals. The apparatus contains a timer and pressure gauges that can be used to adjust cigarette puff volume, puff frequency, combined smoke exposure period, and rest intervals that animals receive between each cigarette. Furthermore, the actual number of cigarettes administered daily may vary depending on tar and nicotine content. Finally, it is imperative that any component exposed to cigarette smoke be cleaned on a regular basis to ensure proper smoke circulation and consistent smoke exposure of the animals.
There are at least half a dozen commercial systems and protocols available for the treatment of mice with CS and air toxicants. However, the majority of equipment used for this purpose require commercial vendors or in-depth knowledge of electronics and/or electrical engineering for assembly. Some of those systems employ WBI regimens while others incorporate nose-only treatments, but these systems can cost up to $100,000 making them prohibitively expensive for most laboratories.
The advantage of this DIY system is the inherent simplicity in the manufacture, low cost (~$6,000), and versatility. Furthermore, the components necessary for the construction of this DIY apparatus are readily available from commercial retailers and supply chains. We acknowledge a limitation of the exposure protocol and equipment is the lack of dosimetry equipment to measure cigarette smoke constituents delivered into the mouse exposure chambers. However, the design of this system works in a controlled fashion and we showed that the levels of serum cotinine in this chosen smoking regimen are comparable to other murine models of CS-induced emphysema20,21. Furthermore, this method has been shown to have applications beyond monitoring the effects of CS in the lungs and BM. Our group used this system to study how cigarette smoke affects the intestinal tissue15. We have also recently adapted this system to study the deleterious effects of exposure to electronic cigarettes on the lungs22.
In summary, this apparatus represents an affordable and easy-to-build exposure system to study the vast array of detrimental effects of cigarette smoking.
Disclosures
The authors have nothing to disclose.
Acknowledgements
AR, XH, and PE were supported by NIH grant R01HL140398 and a Gilson Longenbaugh Foundation grant. DEMM and KK were supported by the NIH grants R01HL136333 and R01HL134880 (KYK), and a grant from the Helis Medical Research Foundation. DEMM is also supported by the Howard Hughes Medical Institute (HHMI) Gilliam Fellowship for Advanced Study. PE is also supported by Training in Precision Environmental Health Sciences NIEHS T32 ES027801 Fellowship Program. JC and MF are supported by Tobacco Research Funds from the Department of Epigenetics and Molecular Carcinogenesis and by the Center for Epigenetics (Scholar Award to MF) at MD Anderson. FK and YZ are supported by NIH grants R01 ES029442-01 and R01 AI135803-01 as well as VA Merit grant CX000104. This project was supported by the Cytometry and Cell Sorting Core at Baylor College of Medicine with funding from the CPRIT Core Facility Support Award (CPRIT-RP180672), the NIH (CA125123 and RR024574), and the assistance of Joel M. Sederstrom.
Materials
| Name | Company | Catalog Number | Comments |
|---|---|---|---|
| 1 in fastener | Lowes | 756990 | |
| 1/4 in Barbed Y connector | VWR | 89093-282 | |
| 1/4 in straight tubing connector | VWR | 62866-378 | |
| 1/8 hex nipple | Lowes | 877221 | |
| 1/8 in threaded coupling fitting | Lowes | 877208 | |
| 1/8 in threaded male adapter nipple fitting | Lowes | 877243 | |
| 10/32 (M) threaded straight connector | Bimba | EB60 | |
| 3/4 in 90-degree elbow CPVC fitting | Lowes | 22643 | |
| 3/4 in chlorinated polyvinyl chloride (CPVC) pipe | Lowes | 23814 | |
| 3/4 in CPVC cap | Lowes | 23773 | |
| 3/4 in CPVC Drip irrigation female adapter | Lowes | 194629 | |
| 3/4 in diameter CPVC male adapter | Lowes | 23766 | |
| 8.5 L airtight container with lid (11.25in x 7.75in x 6 in) | Komax | N/A | Listed as "Komax Biokips Large Bread Box | (280-oz) Large Storage Container" |
| Glass drain tube (1.75 in diameter x 8 in length) | KIMAX | 6500 | |
| Isonic Solenoid Valves | Bimba | V2A02-AW1 | |
| Marlboro Red 100's | Marlboro | N/A | |
| Oxygen swivel barbed connector | Global Medical Solutions | RES002 | |
| Panasonic Timer LT4H-W | Panasonic | LT4HW | Item was built-in the valve controller by Shepherd Controls & Associates |
| Pressure regulator | Allied Electronics and Automation | 70600552 | Also listed as "Norgren R07-100-RGKA" |
| Rubber stopper # 1 (one hole) | VWR | 59581-163 | |
| Rubber stopper # 8.5 (one hole) | VWR | 59581-389 | |
| Scireq inExpose system | Scireq and Emka Technologies | N/A | Commercial system used for comparison with our DIY WBIS |
| Straight barbed fitting (8mm opening) | VWR | 10028-872 | |
| Thread Sealant tape | Lowes | 1184243 | |
| Threaded port adaptor | Bimba | P1SA1 | |
| Timeter Aridyne 2000 Medical Air Compressor | MFI Medical | AHC-TE20 | |
| Timeter flowmeter | Allied Healthcare Products | 15006-03YP2 | Also listed as "Puritan Air Meter" |
| Valve Control system | Shepherd Controls and Associates | N/A | Company custom designed the valve control system for this model. |
| Vinyl pipes | Vitality Medical | RES3007 |
References
- Current Cigarette Smoking Among Adults in the United States. Center for Disease Control and Prevention. , Available from: https://www.cdc.gov/tobacco/data_statistics/fact_sheets/adult_data/cig_smoking/index.htm (2018).
- Salvi, S. Tobacco smoking and evironmental risk factors for chronic obstructive pulmonary disease. Clinics in Chest Medicine. 35, 17-27 (2014).
- Sunyer, J., et al. Longitudinal relation between smoking and white blood cells. American Journal of Epidemiology. 144, 734-741 (1996).
- Freedman, D. S., Flanders, D., Barboriak, J. J., Malarcher, A. M., Gates, L. Cigarette smoking and leukocyte subpopulations in men. Annals of Epidemiology. 6, 299-306 (1996).
- Chronic Obstructive Pulmonary Disease (COPD). Center for Disease Control and Prevention. , Available from: https://www.cdc.gov/copd/basics-about.html (2019).
- Genovese, G., et al. Clonal hematopoiesis and blood-cancer risk inferred from blood DNA sequence. New England Journal of Medicine. , (2014).
- Steensma, D. P. Clinical implications of clonal hematopoiesis. Mayo Clinic Proceedings. 93, 1122-1130 (2018).
- Tobacco. Federal Trade Comission. , Available at: . Accessed: 4th (2020).
- 3R4F Cigarettes. University of Kentucky - College of Agriculture Food and Environment. , Available from: https://ctrp.uky.edu/products/gallery/Reference Cigarettes/detail/936 (2020).
- Shan, M., et al. Cigarette smoke induction of osteopontin (SPP1) mediates T H 17 inflammation in human and experimental emphysema. Science Translational Medicine. 4, 1-10 (2012).
- Yuan, X., et al. Activation of C3a receptor is required in cigarette smoke-mediated emphysema. Nature Mucosal Immunology. 8, 874-885 (2014).
- Yuan, X., et al. Cigarette smoke - induced reduction of C1q promotes emphysema. JCI Insight. 4, 1-17 (2019).
- Shan, M., et al. Agonistic induction of PPAR g reverses cigarette smoke - induced emphysema Find the latest version: Agonistic induction of PPAR γ reverses cigarette smoke - induced emphysema. Journal of Clinical Investigation. 124, 1371-1381 (2014).
- Hong, M. J., et al. Protective role of gd T cells in cigarette smoke and influenza infection. Nature Mucosal Immunology. 11, 834-908 (2018).
- Kim, M., et al. Cigarette smoke induces intestinal inflammation via a Th17 cell-neutrophil axis. Frontiers in Immunology. 10, 1-11 (2019).
- Lu, W., et al. The microRNA miR-22 inhibits the histone deacetylase HDAC4 to promote T H 17 cell - dependent emphysema. Nature Immunology. 16, 1185-1194 (2015).
- Hendrix, A. Y., Kheradmand, F. The Role of Matrix Metalloproteinases in Development, Repair, and Destruction of the Lungs. Progress in Molecular Biology and Translational Science. 148, Elsevier Inc. (2017).
- Siggins, R. W., Hossain, F., Rehman, T., Melvan, J. N., Welsh, D. A. Cigarette smoke alters the hematopoietic stem cell niche. Med Sci. 2, 37-50 (2014).
- Kheradmand, F., You, R., Gu, B. H., Corry, D. B. Cigarette smoke and DNA cleavage promote lung inflammation and emphysema. Transactions of the American Clinical and Climatological Association. 128, 222-233 (2017).
- Ha, M. A., et al. Menthol attenuates respiratory irritation and elevates blood cotinine in cigarette smoke exposed mice. PLoS ONE. , 1-16 (2015).
- Moreno-Gonzalez, I., Estrada, L. D., Sanchez-Mejias, E., Soto, C. Smoking exacerbates amyloid pathology in a mouse model of Alzheimer's disease. Nature Communications. 4, 1-10 (2013).
- Madison, M. C., et al. Electronic cigarettes disrupt lung lipid homeostasis and innate immunity independent of nicotine. Journal of Clinical Investigation. 129, 4290-4304 (2019).
Reprints and Permissions
