We describe a systematic workflow to investigate TGF-β signaling and TGF-β-induced EMT by studying the protein and gene expression involved in this signaling pathway. The methods include Western blotting, a luciferase reporter assay, qPCR, and immunofluorescence staining.
Method Article
Studying TGF-β Signaling and TGF-β-induced Epithelial-to-mesenchymal Transition in Breast Cancer and Normal Cells
In This Article
Erratum Notice
Important: There has been an erratum issued for this article. View Erratum Notice
Summary
Abstract
Transforming growth factor-β (TGF-β) is a secreted multifunctional factor that plays a key role in intercellular communication. Perturbations of TGF-β signaling can lead to breast cancer. TGF-β elicits its effects on proliferation and differentiation via specific cell surface TGF-β type I and type II receptors (i.e., TβRI and TβRII) that contain an intrinsic serine/threonine kinase domain. Upon TGF-β-induced heteromeric complex formation, activated TβRI elicits intracellular signaling by phosphorylating SMAD2 and SMAD3. These activated SMADs form heteromeric complexes with SMAD4 to regulate specific target genes, including plasminogen activation inhibitor 1 (PAI-1, encoded by the SERPINE1 gene). The induction of epithelial-to-mesenchymal transition (EMT) allows epithelial cancer cells at the primary site or during colonization at distant sites to gain an invasive phenotype and drive tumor progression. TGF-β acts as a potent inducer of breast cancer invasion by driving EMT. Here, we describe systematic methods to investigate TGF-β signaling and EMT responses using premalignant human MCF10A-RAS (M2) cells and mouse NMuMG epithelial cells as examples. We describe methods to determine TGF-β-induced SMAD2 phosphorylation by Western blotting, SMAD3/SMAD4-dependent transcriptional activity using luciferase reporter activity and SERPINE1 target gene expression by quantitative real-time-polymerase chain reaction (qRT-PCR). In addition, methods are described to examine TGF-β-induced EMT by measuring changes in morphology, epithelial and mesenchymal marker expression, filamentous actin staining and immunofluorescence staining of E-cadherin. Two selective small molecule TGF-β receptor kinase inhibitors, GW788388 and SB431542, were used to block TGF-β-induced SMAD2 phosphorylation, target genes and changes in EMT marker expression. Moreover, we describe the transdifferentiation of mesenchymal breast Py2T murine epithelial tumor cells into adipocytes. Methods to examine TGF-β-induced signaling and EMT in breast cancer may contribute to new therapeutic approaches for breast cancer.
Introduction
The cytokine transforming growth factor-β (TGF-β) is the prototype of a large group of structurally and functionally related regulatory polypeptides including TGF-βs (i.e., TGF-β1, -β2 and -β3), bone morphogenic proteins (BMPs) and activins1,2. These cytokines all play important roles in embryonic development and in maintaining tissue and organ homeostasis3. The misregulation of TGF-β can lead to a large variety of diseases, including cancer4,5. TGF-β plays a complex, dual role in cancer progression: in normal and premalignant epithelial cells, TGF-β behaves as a tumor-suppressor by inhibiting proliferation and inducing apoptosis6,7; however, at the late stage of tumor progression, when cytostatic responses are blocked by the activation of oncogenes or loss of tumor suppressor genes, TGF-β acts as a tumor enhancer by promoting epithelial-to-mesenchymal transition (EMT) in cancer cells, thereby enabling cancer cell invasion and metastasis, acting on cells in the tumor microenvironment, and stimulating angiogenesis and immune evasion8,9,10.
TGF-β is secreted as an inactive precursor molecule containing the mature carboxy-terminal TGF-β and latency-associated peptide (LAP)11. This small complex can be covalently bound by latent TGF-β-binding protein (LTBP)12. The release of mature TGF-β can be mediated by the action of specific proteases that cleave LAP or by the mechanical pulling of LAP in an integrin-dependent process13,14. In addition to LTBP, Glycoprotein A repetitions predominant (GARP) is highly expressed on the surface of regulatory T cells (Tregs) and plays a similar role as LTBP in regulating the activation of TGF-β15,16. GARP directly binds to latent TGF-β through disulfide linkage and noncovalent association. The activation of TGF-β from the GARP/TGF-β complex requires integrins17. Mature TGF-β binds to TGF-β serine/threonine kinase receptors, i.e., TGF-β type I (TβRI) and TGF-β type II (TβRII) receptors18 to initiate signaling. The binding of TGF-β to TβRII promotes the recruitment of TβRI and the formation of a heteromeric complex. Subsequently, TβRI is phosphorylated by TβRII kinase on serine and threonine residues in a short glycine- and serine-rich (GS) motif, resulting in its activation19,20. Upon activation, activated TβRI recruits and phosphorylates its substrates: the two receptor-specific SMADs (R-SMADs) that include SMAD2 and SMAD3 (Figure 1). R-SMADs share an similar overall structure with two so called Mad homology domains, MH1 and MH2, that are separated by a proline-rich linker region (Figure 2). The DNA binding motif within the MH1 domain of SMAD3 is not conserved between SMAD2 and SMAD3, and SMAD2 cannot directly bind DNA because of two insertions in its MH1 domain (exon 3 and L1). SMAD2 and SMAD3 can be activated by the phosphorylation of the SSXS motif in their C-termini (Figure 2). Phosphorylated SMAD2/3 forms heteromeric complexes with a common SMAD mediator, SMAD4, which translocates into the nucleus to modulate the transcription of target genes (Figure 1)7,21. This canonical SMAD signaling pathway is precisely regulated and generates specific cellular and tissue responses such as the regulation of cell fate and tumor cell metastasis and invasion22. In addition to TGF-β-SMAD signaling, non-SMAD signaling pathways can also be directly activated by receptors to regulate downstream cellular responses23.
During tumor progression, the activation of TGF-β-induced SMAD-dependent and SMAD-independent pathways are needed for the induction of EMT. EMT is a reversible process in which tumor cells dedifferentiate from an epithelial phenotype, which is associated with the loss of cell-cell contacts and decreased apical–basal polarity, to a mesenchymal phenotype with enhanced motility and invasion ability24. EMT is characterized by increased expression of mesenchymal marker proteins, including N-cadherin, vimentin, Zeb2 and Snail1/2, and the concomitant downregulation of epithelial markers, such as E-cadherin and β-catenin (Figure 3)25. However, the transition from an epithelial to a mesenchymal state is often incomplete, and cells gain mixed epithelial and mesenchymal (E/M) characteristics. A recent paper by the International EMT association proposed to describe the process of cells undergoing intermediate E/M phenotypic states as epithelial–mesenchymal plasticity (EMP)26. This plasticity refers to partial EMT, a hybrid E/M status, a metastable EMT state, an EMT continuum and an EMT spectrum26. During EMT, tumor cells gain cancer stem cell (CSC) properties and become more resistant to detachment-induced apoptosis27. While EMT is responsible for the acquisition of an invasive phenotype in primary tumor cells and drives cancer progression, in contrast, mesenchymal-epithelial transition (MET) has been shown to play an important role in the outgrowth of disseminated tumor cells at distant metastatic sites28,29. A recent study demonstrated that EMT-derived breast cancer cells can be transdifferentiated into adipocytes, which might offer an opportunity to inhibit metastasis and overcome therapy resistance in tumor cells and relapsed cancer30. Due to the important role of TGF-β signaling in the activation of EMT in breast carcinogenesis, we present detailed protocols for Western blotting, a luciferase transcriptional reporter assay, quantitative real-time-polymerase chain reaction (qRT-PCR), and immunofluorescence for the investigation of TGF-β signaling, TGF-β-induced EMT, and the transdifferentiation of EMT-derived murine breast epithelial tumor cells into adipocytes. These techniques are the most commonly used analytical tools in the cell biology field. qRT-PCR is used to detect, characterize and quantify mRNA expression levels in a quantitative manner. Compared to quantitative PCR (qPCR), an alternative technique, the reverse transcription (RT)-PCR can be used to determine mRNA expression in a semi-quantitative manner31,32. Western blotting is used to examine specific protein levels in a given cell lysate sample with advantages of sensitivity and specificity, in a semi-quantitative manner. Thus, we present a systematic workflow to analyze changes from gene expression to protein expression to help investigate TGF-β signaling that can also be applied to other signaling pathways.
Protocol
1. Analysis of TGF-β-induced SMAD2 phosphorylation using Western blotting
NOTE: Premalignant human breast MCF10A-Ras cells were used as an example to investigate TGF-β signaling responses33. In principle, the methods described below are also applicable to other TGF-β-responsive cell lines.
- Culture the breast epithelial cell line MCF10A-Ras at 37 °C in Dulbecco’s modified Eagle’s medium (DMEM)/F12 containing L-glutamine with 5% horse serum, 20 ng/mL epidermal growth factor (EGF), 10 mg/mL insulin, 100 ng/mL cholera enterotoxin, 0.5 mg/mL hydrocortisone, and 1:100 penicillin-streptomycin (Pen-Strep).
- Trypsinize MCF10A-Ras cells with 1 mL of 0.25% trypsin-EDTA for 1 minute and count viable cells using a cell counter.
- Seed cells into 6-well plates at a density of 5×10⁵ cells/well.
- After overnight growth, treat cells with either TGF-β (5 ng/mL) or ligand buffer (4 mM HCl, 0.1% fatty-acid-free bovine serum albumin (BSA)) for 1 hour, and then remove culture medium and gently wash the cells twice with 1 mL of phosphate-buffered saline (PBS).
- Cool cells in 6-well plates on ice and add 150 µL of precooled radio immune precipitation assay (RIPA) lysis buffer (150 mM NaCl, 0.1% Triton X-100, 0.5% sodium deoxycholate, 0.1% SDS, 50 mM Tris-HCl pH 8.0, and freshly added mini protease inhibitor cocktail). Allow the lysis to proceed on ice for 10 minutes.
- Scrape adherent cells off the dish using a plastic cell scraper, then gently transfer the cell suspension into a precooled microcentrifuge tube.
- Centrifuge the cell lysate for 10 minutes at 150 centrifugal force (x g) at 4 °C and transfer the supernatant to a fresh 1.5-mL microcentrifuge tube.
- Measure the protein concentration using a detergent compatible (DC) protein assay kit.
- Load 30 µg of protein from each sample onto a 10% sodium dodecyl sulfate polyacrylamide gel electrophoresis (SDS-PAGE) gel and run the gel at a voltage of 100 V for 1.5-2 hours.
- Transfer the proteins from the gel to a 45-μm polyvinylidene difluoride (PVDF) membrane at a voltage of 110 V for 1-1.5 hours.
- Transfer the PVDF membrane into an appropriate container with the protein side (the side that was facing the gel) up, and briefly rinse the membrane in distilled water.
- Discard the water, add Ponceau S solution, and put the membrane on a rocking platform for 1-2 minutes.
- De-stain the membrane with distilled water by quickly rinsing it and then washing it for 1 minute.
- Then, put the PVDF membrane on a light box, and take a picture to check for equal total protein loadings.
- Wash the membrane with Tris-buffered saline with Tween 20 (TBST, 20 mM Tris-HCl, pH 7.4, 150 mM NaCl, and 0.1% Tween 20) until there is no visible staining.
- Put the membrane in blocking buffer (5% skim milk in TBST solution) and incubate it for 1 hour at room temperature.
- Wash the membrane twice with TBST.
- Incubate the membrane with primary antibodies against phospho-SMAD2 (p-SMAD2; 1:1000, home-made 34), total SMAD2/3 1:1000 and glyceraldehyde 3-phosphate dehydrogenase (GAPDH; 1:1000), overnight at 4 °C.
- Wash the membrane twice with TBST and incubate the membrane with a secondary antibody against rabbit or mouse (1:5000) for 2 hours.
- Incubate the PVDF membrane with Western ECL substrate for 30 seconds, and detect the signal using an imaging system.
- Repeat the experiments at least three times to obtain biological triplicates.
2. Analysis of TGF-β-induced SMAD3-dependent transcriptional responses
- Perform the SMAD3/SMAD4-dependent CAGA12-luciferase transcriptional reporter assay.
- Culture and trypsinize MCF10A-Ras cells as described in Step 1. Seed cells into 24-well plates at 5×10⁴ cells/well and allow the cells to adhere overnight.
- The day after seeding, cotransfect the cells in each well with 100 ng of the TGF-β/SMAD3-inducible (CAGA)12 luciferase transcriptional reporter construct35 and 80 ng of the β-galactosidase expression construct using polyethylenimine (PEI). The transfection of β-galactosidase is used to normalize differences in transfection efficiency between different wells. Set up every experimental group in triplicate.
- After 24 hours of incubation, starve cells with serum-free DMEM-high glucose and, 6 hours later, add TGF-β (5 ng/mL) or ligand buffer (4 mM HCl, 0.1% BSA) as a vehicle control to the cells.
- After another 24 hours of incubation, wash cells twice with prewarmed PBS.
- Add 120 µL/well 1× lysis buffer and gently shake the plate at 4 °C for 20 minutes.
- Transfer 30 µL of lysate to each well of a 96-well white assay microplate to measure luciferase activity using a luminometer.
- Transfer 50 µL of lysate to each well of a 96-well transparent plate to measure β-galactosidase activity.
- Normalize the luciferase activity to the β-galactosidase activity and repeat the experiments at least three times to obtain biological triplicates.
- Analyze the expression of TGF-β target genes using quantitative real-time-polymerase chain reaction (qRT-PCR).
- Culture and trypsinize MCF10A-Ras cells as described in Step 1. Seed cells into 6-well plates at 5×10⁵ cells/well and allow the cells to adhere overnight.
- Treat cells with TGF-β (5 ng/mL) or ligand buffer (4 mM HCl, 0.1% BSA) for 6 hours, and then wash the cells twice with 1 mL of PBS.
- Isolate total RNA using an RNA isolation kit.
- Determine the RNA concentration with a NanoDrop and perform cDNA synthesis with 1 µg of RNA using a first strand cDNA synthesis Kit.
- Use a real-time-PCR detection system to perform quantitative real-time-PCR (qRT-PCR) with ten-fold diluted cDNA in a 10 µL reaction mixture that includes specific human forward and reverse primers for GAPDH (for normalization), SERPINE1 (encoding the PAI-1 protein, a TGF-β/SMAD target gene), SMAD7 (TGF-β/SMAD target gene) and qPCR Master Mix. Set up every experimental group in triplicate.
NOTE: The primer sequences used to detect target human genes in qRT-PCR are listed in Table 1. - Use the following qPCR reaction conditions: initialization, 95 °C for 3 minutes; denaturation, 95 °C for 10 seconds; annealing, 60 °C for 30 seconds; and extension, 80 °C for 10 seconds; denaturation, annealing and extension are repeated 40 times.
- Repeat the experiments at least three times to obtain biological triplicates.
3. Analysis of TGF-β-induced EMT
- Analyze the expression of EMT markers at the protein level using Western blotting.
NOTE: The analysis of TGF-β-induced EMT is shown using mouse NMuMG epithelial cells as an example36,37.- Culture NMuMG cells at 37 °C in DMEM-high glucose medium supplemented with 10% fetal bovine serum and 1:100 Pen-Strep. Use methods described in Step 1 for protein isolation and detection.
NOTE: The following antibodies are used in this experiment: E-cadherin, 1:1000; N-cadherin, 1:1000; Snail, 1:1000; Slug, 1:1000; Tubulin, 1:1000 (Figure 3).
- Culture NMuMG cells at 37 °C in DMEM-high glucose medium supplemented with 10% fetal bovine serum and 1:100 Pen-Strep. Use methods described in Step 1 for protein isolation and detection.
- Analyze the expression of EMT markers at the mRNA level using quantitative real-time-PCR as described in Step 2.2.
NOTE: All mouse primers used for qRT-PCR, including CDH1 (encoding the E-cadherin protein), SNAIL, and ZEB2 (Figure 3) are listed in Table 1. - Analyze the EMT process using indirect immunofluorescence and direct fluorescence staining.
- Indirect immunofluorescence staining of E-cadherin
- Place sterile 18 mm-side square glass coverslips in 6-well plates (one coverslip per well).
- Seed 1×10⁵ NMuMG cells with 2 mL of complete DMEM per 6-well plate and allow the cells to adhere overnight.
- Gently move the coverslips with adherent cells to a new 6-well plate and add 2 mL of culture medium to the wells.
- Treat the cells with TGF-β (5 ng/mL) or ligand buffer (4 mM HCl, 0.1% BSA) for 2 days.
- Remove the culture medium and gently wash the cells twice with 1 mL of prewarmed PBS.
- Fix the cells by adding 1 mL of 4% paraformaldehyde and incubating for 30 minutes at room temperature. Then, gently wash the cells twice with 1 mL of PBS.
- Permeabilize the fixed cells with 0.1% Triton X-100 for 10 minutes at room temperature and wash the cells twice with PBS.
- Block the cells with 5% BSA in PBS for 1 hour at room temperature and wash the cells twice with PBS.
- Add the primary antibody against E-cadherin (diluted 1:1000 in PBS) to the top of each coverslip and incubate for 1 hour at room temperature.
- Remove the primary antibody and wash the coverslip with PBS three times.
- Add the Alexa Fluor 555 secondary antibody (diluted 1:500 in PBS) to the top of each coverslip and incubate for 1 hour at room temperature while covering with aluminum foil to protect from light.
- Remove the secondary antibody and wash the coverslip with PBS three times.
- Mount the coverslip (cells facing downward) onto glass slides using mounting medium with 4′,6-diamidino-2-phenylindole (DAPI) and store the mounted slides in a box at 4 °C, protected from light.
- Observe staining with SP8 confocal microscopy.
- Direct fluorescence staining of filamentous (F)-actin.
- Prepare samples following steps 3.3.1.1. to 3.3.1.9.
- Stain the cells by adding Alexa Fluor 488 Phalloidin (1:1000) for 1 hour at room temperature in the dark to visualize filamentous actin (F-actin).
- Wash cells three times with PBS.
- Mount the coverslip onto glass slides using mounting medium with DAPI and take images with SP8 confocal microscopy.
- Indirect immunofluorescence staining of E-cadherin
Results
Analysis of TGF-β signaling
The key step in TGF-β signaling is the phosphorylation of the two most carboxy terminal serine residues in the SSXS motif (Figure 2) by TβRI kinase38,39. To investigate TGF-β signaling responses, we performed Western blotting of phosphorylated SMAD2. In the premalignant human breast MCF10A-Ras cells, the phosphorylation of SMAD2 significantly increased in response to TGF-β stimulation for 1 hour, while the expression of total SMAD2/3 was not affected by TGF-β treatment (Figure 4A). By using the TGF-β-induced SMAD3/4-driven CAGA-luc transcriptional reporter assay, we found that TGF-β markedly induced the luciferase reporter in the MCF10A-Ras cells line compared to non-treated cells (Figure 4B). Moreover, we observed that well-characterized direct transcriptional gene targets of TGF-β including SMAD7 and SERPINE1 (encoding the PAI-1 protein), were highly expressed in TGF-β-treated MCF10A-Ras cells (Figure 4C).
Analysis of TGF-β-induced EMT
We assessed TGF-β-induced EMT with various methods, such as morphological changes, the expression of EMT markers at the mRNA and protein levels and immunofluorescence staining of EMT markers36. NMuMG epithelial cells treated with TGF-β for 1 and 2 days changed from a classic epithelial morphology to a spindle-shaped mesenchymal-like morphology, as shown by phase contrast microscopy (Figure 5A). Consistent with the morphological changes, we observed that TGF-β treatment led to an increase in the protein expression of mesenchymal markers, including N-cadherin, Snail, and Slug37 (Figure 5B). In contrast, E-cadherin, an epithelial marker, was downregulated in NMuMG cells after 2 days of TGF-β treatment (Figure 5B). In addition, we performed quantitative real-time-polymerase chain reaction (qRT-PCR) to investigate the gene expression of EMT markers. CDH1 (encoding the E-cadherin protein) was significantly decreased, while mesenchymal markers such as SNAIL and Zinc finger E-box-binding homeobox 2 (ZEB2) were markedly increased after TGF-β stimulation in NMuMG cells compared to untreated cells (Figure 5C). TGF-β-induced EMT in NMuMG cells was further confirmed by immunofluorescence staining of E-cadherin. Upon TGF-β stimulation for 2 days, NMuMG cells expressed less E-cadherin than cells in the uninduced control group, as analyzed by confocal microscopy (Figure 5D). Moreover, NMuMG cells in the presence of TGF-β formed more actin stress fibers, as shown by confocal microscopy (Figure 5E).
SB431542 and GW788388 inhibit TGF-β signaling and TGF-β-induced EMT
SB431542 is an ATP competitive inhibitor of the kinase domain of TβRI, also termed activin receptor-like kinase 5 (ALK5), while GW788388 inhibits TβRI and TβRII kinase activity. Both inhibitors can inhibit TGF-β receptor signaling40. Thus, we treated NMuMG cells with different concentrations of GW788388 in the presence of TGF-β for 1 hour. As expected, GW788388 inhibited TGF-β-induced SMAD2 phosphorylation in a dose-dependent manner (Figure 6A). Additionally, the TGF-β-mediated phosphorylation of SMAD2 was blocked by SB431542 treatment (Figure 6A). Phosphorylated SMAD2/3 forms a heteromeric complex with SMAD4 and translocates into the nucleus to modulate the transcription of target genes. Therefore, we investigated the translocation of SMAD2/3 in NMuMG cells by immunofluorescence staining of SMAD2/3. The data demonstrated that both SB431542 and GW788388 significantly inhibited the TGF-β-induced nuclear translocation and accumulation of SMAD2/3 in NMuMG cells (Figure 6B). Furthermore, the inhibitory effects of SB431542 and GW788388 were also observed in the mRNA expression levels of important TGF-β target genes involved in EMT, including PAI-1, SNAIL, E-cadherin and Fibronectin (Figure 6C). These data suggested that SB431542 and GW788388 blocked TGF-β signaling and TGF-β-induced EMT.
Analysis of the transdifferentiation of mesenchymal breast cancer cells into adipocytes
EMT plays a vital role in enhancing cellular plasticity in cancers and results in the development of therapy resistance. Cancer cell plasticity can be directly targeted and inhibited with a trans-differentiation approach, such as forced adipogenesis30. We used Py2T murine breast cancer cells, which were derived from the mammary gland of a mouse mammary tumor virus-polyoma middle tumor-antigen (MMTV-PyMT) transgenic mouse, as a cellular model of EMT-induced cancer cell plasticity. Based on an established protocol41, we treated EMT-derived Py2T murine breast cancer cells with the anti-diabetic drug rosiglitazone for 10 days to induce adipogenesis. Adipogenesis was assessed by visualizing lipid droplets using oil red O staining. Fat cells were readily detected in rosiglitazone-treated Py2T murine breast cancer cells (Figure 7), which demonstrated that treatment with rosiglitazone alone is sufficient to promote the transdifferentiation of EMT-derived breast cancer cells into adipocytes.

Figure 1: TGF-β/SMAD signaling. TGF-β signaling initiates with the binding of TGF-β to TGF-β type II receptor (TβRII), a constitutively active kinase, that phosphorylates TGF-β type I receptor (TβRI). Then, activated TβRI kinase phosphorylates SMAD2/3. A peptide containing the SSXS motif of SMAD2 with two carboxy terminal phosphorylated serine residues was used to obtain polyclonal antisera recognizing phosphor-SMAD2 (p-SMAD2). Therefore, the analysis of p-SMAD2 expression by Western blotting can be used to determine the activation of the TGF-β signaling pathway. Phosphorylated SMAD2/3 can form heteromeric complexes with SMAD4, which then translocate into the nucleus to modulate transcriptional responses. The CAGA12-luciferase reporter assay and quantitative real time PCR (qRT-PCR) for the mRNA expression of TGF-β target genes such as SMAD7 and SERPINE1 (encoding PAI-1 protein), can be used to analyze TGF-β-induced SMAD3-dependent transcriptional responses. Please click here to view a larger version of this figure.
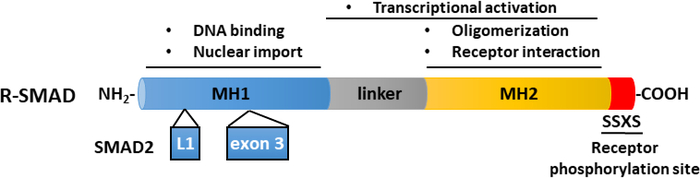
Figure 2: Schematic structure of R-SMADs (SMAD2 and SMAD3). The MH1 (blue) and MH2 (yellow) domains are conserved among R-SMADs, but the linker region (gray) is not conserved. The MH1 domain of SMAD3 harbors a DNA-binding motif, while SMAD2 cannot directly bind DNA, because of an insertion (exon 3) in its MH1 domain. The MH2 domain mediates SMAD oligomerization, interaction with TGF-β receptors, and protein binding and is involved in transcriptional regulation. SMAD2 and SMAD3 can be activated by the phosphorylation of the SSXS motif (in red) in their C termini. Please click here to view a larger version of this figure.
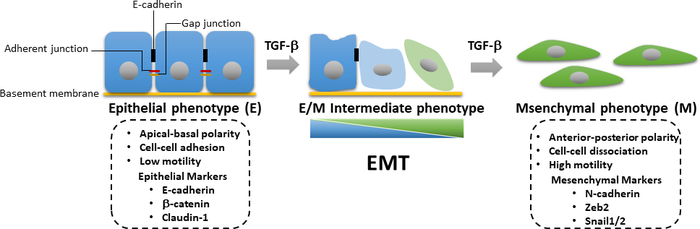
Figure 3: TGF-β-induced EMT. During TGF-β-induced epithelial–mesenchymal transition (EMT), the cells undergo loss of epithelial and acquisition of mesenchymal characteristics with enhanced cell motility and invasion ability. The induction of EMT leads to the expression of mesenchymal markers such as N-cadherin, Zeb2, and Snail1/2, as well as the downregulation of epithelial markers including E-cadherin, β-catenin, and claudin-1. The accumulated loss or gain of epithelial/mesenchymal (E/M) characteristics causes a cell to enter intermediate states in a reversible manner. Please click here to view a larger version of this figure.
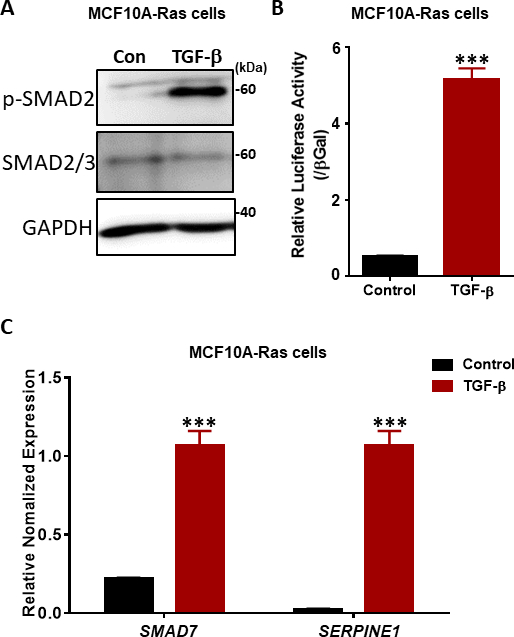
Figure 4: TGF-β signaling responses in MCF10A-Ras cells. (A) MCF10A-Ras cells were treated either with or without TGF-β (2.5 ng/mL) for 1 hour, and cell lysates were immunoblotted for phosphorylated SMAD2 (p-SMAD2), total SMAD2/3 and GAPDH (as a loading control). The size marker is shown on the right. Con: Control group without TGF-β treatment. (B) Analysis of TGF-β (5 ng/mL) activity using the SMAD3–SMAD4-dependent CAGA12-luciferase (LUC) transcriptional reporter in MCF10A-Ras cells. The values are normalized to β-galactosidase (βGal) activity. Data are expressed as the mean ± s.d, n = 3. Student’s t test, ***P ≤ 0.001 (C) qRT-PCR analysis of the TGF-β target genes SMAD7 and SERPINE1 (encoding the PAI-1 protein) in MCF10A-Ras cells treated with TGF-β (2.5 ng/mL) for 6 hours. GAPDH was used as an internal control. Data are expressed as the mean ± s.d, n = 3. Student’s t test, ***P ≤ 0.001. Please click here to view a larger version of this figure.
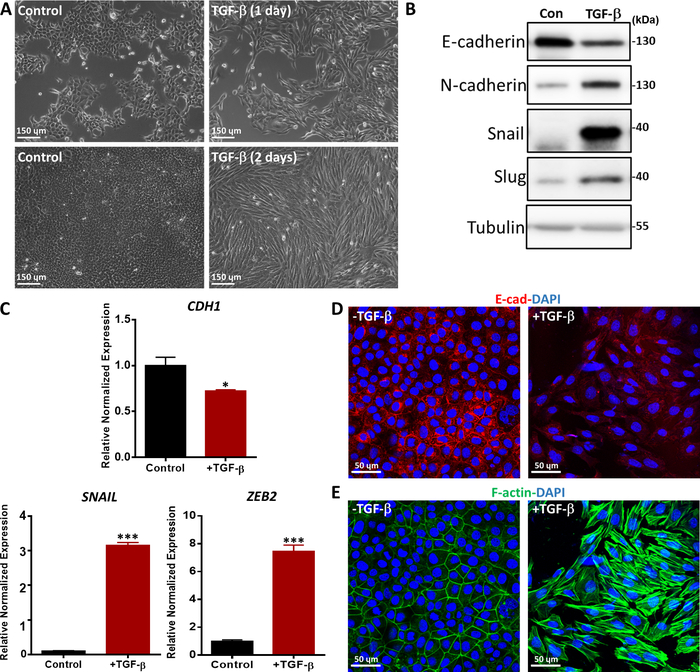
Figure 5: TGF-β-induced EMT in NMuMG cells. (A) Morphology of NMuMG cells treated with TGF-β (2.5 ng/mL) for 1 or 2 days. In the presence of TGF-β, NMuMG cells transdifferentiated into a mesenchymal phenotype. Scale bar = 150 µm (B) NMuMG cells were treated with or without TGF-β (5 ng/mL) for 2 days, and EMT markers were analyzed by Western blotting. The size marker is as indicated on the right. Con: Control group without TGF-β treatment. (C) Gene expression analysis of EMT markers (CDH1 (encoding the E-cadherin protein), SNAIL and ZEB2) in NMuMG cells treated for 2 days with TGF-β (5 ng/mL). GAPDH was used as an internal control. The results are expressed as the mean ± s.d., n = 3. Student’s t-test, *P ≤ 0.05, **P ≤ 0.01, ***P ≤ 0.001. (D) NMuMG cells were stained by immunofluorescence to detect the expression of the epithelial marker E-cadherin (red) after TGF-β (2.5 ng/mL) treatment for 2 days. Nuclei were counterstained with DAPI (blue). Images were captured with confocal microscopy. Scale bar = 50 µm (E) NMuMG cells were stained with fluorescein-phalloidin (green) to visualize F-actin. Nuclei were counterstained with DAPI (blue). Scale bar = 50 µm. Please click here to view a larger version of this figure.
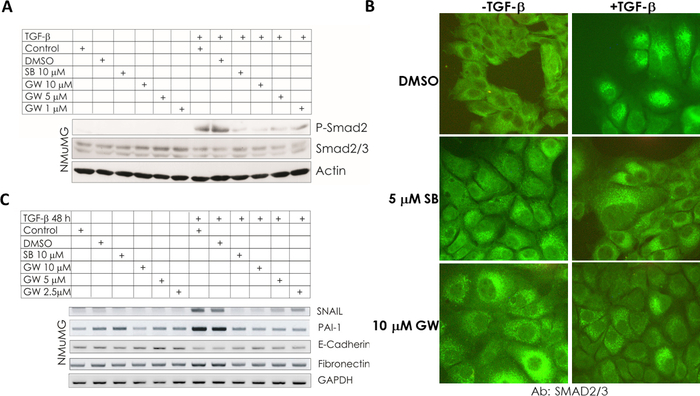
Figure 6: TGF-βsignaling and TGF-β-induced EMT were inhibited by SB431542 and GW788388. (A) NMuMG cells were treated with 10 µM of SB431542 (SB) or the indicated concentrations of GW788388 (GW) in the presence or absence of TGF-β (5 ng/mL) for 1 hour. The cell lysates were immunoblotted for p-SMAD2, SMAD2/3 and GAPDH. (B) NMuMG cells were treated with 5 µM of SB431542 (SB) or 10 µM of GW788388 (GW) in the presence or absence of 5 ng/mL of TGF-β for 1 hour and stained by immunofluorescence to detect the nuclear translocation of SMAD2/3 (green). Images were captured with confocal microscopy. (C) Expression of TGF-β target genes, including PAI-1 and genes encoding EMT markers, including SNAIL, E-Cadherin and Fibronectin, were analyzed by reverse transcriptase polymerase chain reaction (RT-PCR) in NMuMG cells after SB or GW treatment and TGF-β stimulation for 48 hours. GAPDH served as a loading control. Control denotes nontreated cells. This figure has been modified from Petersen M. et al. 34 with permission from publisher. Please click here to view a larger version of this figure.
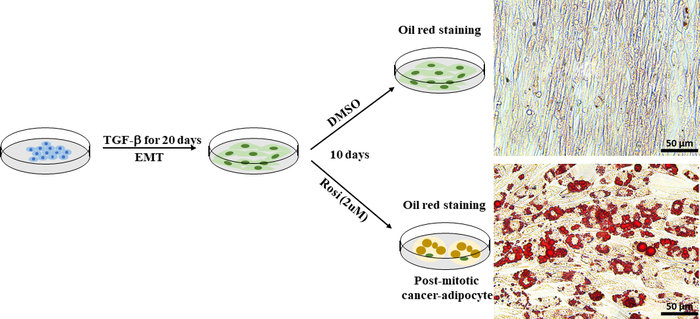
Figure 7: EMT-derived Py2T murine breast cancer cells can be induced to differentiate into adipocytes. Py2T murine breast cancer cells were stimulated with 2 ng/mL TGF-β for 20 days to induce complete EMT. Then, the cells were treated either with DMSO as a vehicle control or rosiglitazone (2 µM) for 10 days to allow the differentiation of mesenchymal cancer cells and induce adipogenesis. The medium was changed every 2 days. After 10 days of treatment, cells were stained with oil red O. Scale bar = 50 µm. Please click here to view a larger version of this figure.
| Species | Gene name | Forward (5' to 3') | Reverse (5' to 3') | ||
| Human | GAPDH | TGCACCACCAACTGCTTAGC | GGCATGGACTGTGGTCATGAG | ||
| SMAD7 | TCCAGATGCTGTGCCTTCC | GTCCGAATTGAGCTGTCCG | |||
| SERPINE1 | CACAAATCAGACGGCAGCACT | CATCGGGCGTGGTGAACTC | |||
| Mouse | GAPDH | TGGCAAAGTGGAGATTGTTGCC | AAGATGGTGATGGGCTTCCCG | ||
| CDH1 | ACCAAAGTGACGCTGAAGTC | GAGGATGTACTTGGCAATGG | |||
| SNAIL | CAGCTGGCCAGGCTCTCGGT | GCGAGGGCCTCCGGAGCA | |||
| ZEB2 | TTCTGCAAGCCTCTGTAGCC | TTCTGGCCCCATTGCATCAT | |||
Table 1: Primers used for qRT-PCR.
Discussion
TGF-β/SMAD signaling plays a pivotal role in breast cancer progression, as it can promote breast cancer cell invasiveness and metastasis by inducing EMT7. Here, we described a logical workflow to investigate TGF-β-initiated signaling from receptor-induced SMAD activation to SMAD-mediated transcriptional and biological responses. We started by describing the analysis of SMAD2 phosphorylation, continued with TGF-β-induced SMAD3-dependent transcriptional responses and EMT marker expression at both the gene and protein levels to analyze the TGF-β/SMAD signaling response, and finally examined TGF-β-induced EMT. We used the CAGA12-luciferase transcriptional reporter containing CAGA boxes derived from the PAI-1 promoter, to monitor the activity of the TGF-β/SMAD signaling pathway35. This reporter construct requires SMAD3 and SMAD4 for activation. Previous studies have shown that the knockdown of SMAD4 attenuated TGF-β-induced CAGA12-luciferase activity37. In addition to the reporter assay, determining the phosphorylation status of endogenous SMADs, including SMAD2 and SMAD3, is another way to investigate the TGF-β signaling response. Indeed, other members of the TGF-β family, such as growth and differentiation factor (GDF)-8/myostatin and GDF-9, also transduce signals via SMAD2/3 proteins by engaging TβRI42,43,44. In addition to the CAGA12-luciferase reporter, several similar reporters have been used to detect the activation of TGF-β signaling. For example, a transcriptional (SBE)4-Lux reporter with response elements derived from the JunB promoter can be efficiently induced by TGF-β, activins and BMPs45.
Western blotting and qPCR were used to analyze TGF-β-induced EMT, which are classic methods to investigate the expression of epithelial markers (i.e., E-cadherin) and mesenchymal markers (i.e., N-cadherin, Snail, Slug and Zeb2). We also performed indirect immunofluorescence staining of E-cadherin and direct fluorescence staining of F-actin. These assays further validated the mesenchymal phenotype of cells after TGF-β treatment. The limitation of immunofluorescence staining is that cells need to be fixed before incubation with antibodies and imaging, and it is difficult to investigate changes in EMT marker expression in live cells. Recently, the design of EMT reporter cell lines, such as A549 lung adenocarcinoma-vimentin-RFP, has made it possible to monitor the transformation of epithelial cells to mesenchymal cells in real-time via the expression of red fluorescent protein (RFP)-tagged vimentin. This platform could be utilized for drug screening and new drug development46. LifeAct dye, a 17-amino-acid peptide, that can stain F-actin structures in living cells, is becoming a valuable tool to visualize the actin cytoskeleton in real time without interfering with cellular processes47. In this study, we used two small-molecule inhibitors, SB431542 and GW788388, to validate their inhibitory effect on TGF-β signaling and TGF-β-induced EMT. Notably, GW788388 potently inhibits TβRI and TβRII activity, while SB431542 has an inhibitory effect on only TβRI (and ALK4 and ALK7). Previous studies revealed that GW788388 is more potent in vivo than SB43154240. In addition to the inhibition of EMT, GW788388 reduced the expression of fibrosis markers in the kidney, and the oral administration of GW788388 in diabetic mice markedly decreased glomerulopathy25,48.
EMT plays an essential role in promoting cancer cell plasticity and results in drug resistance and metastasis 49. Therefore, targeting EMT-derived cells with specific cytotoxic drugs50 or inducing redifferentiation via mesenchymal-to-epithelial transition (MET)51 has been proposed as an approach to overcome cancer cell metastasis and therapy resistance. However, MET contributes to the proliferation of disseminated cancer cells in distant organs52, which might be counterproductive when using the therapeutic reversion of EMT. Recently, a new study reported a therapeutic transdifferentiation approach by directly targeting EMT-derived breast cancer cells for differentiation into adipocytes30. The study by Ishay-Ronen et. al.30 used Py2T murine epithelial cancer cells that had undergone a transition to mesenchymal cells in response to long term treatment with TGF-β. They demonstrated that rosiglitazone in combination with MEK inhibitors enhanced epithelial differentiation and adipogenesis. However, we found that rosiglitazone alone was sufficient to induce the transdifferentiation of mesenchymal Py2T murine cells into adipocytes.
In summary, the methods used in this study provided a logical workflow to investigate TGF-β signaling and TGF-β-induced EMT. The two inhibitors, SB431542 and GW788388, can block TGF-β-induced responses and EMT. In addition, we also demonstrated rosiglitazone alone induces adipogenesis in certain TGF-β-induced mesenchymal breast cancer cells. Although we used only several breast cancer cell lines to investigate TGF-β responses, the methods described here could be extrapolated to other (cancer) cells. Here, we used various TGF-β concentrations to induce cellular responses. In most cell types, TGF-β exerts its biological activity in the concentration range of 0.01-10 ng/mL53 and induces signaling in a dose-response pattern. In primary endothelial cells, including bovine aortic endothelial cells, TGF-β induced the substantial expression of phosphorylated SMAD2 at 0.025 ng/mL, reached a maximum at 0.25 ng/mL, and remained at this level in response to higher concentrations53. In our study, we used a high concentration of TGF-β (5 ng/mL) in MCF10A-Ras cells for the transcriptional reporter assay to obtain strong responses. SMAD2 phosphorylation and target gene expression can be induced by TGF-β at a low dose; thus, we used 2.5 ng/mL TGF-β to treat cells. However, the most suitable working concentration depends on the cell type and estimated effects. To determine the best concentration of TGF-β, treating the cells with different doses (from low to high) is recommended.
Disclosures
The authors have nothing to disclose.
Acknowledgements
We acknowledge the support of the Chinese Scholarship Council (CSC) to J.Z. and Cancer Genomics Centre Netherlands (CGC. NL) to P.t.D.
Materials
| Name | Company | Catalog Number | Comments |
|---|---|---|---|
| Reagent | |||
| 18 mm-side square glass coverslips | Menzel Gläser | 631-1331 | |
| 4′,6-diamidino-2-phenylindole (DAPI) | Vector Laboratories | H-1200 | |
| Alexa Fluor 488 Phalloidin | Thermo Fisher Scientific | A12379 | |
| Alexa Fluor 555 secondary antibody | Thermo Fisher Scientific | A-21422 | |
| Anti-E-cadherin antibody | BD Biosciences | 610181 | |
| anti-glyceraldehyde 3-phosphate dehydrogenase(GAPDH) antibody | Merck Millipore | MAB374 | |
| Anti-N-cadherin antibody | BD Biosciences | 610920 | |
| Anti-Slug antibody | Cell Signaling Technology | 9585 | |
| anti-SMAD2/3 antibody | Becton Dickinson | 610842 | |
| Anti-Snail antibody | Cell Signaling Technology | 3879 | |
| Anti-Tubulin antibody | Cell Signaling Technology | 2148 | |
| Bovine Serum Albumin | Sigma-Aldrich | A2058 | |
| Cholera enterotoxin | Sigma-Aldrich | C8052 | |
| Clarity Western ECL Substrate | Bio-Rad | 1705060 | |
| DC protein assay kit | Bio-Rad | 5000111 | |
| DMEM-high glucose | Thermo Fisher Scientific | 11965092 | |
| DMEM-high glucose medium | Thermo Fisher Scientific | 11965092 | |
| Dulbecco’s modified Eagle’s medium (DMEM)/F12 | Thermo Fisher Scientific | 11039047 | |
| epidermal growth factor (EGF) | Merck Millipore | 01-107 | |
| Fetal bovine serum (FBS) | BioWest | S1860-500 | |
| GoTaq qPCR Master Mix | PROMEGA | A600X | |
| Horse serum | Thermo Fisher Scientific | 26050088 | |
| Hydrocortisone | Sigma-Aldrich | H0135 | |
| Insulin | Sigma-Aldrich | 91077C | |
| Mini Protease Inhibitor Cocktail | Roche | 11836153001 | |
| NucleoSpin RNA II kit | BIOKE´ | 740955 | |
| Penicillin-streptomycin (Pen-Strep) | Thermo Fisher Scientific | 15140148 | |
| Polyethylenimine (PEI) | Polyscience | 23966 | |
| Polyvinylidene difluoride (PVDF) membrane | Merck Millipore | IPVH00010 | |
| Ponceau S solution | Sigma-Aldrich | P7170 | |
| RevertAid First Strand cDNA Synthesis Kit | Thermo Fisher Scientific | K1621 | |
| Rosiglitazone | Sigma-Aldrich | 557366-M | |
| Skimmed milk | Campina: Elk | ||
| Equipment | |||
| ChemiDoc Imaging System | Bio-Rad | 17001402 | |
| CFX Connect Detection System | Bio-Rad | 1855201 | |
| Luminometer | Perkin Elmer | 2030-0050 | |
| NanoDrop 2000/2000c Spectrophotometers | Thermo Fisher Scientific | ND-2000 |
References
- Tzavlaki, K., Moustakas, A. TGF-β Signaling. Biomolecules. 10 (3), (2020).
- Hao, Y., Baker, D., Ten Dijke, P. TGF-β-Mediated Epithelial-Mesenchymal Transition and Cancer Metastasis. International Journal of Molecular Sciences. 20 (11), (2019).
- Morikawa, M., Derynck, R., Miyazono, K. TGF-β and the TGF-β Family: Context-Dependent Roles in Cell and Tissue Physiology. Cold Spring Harbor Perspectives in Biology. 8 (5), (2016).
- Derynck, R., Akhurst, R. J. Differentiation plasticity regulated by TGF-β family proteins in development and disease. Nature Cell Biology. 9 (9), 1000-1004 (2007).
- Massague, J. How cells read TGF-β signals. Nature Reviews Molecular Cell Biology. 1 (3), 169-178 (2000).
- Seoane, J., Gomis, R. R. TGF-β Family Signaling in Tumor Suppression and Cancer Progression. Cold Spring Harbor Perspectives in Biology. 9 (12), (2017).
- Colak, S., Ten Dijke, P. Targeting TGF-β Signaling in Cancer. Trends in Cancer. 3 (1), 56-71 (2017).
- Suriyamurthy, S., Baker, D., ten Dijke, P., Iyengar, P. V. Epigenetic Reprogramming of TGF-β Signaling in Breast Cancer. Cancers (Basel). 11 (5), (2019).
- Drabsch, Y., Ten Dijke, P. TGF-β signalling and its role in cancer progression and metastasis). Cancer and Metastasis Reviews. 31 (3-4), 553-568 (2012).
- Goumans, M. J., Ten Dijke, P. TGF-β Signaling in Control of Cardiovascular Function. Cold Spring Harbor Perspectives in Biology. 10 (2), (2018).
- Robertson, I. B., Rifkin, D. B. Regulation of the Bioavailability of TGF-β and TGF-β-Related Proteins. Cold Spring Harbor Perspectives in Biology. 8 (6), (2016).
- Robertson, I. B., et al. Latent TGF-β-binding proteins. Matrix Biology. 47, 44-53 (2015).
- Khan, Z., Marshall, J. F. The role of integrins in TGF-β activation in the tumour stroma. Cell and Tissue Research. 365 (3), 657-673 (2016).
- Jenkins, G. The role of proteases in transforming growth factor-β activation. The International Journal of Biochemistry & Cell Biology. 40 (6-7), 1068-1078 (2008).
- Tran, D. Q., et al. GARP (LRRC32) is essential for the surface expression of latent TGF-β on platelets and activated FOXP3+ regulatory T cells. Proceedings of the National Academy of Sciences of the United States of America. 106 (32), 13445-13450 (2009).
- Stockis, J., Colau, D., Coulie, P. G., Lucas, S. Membrane protein GARP is a receptor for latent TGF-β on the surface of activated human Treg. European Journal of Immunology. 39 (12), 3315-3322 (2009).
- Wang, R., et al. GARP regulates the bioavailability and activation of TGF-β. Molecular Biology of the Cell. 23 (6), 1129-1139 (2012).
- Vander Ark, A., Cao, J., Li, X. TGF-β receptors: In and beyond TGF-β signaling. Cellular Signalling. 52, 112-120 (2018).
- Heldin, C. H., Miyazono, K., ten Dijke, P. TGF-β signalling from cell membrane to nucleus through SMAD proteins. Nature. 390 (6659), 465-471 (1997).
- ten Dijke, P., Hill, C. S. New insights into TGF-β-Smad signalling. Trends in Biochemical Sciences. 29 (5), 265-273 (2004).
- Miyazono, K. TGF-β signaling by Smad proteins. Cytokine & Growth Factor Reviews. 11 (1-2), 15-22 (2000).
- Yu, Y., Feng, X. H. TGF-β signaling in cell fate control and cancer. Current Opinion in Cell Biology. 61, 56-63 (2019).
- Zhang, Y. E. Non-Smad pathways in TGF-β signaling. Cell Research. 19 (1), 128-139 (2009).
- Katsuno, Y., Lamouille, S., Derynck, R. TGF-β signaling and epithelial-mesenchymal transition in cancer progression. Current Opinion in Oncology. 25 (1), 76-84 (2013).
- Lamouille, S., Xu, J., Derynck, R. Molecular mechanisms of epithelial-mesenchymal transition. Nature Reviews Molecular Cell Biology. 15 (3), 178-196 (2014).
- Yang, J., et al. Guidelines and definitions for research on epithelial-mesenchymal transition. Nature Reviews Molecular Cell Biology. 21 (6), 341-352 (2020).
- Zhang, Y., Weinberg, R. A. Epithelial-to-mesenchymal transition in cancer: complexity and opportunities. Frontiers in Medicine. 12 (4), 361-373 (2018).
- Brabletz, T., Kalluri, R., Nieto, M. A., Weinberg, R. A. EMT in cancer. Nature Reviews Cancer. 18 (2), 128-134 (2018).
- Ocana, O. H., et al. Metastatic colonization requires the repression of the epithelial-mesenchymal transition inducer Prrx1. Cancer Cell. 22 (6), 709-724 (2012).
- Ishay-Ronen, D., et al. Gain Fat-Lose Metastasis: Converting Invasive Breast Cancer Cells into Adipocytes Inhibits Cancer Metastasis. Cancer Cell. 35 (1), 17-32 (2019).
- Smith, C. J., Osborn, A. M. Advantages and limitations of quantitative PCR (Q-PCR)-based approaches in microbial ecology. FEMS Microbiology Ecology. 67 (1), 6-20 (2009).
- Bustin, S. A., Mueller, R. Real-time reverse transcription PCR (qRT-PCR) and its potential use in clinical diagnosis. Clinical Science. 109 (4), 365-379 (2005).
- Sundqvist, A., et al. JUNB governs a feed-forward network of TGF-β signaling that aggravates breast cancer invasion. Nucleic Acids Research. 46 (3), 1180-1195 (2018).
- Persson, U., et al. The L45 loop in type I receptors for TGF-β family members is a critical determinant in specifying Smad isoform activation. FEBS Letters. 434 (1-2), 83-87 (1998).
- Dennler, S., et al. Direct binding of Smad3 and Smad4 to critical TGF-β-inducible elements in the promoter of human plasminogen activator inhibitor-type 1 gene. The EMBO Journal. 17 (11), 3091-3100 (1998).
- Piek, E., Moustakas, A., Kurisaki, A., Heldin, C. H., ten Dijke, P. TGF-β type I receptor/ALK-5 and Smad proteins mediate epithelial to mesenchymal transdifferentiation in NMuMG breast epithelial cells. Journal of Cell Science. 112, Pt 24 4557-4568 (1999).
- Deckers, M., et al. The tumor suppressor Smad4 is required for transforming growth factor-β-induced epithelial to mesenchymal transition and bone metastasis of breast cancer cells. Cancer Research. 66 (4), 2202-2209 (2006).
- Souchelnytskyi, S., et al. Phosphorylation of Ser465 and Ser467 in the C terminus of Smad2 mediates interaction with Smad4 and is required for transforming growth factor-β signaling. Journal of Biological Chemistry. 272 (44), 28107-28115 (1997).
- Abdollah, S., et al. TβRI phosphorylation of Smad2 on Ser465 and Ser467 is required for Smad2-Smad4 complex formation and signaling. Journal of Biological Chemistry. 272 (44), 27678-27685 (1997).
- Petersen, M., et al. Oral administration of GW788388, an inhibitor of TGF-β type I and II receptor kinases, decreases renal fibrosis. Kidney International. 73 (6), 705-715 (2008).
- Gubelmann, C., et al. Identification of the transcription factor ZEB1 as a central component of the adipogenic gene regulatory network. Elife. 3, 03346(2014).
- Nickel, J., Ten Dijke, P., Mueller, T. D. TGF-β family co-receptor function and signaling. Acta Biochimica et Biophysica Sinica. 50 (1), 12-36 (2018).
- Mazerbourg, S., et al. Growth differentiation factor-9 signaling is mediated by the type I receptor, activin receptor-like kinase 5. Molecular Endocrinology. 18 (3), 653-665 (2004).
- Rebbapragada, A., Benchabane, H., Wrana, J. L., Celeste, A. J., Attisano, L. Myostatin signals through a transforming growth factor-β-like signaling pathway to block adipogenesis. Molecular and Cellular Biology. 23 (20), 7230-7242 (2003).
- Jonk, L. J., Itoh, S., Heldin, C. H., ten Dijke, P., Kruijer, W. Identification and functional characterization of a Smad binding element (SBE) in the JunB promoter that acts as a transforming growth factor-β, activin, and bone morphogenetic protein-inducible enhancer. Journal of Biological Chemistry. 273 (33), 21145-21152 (1998).
- Thiery, J. P., Sleeman, J. P. Complex networks orchestrate epithelial-mesenchymal transitions. Nature Reviews Molecular Cell Biology. 7 (2), 131-142 (2006).
- Riedl, J., et al. Lifeact: a versatile marker to visualize F-actin. Nature Methods. 5 (7), 605-607 (2008).
- Gellibert, F., et al. Discovery of 4-{4-[3-(pyridin-2-yl)-1H-pyrazol-4-yl]pyridin-2-yl}-N-(tetrahydro-2H- pyran-4-yl)benzamide (GW788388): a potent, selective, and orally active transforming growth factor-β type I receptor inhibitor. Journal of Medicinal Chemistry. 49 (7), 2210-2221 (2006).
- Ishay-Ronen, D., Christofori, G. Targeting Cancer Cell Metastasis by Converting Cancer Cells into Fat. Cancer Research. 79 (21), 5471-5475 (2019).
- Gupta, P. B., et al. Identification of selective inhibitors of cancer stem cells by high-throughput screening. Cell. 138 (4), 645-659 (2009).
- Pattabiraman, D. R., et al. Activation of PKA leads to mesenchymal-to-epithelial transition and loss of tumor-initiating ability. Science. 351 (6277), (2016).
- Gao, D., et al. Myeloid progenitor cells in the premetastatic lung promote metastases by inducing mesenchymal to epithelial transition. Cancer Research. 72 (6), 1384-1394 (2012).
- Goumans, M. J., et al. Balancing the activation state of the endothelium via two distinct TGF-β type I receptors. The EMBO Journal. 21 (7), 1743-1753 (2002).
Reprints and Permissions
Erratum
Formal Correction: Erratum: Studying TGF-β Signaling and TGF-β-induced Epithelial-to-mesenchymal Transition in Breast Cancer and Normal Cells
Posted by JoVE Editors on 12/15/2020. Citeable Link.
An erratum was issued for: Studying TGF-β Signaling and TGF-β-induced Epithelial-to-mesenchymal Transition in Breast Cancer and Normal Cells. NMuMG was mislabeled as cancer cells.
NMuMG cells are non-transformed epithelial breast cells established from a mouse mammary gland. NMuMG cells are frequently used as a model system to investigate TGF-β-induced epithelial to mesenchymal transition (EMT). EMT is induced by TGF-β in premalignant human MCF 10A-RAS (M2) cells and mouse MMTV-PyMT breast cancer cell line. The article has been updated to reflect this.
