Yeast growth phenotypes are precisely measured through highly parallel time-lapse imaging of immobilized cells growing into microcolonies. Simultaneously, stress tolerance, protein expression, and protein localization can be monitored, generating integrated datasets to study how environmental and genetic differences, as well as gene-expression heterogeneity among isogenic cells, modulate growth.
A subscription to JoVE is required to view this content. Sign in or start your free trial.
Method Article
High-Throughput Live Imaging of Microcolonies to Measure Heterogeneity in Growth and Gene Expression
In This Article
Summary
Abstract
Precise measurements of between- and within-strain heterogeneity in microbial growth rates are essential for understanding genetic and environmental inputs into stress tolerance, pathogenicity, and other key components of fitness. This manuscript describes a microscope-based assay that tracks approximately 105 Saccharomyces cerevisiae microcolonies per experiment. After automated time-lapse imaging of yeast immobilized in a multiwell plate, microcolony growth rates are easily analyzed with custom image-analysis software. For each microcolony, expression and localization of fluorescent proteins and survival of acute stress can also be monitored. This assay allows precise estimation of strains' average growth rates, as well as comprehensive measurement of heterogeneity in growth, gene expression, and stress tolerance within clonal populations.
Introduction
Growth phenotypes contribute critically to yeast fitness. Natural selection can efficiently distinguish between lineages with growth rates differing by the inverse of the effective population size, which can exceed 108 individuals1. Furthermore, variability of growth rates among individuals within a population is an evolutionarily relevant parameter, as it can serve as the basis for survival strategies such as bet hedging2,3,4,5,6. Therefore, assays that allow for highly accurate measurements of growth phenotypes and their distributions are pivotal for the study of microorganisms. The microcolony growth assay described here can generate individual growth-rate measurements for ~105 microcolonies per experiment. This assay therefore provides a powerful protocol to study yeast evolutionary genetics and genomics. It lends itself particularly well to testing how variability within populations of genetically identical single cells is generated, maintained, and contributes to population fitness7,8,9,10.
The method described here (Figure 1) uses periodically captured, low-magnification brightfield images of cells growing in liquid media on a 96- or 384-well glass-bottom plate to track growth into microcolonies. The cells adhere to the lectin concanavalin A, which coats the bottom of the microscope plate, and form two-dimensional colonies. Because the microcolonies grow in a monolayer, microcolony area is highly correlated with cell number7. Therefore, accurate estimates of microcolony growth rate and lag time can be generated with custom image-analysis software that tracks the rate of change of the area of each microcolony. Furthermore, the experimental setup can monitor the abundances and even the subcellular localizations of fluorescently labeled proteins expressed in these microcolonies. Downstream processing of data from this microcolony growth assay can be achieved by custom analysis or by existing image-analysis software, such as Processing Images Easily (PIE)11, an algorithm for robust colony area recognition and high-throughput growth analysis from low-magnification, brightfield images, which is available via GitHub12.
Because growth-rate estimates derived from the microcolony-growth assay are generated from a large number of single-colony measurements, they are extremely accurate, with standard errors several orders of magnitude smaller than the estimates themselves for a reasonably sized experiment. Therefore, the power of the assay to detect growth-rate differences between different genotypes, treatments, or environmental conditions is high. The multiwell-plate format allows numerous different environment and genotype combinations to be compared in a single experiment. If strains constitutively express different fluorescent markers, they may be mixed in the same well and distinguished by subsequent image analysis, which could increase power further by allowing well-by-well data normalization.
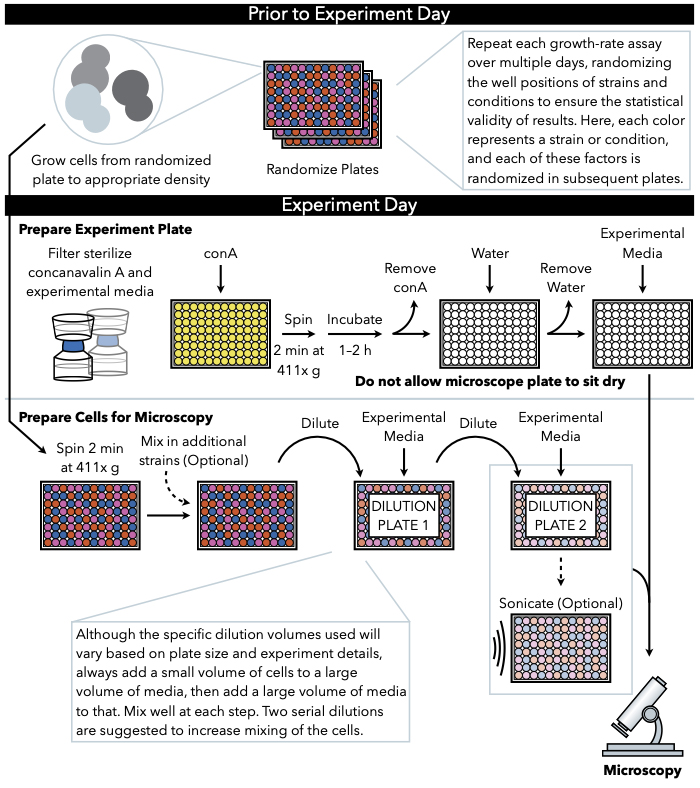
Figure 1: Schematic representation of the protocol. This protocol follows two main steps, which are the preparation of the experimental plate and the preparation of the cells to image. Randomization of plates and growth of cells should be conducted before and leading up to the experiment day. Repeated mixing of cells at each step during dilution is imperative in the steps until plating, and therefore preparing the experimental plate first is recommended so that it is ready for plating immediately upon the completion of cell dilution. Please click here to view a larger version of this figure.
Access restricted. Please log in or start a trial to view this content.
Protocol
1. Preparation of Randomized Plates (Prior to Experiment Day)
- Plan the strains and conditions to be tested with the growth assay. At this point, randomly assign strains and conditions to any well.
NOTE: When considering plate setup, it is advisable to include more than one replicate per strain and growth condition on a single plate to account for well-related noise in measurements. See Discussion for more details. - Computationally randomize the location of each strain and environmental condition for plate replicates that will be run on different days.
- Grow all cells that will be used in the experiment to saturation in yeast extract-peptone-dextrose (YEPD; 2% glucose) medium in a shaker at 30 °C (or any other appropriate temperature).
- Create the randomized stock plates either manually or with a liquid-handling robot. Add 10 µL of the designated saturated cells to each well of a sterile U-bottom tissue culture plate. If multiple strains will be tested in a single well, do not combine them at this point; this combining will be done just prior to cell dilutions on the day of the experiment to ensure all strains are at the correct concentrations when plated as microcolony founder cells.
- Add 10 µL of 30% glycerol to each well of each plate. Pipet up and down so that the cells and the glycerol become well mixed.
- Seal each plate with a foil cover and freeze down immediately at -70 °C until ready to use.
NOTE: It is important to create all randomized plates on the same day, and freeze them, so that the pre-growth conditions of the cells in each plate will have been identical and will not generate technical variation in the growth-rate assay.
2. Pre-Growth of Yeast
NOTE: Typically, this starts prior to experiment day and is highly dependent on the experimental question. See Discussion for details.
- Remove a stock plate (10 µL yeast, 10 µL glycerol per well) from the -70 °C freezer and add 180 µL of the media to be used for the experiment. If the experiment will be conducted using nutrient-limiting media, do not pre-grow yeast to saturation in the nutrient-limiting media as sporulation of yeast can occur. Instead, pre-grow in non-limiting media.
- Grow yeast while shaking at 30 °C. Consider whether to run the assay starting with cells in log phase or in stationary phase to determine if diluting the cells multiple times prior to the experiment will be necessary. If the yeast strains or conditions in the assay are expected to have significantly different growth rates, then a two-day pre-growth period will be necessary in order for all the different conditions to reach stationary phase.
3. Microscope Setup
- Microscope plate preparation
- Ensure that the microscope incubator is on and heating the microscope chamber to the desired growth temperature for the experimental conditions. For standard experiments using Saccharomyces cerevisiae cells, the incubator should heat the microscope chamber to 30 °C to ensure that the growth conditions for the cells will be correct during the growth rate assay.
- Sanitize the workbench, pipettes, and other tools with 70% ethanol. Retrieve a microscope plate and place it on the bench on top of a lint- and static-free wipe.
NOTE: Never touch the bottom of the microscope plate, even with gloves on, and always set the microscope plate down on top of a lint- and static-free wipe any time it touches any surface. This prevents smudges or scratches from impeding growth-rate measurements once the experiment is being imaged. - Thaw 5 mL of 5x concanavalin A solution, dilute to 1x with water, and filter sterilize through a syringe fitted with a 0.2-µm filter.
- Filter sterilize all other liquids that will be used in the assay with a 0.2 µm filter, including experimental media, to remove any crystals or debris that may have materialized in the solutions. The presence of crystals would reduce the quality of the microscopy images.
- Pipet 200 µL of concanavalin A solution into each well of the microscope plate.
- Centrifuge the plate for 2 min at 411 x gravity (g) with a lint- and static-free wipe under the plate, to ensure that the concanavalin A solution evenly covers the bottom of each well and that there are no air bubbles.
- Cover the plate with its lid and let it sit for 1-2 h. The precise time the plate sits is flexible, but it is important to be consistent between different runs of the experiment.
- Remove all of the concanavalin A solution from the plate either by suction or by forcefully discharging it out into the sink or a receptacle. Be careful not to touch the glass part of the plate. It is acceptable if some drops of concanavalin A solution remain in the wells.
- Wash the microscope plate wells by adding 400 µL of sterile water. Remove the water as done with the concanavalin A in the previous step. Do not let the plate sit dry.
- Immediately add 185 µL experimental growth media into the plate. 15 µL of correctly diluted cells will be added to this plate.
- Yeast Cell Dilution
NOTE: The steps below describe a dilution of yeast from a saturated culture (approximately 108 cells/mL) 400-fold to achieve a concentration of 250,000 cells/mL, 15 µL of which will be diluted into 400 µL in the glass-bottom plate, giving a final number of approximately 4000 cells per well in a 96-well plate. If using a 384-well plate the final number of cells per well should be approximately 700 and the dilutions should be adjusted accordingly. This ratio should be adjusted for cells collected in log phase, growing in richer or poorer pre-growth media, or from different strains. The final density of cells per well should be reduced when running the growth rate assay for time periods longer than 10 h.- Set up two 96-well culture plates for serial dilutions: label as plate 1 and 2, and add 90 µL experimental growth media (i.e., the media that the yeast will grow in on the microscope) to each serial dilution plate.
NOTE: Regardless of what final dilution is used, at least two serial dilutions of cells are recommended, in each of which a small volume of yeast is pipetted into a bigger volume of experimental media and then a large volume of experimental media is mixed in vigorously with a pipet (as in steps 3.2.5 and 3.2.6 below). - Retrieve the plate of cells from pre-growth and centrifuge the plate for 2 min at 411 x g.
NOTE: It is very important not to cross-contaminate different wells in the plate. The purpose of this centrifugation step before removing the foil covering from plates is to ensure that yeast-filled droplets from one well do not fly off the foil and end up in other wells. Be careful never to tilt or agitate the plates to avoid yeast coming into contact with the foil covering after centrifugation. - Carefully peel back the foil and resuspend cells by vigorously pipetting cells with a pipet set to approximately one-half the total volume in the plate while moving the pipet around the well to mix. Check that all cells have been resuspended from the bottom of the wells.
- If multiple strains within individual wells will be used, strains should be mixed at this time at the ratio necessary for the experiment. If a reference strain will be used to generate growth-rate measurements, the ratio of reference to test strain should be 1:1.
- Pipet 10 µL of yeast from growth media into dilution plate 1. Add 100 µL of experimental growth media to each well to a final volume of 200 µL per well. Pipet up and down vigorously.
- Pipet 10 µL of yeast from plate 1 into plate 2. Add 100 µL of experimental growth media to each well, and pipet up and down vigorously to mix.
NOTE: These dilution steps are critical to help separate clusters of yeast that are stuck together at the end of the pre-growth stage and ensure that approximately equal numbers of yeast cells end up in each well. Having consistent numbers of yeast in each well helps remove experimental noise and biases in growth-rate measurements (see Representative Results).
- Set up two 96-well culture plates for serial dilutions: label as plate 1 and 2, and add 90 µL experimental growth media (i.e., the media that the yeast will grow in on the microscope) to each serial dilution plate.
- Sonication
NOTE: Sonication is optional, and only needs to be performed for yeast strains that have a high propensity to adhere to one another (e.g., some wild strains). For lab strains, sonication is generally not necessary and may be skipped by proceeding to step 3.4.- Sanitize a 96-pin sonicator head with 70% ethanol by placing it in a 96-well plate filled with 70% ethanol and dry with a lint- and static-free wipe.
- Set a sonication program that is sufficiently strong to break apart flocculated yeast cells, but does not kill cells or cause elevated stress responses. Some testing may be required to identify the best sonication program for a given experiment. The sonication program used in this experiment is: amplitude = 10, process time = 10 s, pulse-on = 1 s, pulse-off = 1 s. This exact program is likely not applicable to all sonicators so testing is suggested prior to the experiment day.
- Mix the yeast in serial dilution plate 2 once more by pipetting up and down vigorously five times.
- Place dilution plate 2 on the platform and secure it with the sonicator pins in the cell suspension but not touching the bottom of the plate. Run the sonication program using appropriate ear protection.
- After the program runs, clean the sonicator head with 70% ethanol and then with water, and then immediately proceed to microscope plate preparation so that the cells do not flocculate again.
- Prepare Plate for Microscope:
- Pipet 15 µL of yeast from serial dilution plate 2 into the microscope plate to a volume of 200 µL. Add 200 µL of experimental growth media to each well to a final volume of 400 µL per well, and pipet up and down vigorously to mix.
- Cover the plate with a breathable membrane. It is important to seal the plate well with this membrane, for example using a rubber roller.
- To adhere the yeast cells to the concanavalin A on the glass surface, centrifuge the plate with a lint- and static-free wipe beneath it for 2 min at 411 x g.
- At the microscope, wipe the top and bottom of the plate with a lint- and static-free wipe, and blow compressed air onto the plate to get rid of debris.
- Place the plate onto the microscope, making sure it is level and that the A1 well is in the top left corner.
4. Time-lapse Microscopy Growth-rate Measurements
NOTE: During time-lapse microscopy the following features are computer controlled: x, y, and z position, shutters, and fluorescence filters. A hardware-based auto-focus system is optimal to prevent focal plane drift during time-lapse imaging. Alternatively, a software-based auto-focusing loop can be used. To maintain humidity in the microscope chamber, it is advised to keep a beaker with purified water in the chamber throughout the duration of the experiment.
- Create a list of positions (x,y) to image, so that each microscope-plate well is fully imaged. Avoid overlapping images so that no cell is analyzed multiple times.
- Image in brightfield with diascopic illumination (DIA) at a magnification of 15x. Set exposure to ~5 ms.
- Zoom in on the image digitally so that cells are clearly visible. Use the focusing knobs to identify the ideal focus for the experiment in the four wells on the corner of the plate and in one well at the center of the plate. Focus in such a way as to get maximum contrast of the cells.
- Set the z position (or autofocus position) for the experiment to be an average of the z/autofocus positions identified for each of these wells. If the microscope plate is well made and the glass bottom does not have defects, the ideal focus positions should be similar for each well.
NOTE: When analyzing images with the Processing Images Easily (PIE) image analysis pipeline11, 12, it is helpful for the cells to be slightly out of focus on the microscope so that there is a dark rim outside of the cell and a light-colored interior, which aids in accurate colony recognition and size estimates. - If using fluorescent strains, identify the channels and the exposures with which to image, ensuring that no pixels are overexposed. When setting exposure time for fluorescent channels, turn off the "live capture" mode on the microscope to avoid exposing cells to fluorescence excitation for long periods of time, as this can both photobleach the cells and cause stress.
- Set up the time-sequence acquisition to capture images at the desired time interval for the desired length of time.
- Run the experiment.
Access restricted. Please log in or start a trial to view this content.
Results
The novelty of this protocol is that growth rate can be calculated for individual cells within a population by tracking their growth into microcolonies through time-lapse imaging (Figure 2A). Because microcolonies grow for many hours in a planar manner due to the presence of concanavalin A, their areas can be tracked throughout the experiment, and a linear fit to the change in the natural log of the area over time can be used to calculate growth rate for each individual colony observed
Access restricted. Please log in or start a trial to view this content.
Discussion
The protocol described here is a versatile assay that allows cell growth and gene expression to be monitored simultaneously at the level of individual microcolonies. Combining these two modalities yields unique biological insights. For example, previous work has used this assay to show a negative correlation between expression of the TSL1 gene and microcolony growth rate in isogenic wildtype cells by measuring both simultaneously7,10. It is also possible...
Access restricted. Please log in or start a trial to view this content.
Disclosures
The authors have nothing to disclose.
Acknowledgements
We thank Naomi Ziv, Sasha Levy and Shuang Li for their contributions to developing this protocol, David Gresham for shared equipment, and Marissa Knoll for help with video production. This work was supported by National Institutes of Health grant R35GM118170.
Access restricted. Please log in or start a trial to view this content.
Materials
| Name | Company | Catalog Number | Comments |
|---|---|---|---|
| General Materials | |||
| 500 mL Bottletop Filter .22 µm PES Sterilizing, Low Protein Binding, w/45mm Neck | Fisher | CLS431154 | used to filter the media |
| BD Falcon*Tissue Culture Plates, microtest u-bottom | Fisher | 08-772-54 | 96-well culture tubes used to freeze cells, pre-grow cells, and dilutions |
| BD Syringes without Needle, 50 mL | Fisher | 13-689-8 | Used to filter the Concanavalin A |
| Costar Sterile Disposable Reagent Reservoirs | Fisher | 07-200-127 | reagent reservoirs used to pipette solutions with multichannel pipette |
| Costar Thermowell Aluminum Sealing Tape | Fisher | 07-200-684 | 96-well plate seal for pre-growth and freezing |
| lint and static free Kimwipes | Fisher | 06-666A | lint and static free wipes to keep microscope plate bottom free of debris and scratches |
| Nalgene Syringe Filters | ThermoFisher Scientific | 199-2020 | 0.2 μm pore size, 25 mm diameter; used to filter concanavalin A solution |
| Media Components | |||
| Minimal chemically defined media (MD; 2% glucose) | alternative microscopy media used for yeast pre-growth and growth during microscopy | ||
| Synthetic Complete Media (SC; 2% glucose) | microscopy media used for yeast pre-growth and growth during microscopy | ||
| Yeast extract-peptone-dextrose (YEPD; 2% glucose) medium | cell growth prior to freezing down randomized plates | ||
| Microscopy Materials | |||
| Breathe-Easy sealing membrane | Millipore Sigma | Z380059-1PAK | breathable membranes used to seal plate during microscopy experiment. At this stage breathable membranes are recommended because they prevent condensation in the wells and allow for better microscopy images |
| Brooks 96-well flat clear glass bottom microscope plate | Dot Scientific | MGB096-1-2-LG-L | microscope plate |
| Concanavalin A from canavalia ensiformis (Jack Bean), lyophilized powder | Millipore Sigma | 45-C2010-1G | Make 5x concanavalin A solution and freeze 5ml of 5x concanavalin A in 50 mL conical tubes at -80 °C |
| Strains Used | |||
| MAH.5, MAH.96, MAH.52, MAH.66, MAH.11, MAH.58, MAH.135, MAH.15, MAH.44, MAH.132 | Haploid mutation accumulation strains in a laboratory background, described in Hall and Joseph 2010 | ||
| EP026.2A-2C | Progeny of the ancestral Hall and Joseph 2010 mutation accumulation strain, transformed with YFR054cΔ::Scw11P::GFP | ||
| Equipment | |||
| Misonix Sonicator S-4000 with 96-pin attachment | Sonicator https://www.labx.com/item/misonix-inc-s-4000-sonicator/4771281 | ||
| Nikon Eclipse Ti-E with Perfect Focus System | Inverted microscope with automated stage and autofocus system |
References
- Geiler-Samerotte, K. A., Hashimoto, T., Dion, M. F., Budnik, B. A., Airoldi, E. M., Drummond, D. A. Quantifying condition-dependent intracellular protein levels enables high-precision fitness estimates. PloS one. 8 (9), 75320(2013).
- Kussell, E., Leibler, S. Phenotypic diversity, population growth, and information in fluctuating environments. Science. 309 (5743), 2075-2078 (2005).
- Thattai, M., van Oudenaarden, A. Stochastic gene expression in fluctuating environments. Genetics. 167 (1), 523-530 (2004).
- King, O. D., Masel, J. The evolution of bet-hedging adaptations to rare scenarios. Theoretical population biology. 72 (4), 560-575 (2007).
- Acar, M., Mettetal, J. T., van Oudenaarden, A. Stochastic switching as a survival strategy in fluctuating environments. Nature genetics. 40 (4), 471-475 (2008).
- Avery, S. V. Microbial cell individuality and the underlying sources of heterogeneity. Nature reviews. Microbiology. 4 (8), 577-587 (2006).
- Levy, S. F., Ziv, N., Siegal, M. L. Bet hedging in yeast by heterogeneous, age-correlated expression of a stress protectant. PLoS biology. 10 (5), 1001325(2012).
- van Dijk, D., et al. Slow-growing cells within isogenic populations have increased RNA polymerase error rates and DNA damage. Nature communications. 6, 7972(2015).
- Ziv, N., Shuster, B. M., Siegal, M. L., Gresham, D. Resolving the Complex Genetic Basis of Phenotypic Variation and Variability of Cellular Growth. Genetics. 206 (3), 1645-1657 (2017).
- Li, S., Giardina, D. M., Siegal, M. L. Control of nongenetic heterogeneity in growth rate and stress tolerance of Saccharomyces cerevisiae by cyclic AMP-regulated transcription factors. PLoS genetics. 14 (11), 1007744(2018).
- Plavskin, Y., Li, S., Ziv, N., Levy, S. F., Siegal, M. L. Robust colony recognition for high-throughput growth analysis from suboptimal low-magnification brightfield micrographs. bioRxiv. , (2018).
- Siegallab. , Available from: http://github.com/Siegallab/PIE (2020).
- Ziv, N., Siegal, M. L., Gresham, D. Genetic and nongenetic determinants of cell growth variation assessed by high-throughput microscopy. Molecular biology and evolution. 30 (12), 2568-2578 (2013).
- Hall, D. W., Joseph, S. B. A high frequency of beneficial mutations across multiple fitness components in Saccharomyces cerevisiae. Genetics. 185 (4), 1397-1409 (2010).
- Saleemuddin, M., Husain, Q. Concanavalin A: a useful ligand for glycoenzyme immobilization--a review. Enzyme and microbial technology. 13 (4), 290-295 (1991).
- Geiler-Samerotte, K. A., Bauer, C. R., Li, S., Ziv, N., Gresham, D., Siegal, M. L. The details in the distributions: why and how to study phenotypic variability. Current opinion in biotechnology. 24 (4), 752-759 (2013).
- Nakagawa, S., Schielzeth, H. Repeatability for Gaussian and non-Gaussian data: a practical guide for biologists. Biological reviews of the Cambridge Philosophical Society. 85 (4), 935-956 (2010).
- Bolker, J. A. Exemplary and surrogate models: two modes of representation in biology. Perspectives in biology and medicine. 52 (4), 485-499 (2009).
Access restricted. Please log in or start a trial to view this content.
Reprints and Permissions
