This article describes a convenient method for monitoring dynamic changes in antibody titers for two immunoglobulin isotypes concurrently (either IgA, IgM, or IgG) resulting from an immune response to SARS-CoV-2 infection or vaccination. This 'Multianalyte Covid-19 Immune Response Panel' employs three indirect immunoassays built on coded microspheres that are read using a flow-based multiplex reader with 'dual-channel' capability.
Method Article
Dynamic Monitoring of Seroconversion using a Multianalyte Immunobead Assay for Covid-19
* These authors contributed equally
In This Article
Summary
Abstract
Multiplex technologies for interrogating multiple biomarkers in concert have existed for several decades; however, methods to evaluate multiple epitopes on the same analyte remain limited. This report describes the development and optimization of a multiplexed immunobead assay for serological testing of common immunoglobulin isotypes (e.g., IgA, IgM, and IgG) associated with an immune response to SARS-CoV-2 infection or vaccination. Assays were accomplished using a flow-based, multiplex fluorescent reader with dual-channel capability. Optimizations focused on analyte capture time, detection antibody concentration, and detection antibody incubation time. Analytical assay performance characteristics (e.g., assay range (including lower and upper limits of quantitation); and intra- and inter-assay precision) were established for either IgG/IgM or IgA/IgM serotype combination in tandem using the 'dual channel' mode. Analyte capture times of 30 min for IgG, 60 min for IgM, and 120 min for IgA were suitable for most applications, providing a balance of assay performance and throughput. Optimal detection antibody incubations at 4 µg/mL for 30 min was observed and are recommended for general applications, given the overall excellent precision (percent coefficient of variance (%CV) ≤ 20%) and sensitivity values observed. The dynamic range for the IgG isotype spanned several orders of magnitude for each assay (Spike S1, Nucleocapsid, and Membrane glycoproteins), which supports robust titer evaluations at a 1:500 dilution factor for clinical applications. Finally, the optimized protocol was applied to monitoring Spike S1 seroconversion for subjects (n = 4) that completed a SARS-CoV-2 vaccine regimen. Within this cohort, Spike S1 IgG levels were observed to reach maximum titers at 14 days following second dose administration, at a much higher (~40-fold) signal intensity than either IgM or IgA isotypes. Interestingly, we observed highly variable Spike S1 IgG titer decay rates that were largely subject-dependent were observed, which will be the topic of future studies.
Introduction
Simultaneous measurement of multiple disease-related biomarkers in biological samples permits descriptive and predictive insights into pathological processes. While conventional single analyte immunological procedures, such as enzyme-linked immunosorbent assays (ELISAs), have been the cornerstone of quantitative analyses in both clinical and research settings, these techniques can have substantial limitations regarding throughput, the quantity of specimen required for each measurement, and cost-effectiveness that greatly limit the study of multiple biological elements that are frequently intertwined throughout the disease course1. Microsphere-based multiplexing technology has become an indispensable platform for both diagnostic and research facilities for its ability to combine assays to enhance laboratory throughput, mitigate sample scarcity, and reduce repetitive testing to maximize cost savings1,2,3,4. Recently, further augmentation of this multiplexing power has been introduced with instruments possessing dual-reporter capabilities. The dual-reporter feature implements two fluorescent channels for detection, supplying another dimension of multiplexing, permitting the detection of multiple epitopes on the same analyte.
Severe acute respiratory syndrome coronavirus 2 (SARS-CoV-2) is the pathogen responsible for the current coronavirus disease 2019 (COVID-19) pandemic5. While RT-PCR testing is crucial for infection confirmation at the beginning of the disease course, serologic examinations of antibody titers have proved to be imperative for the accurate and complete critique of individuals regarding a previous exposure or recovery; a response to immunization; and/or an evaluation of Covid-19 vaccination efficacy6,7.
This report delineates methods for gauging seroconversion for multiple SARS-CoV-2 viral antigens that utilize a flow-based, multiplex reader dual-reporting system. Specifically, concurrent detection of two antibody subtypes (configured as IgG/IgM or IgA/IgM) for a 3-plex SARS-CoV-2 antigens panel that includes assays for Spike S1, Nucleocapsid, and Membrane (aka Matrix) glycoproteins, are described. This approach provides an ideal enterprise for the capture of longitudinal seroconversion and contributes a valuable tool in the arsenal against the Covid-19 pandemic.
Protocol
All subjects were enrolled with written informed consent with full Institutional Review Board (IRB) approval of Rush University Medical Center under protocol ORA 20101207 with all institutional guidelines for ethical research conduct observed. Blood was collected via conventional phlebotomy into lavender vacutainers (K2EDTA) and processed with recommended protocols. The resulting plasma was archived at -80 °C until assessments were performed.
1. Preparation of antigen-conjugated microspheres
- Select three different vials of magnetic microspheres with unique bead regions, recording bead ID and lot information for each vial used.
NOTE: The following steps will be followed for each distinct microsphere region. Microspheres are light sensitive and should be protected from prolonged exposure to light. During wash steps, be careful not to disturb the microspheres. If disturbed, allow a second 60 s separation. - Vortex the microsphere stock for 60 s and sonicate for 5 min prior to use to dissociate aggregated beads.
- Transfer 1.0 x 10⁶ beads to a 1.5 mL low-protein binding microcentrifuge tubes.
- Insert the tube into a magnetic separator and allow separation to occur for 60 s. With the tube still in the magnetic separator, carefully remove the supernatant without disturbing the bead pellet.
- Remove the tube from the magnetic separator, resuspend the beads with 100 µL of HPLC-grade water, and vortex for 30 s. Place the tube back into the magnetic separator for 60 s, and subsequently remove the supernatant. Repeat this wash protocol twice.
- Remove the tube from the magnetic separator and resuspend the washed microspheres in 90 µL of 100 mM Monobasic Sodium Phosphate, pH 6.2 (Activation Buffer) by vortex for 30 s.
- Add 10 µL of 50 mg/mL Sulfo-NHS (diluted with Activation Buffer) to the microspheres and vortex gently for 10 s. Add 10 µL of 50 mg/mL EDC solution (diluted with Activation Buffer) and vortex gently for 10 s. Incubate microspheres for 20 min at room temperature (RT) with a gentle vortex every 10 min.
- Repeat wash steps 1.4-1.5 with 50 mM MES, pH 5.0 (Coupling Buffer) in lieu of LC/MS-grade water for a total of two washes.
- Remove the tube from the magnetic separator and resuspend the beads with 100 µL of Coupling Buffer by vortex for 30 s followed immediately by the addition of the desired quantity of protein.
- Bring the total volume to 150 µL with Coupling Buffer. Mix coupling reaction by vortex for 30 s and incubate for 2 h by rotation at RT.
NOTE: For assays defined herein, conjugations were performed with the following protein concentrations: Spike S1: 5 µg; Nucleocapsid: 5 µg; Membrane: 12.5 µg. - Repeat wash step 1.4 with Phosphate Buffered Saline (PBS)-1% Goat Serum Albumin, 0.01% Polysorbate-20 (Quench Buffer) in lieu of LC/MS-grade water for a total of two washes. Resuspend the washed microspheres in 100 µL of Quench Buffer containing 0.05% sodium azide by vortex for 30 s.
NOTE: Permit the beads to quench fully for at least 6 h prior to proceeding to any other procedure. - Count the number of recovered microspheres using an automated cell counter or a hemocytometer. Record the observed bead concentration.
- Refrigerate the coupled microspheres at 4 °C in the dark.
2. Procedures
- Assay performance (Base protocol)
- Resuspend the coupled microspheres by vortex for 30 s and sonicate for ~60-90 s.
- Remove the required quantity of each bead colloid from the respective tube and combine the bead colloids in a new 1.5 mL microcentrifuge tube.
- Insert the tube into a magnetic separator and allow separation to occur for 60 sec. With the tube still in the magnetic separator, carefully remove the supernatant without disturbing the bead pellet.
- Remove the beads from the separator, resuspend the beads with 100 µL of PBS-1% bovine serum albumin, 0.01% Polysorbate-20 (Assay Buffer), and vortex for 30 s. Place the tube into a magnetic separator and allow separation to occur for 60 s. Repeat this washing protocol (i.e., steps 2.1.3-2.1.4) twice
- Adjust the concentration of the 3-plex working microsphere mixture by adding an appropriate volume of Assay Buffer to generate a final concentration of 100 microspheres per 1 µL for each target.
- Aliquot 12.5 µL of the microsphere mixture prepared in step 2.1.5 into each well of a 384-well plate or 25 µL into each well of a 96-well plate.
- Dilute the plasma/serum specimens 500-fold in Assay Buffer. Prepare standard specimens according to titration desired.
- Add 12.5 µL of Assay Buffer as the blank sample and add each of the diluted specimen or standard into each designated well of a 384-well specimen plate or 25 µL of the blank, diluted specimen or standard into each well of a 96-well specimen plate.
- Cover the plate with an aluminum seal or foil and incubate for 1 h at RT on a plate shaker set to 700 rpm.
NOTE: Schematic for the dilution curves is provided in Table 1. - Prepare a solution of anti-human detection antibodies (secondary antibody solutions) at 4 µg/mL with Assay Buffer as specified in step 2.1.11.
- Prepare Goat-anti-human IgM, conjugated with Super Bright 436 (SB)/Goat-anti-human IgA, Phycoerythrin (PE) Conjugate detections antibodies at 4 µg/mL; or Goat-anti-human IgM, SB Conjugate/Goat-anti-human IgG, PE Conjugate detections antibodies at 4 µg/mL.
NOTE: For a 384-well plate format, 12.5 µL/well of the prepared secondary antibody solution is required, and for a 96-well plate format, 25 µL/well is required. - Place the plate on a magnetic separator, wash rapidly, and forcefully invert over a biohazard container to remove liquid from the wells. With the plate still inverted, forcefully tap the plate against a thick wad of paper.
- Wash each well with 100 µL of Assay Buffer and remove the liquid by forceful inversion over a biohazard container, as previously described. Repeat these steps (2.1.12-2.1.13) for a total of two washes. Discard all used wads of paper into a biohazard container.
- Add 12.5 µL of the secondary antibody working solution to each well of a 384-well plate or 25 µL to each well of a 96-well plate. Cover the plate with an aluminum seal or foil and incubate for 30 min at RT on a plate shaker set to 700 rpm.
- Repeat wash steps 2.1.12-2.1.13
- Add 75 µL of Assay Buffer into each well of a 384-well plate or 100 µL into each well of a 96-well plate. Cover the plate with an aluminum seal or foil and incubate for 5 min at RT on a plate shaker set to 700 rpm.
- Analyze 60 µL via the instrument analyzer according to the system manual.
- Optimization of specimen-capture incubation time
- Perform the steps in section 2.1 using duration of incubation times of 30 min, 60 min, and 120 min in step 2.1.9.
NOTE: Incubations may be performed either with distinct plates or by pausing at step 2.1.6 until the time to proceed to step 2.1.9. to attain the desired incubation times. - Proceed with the plate-reading on the analyzer using 60 µL of the assay mixture according to the manufacturer's recommendations.
- Perform the steps in section 2.1 using duration of incubation times of 30 min, 60 min, and 120 min in step 2.1.9.
- Optimization of secondary antibody concentration
- Perform this procedure as detailed in section 2.1, with exception to the final concentrations of reagents in the secondary antibody working solution (prepared in Step 2.1.10-2.1.11) modified as follows:
Goat-anti-human (or rabbit) IgM, SB-conjugate detection antibodies at 8, 4, 2, 1 and 0.5 µg/mL.
Goat-anti-human (or rabbit) IgA, PE-conjugate detection antibodies at 8, 4, 2, 1 and 0.5 µg/mL.
Goat-anti-human (or rabbit) IgG, PE-conjugate detection antibodies at 8, 4, 2, 1 and 0.5 µg/mL.
Goat-anti-human (or rabbit) IgG, PE-conjugate/Goat-anti-human (or rabbit) IgM, SB-conjugate detection antibodies at 8, 4, 2, 1 and 0.5 µg/mL.
Goat-anti-human (or rabbit) IgA, PE-conjugate/Goat-anti-human (or rabbit) IgM, SB-conjugate detection antibodies at 8, 4, 2, 1 and 0.5 µg/mL. - Proceed with the plate-reading on the analyzer using 60 µL of the assay mixture according to the manufacturer's recommendations.
- Perform this procedure as detailed in section 2.1, with exception to the final concentrations of reagents in the secondary antibody working solution (prepared in Step 2.1.10-2.1.11) modified as follows:
- Optimization of secondary antibody incubation time
- Perform this procedure as detailed in section 2.1 with 15 min, 30 min, 60 min, and 120 min of incubation duration defined in step 2.1.14.
- Proceed with the plate-reading on the analyzer using 60 µL of the assay mixture according to the manufacturer's recommendations.
- Evaluation of subject specimens with optimized dual-channel assays
- Collect subject plasma samples (n = 4) at days -21, -11, -1/0, +14, +28, +60, +90, and +120 relative to the completion of Covid-19 vaccine (i.e., second dose) administration.
NOTE: Day 0 represents the time point whereby vaccination was completed. - Perform all assays using the Base Protocol (section 2.1.) as either an IgG/IgM or IgA/IgM dual-channel assay.
- Normalize the results to the maximal observed Median Fluorescent Intensity (MFI) value for each specific immunoglobulin and assay.
- Collect subject plasma samples (n = 4) at days -21, -11, -1/0, +14, +28, +60, +90, and +120 relative to the completion of Covid-19 vaccine (i.e., second dose) administration.
Results
Typical assay results and performance evaluations
Immunobead assays commonly provide a sigmoidal curve when evaluated over several (log) orders of magnitude, as illustrated in each of the panels presented in Figure 1. The user must experimentally define the optimal concentration range for each analyte in the multiplex to determine the full range of quantitation, ensuring to not over-sample the extremes (areas approaching the lower limit of quantitation [LLOQ] or upper limit of quantitation [ULOQ]). The actual range required for an assay, however, is dictated by the distribution of the target analytes in a biological matrix (i.e., the 'unknowns') at a given dilution factor. Further, although standard curves are typically interpreted via linear regression with a 4- or 5-parametric fit algorithm, the linear portion of a given curve typically provides the greatest confidence in quantitative accuracy with a linear (y = mx + b) model of quantitation. Matching the calibration curve to the observed values for an unknown at a given dilution factor should be the goal in quantitative assay development.
In this regard, a 7-point standard curve based on a 1:5 serial dilution series was evaluated for each of Spike S1, Nucleocapsid, and Membrane antibodies that range between 1 µg/mL and 0.000064 µg/mL for Spike S1 and Nucleocapsid and 5 µg/mL and 0.00032 µg/mL for Membrane, as shown in Figure 1.The lower limit of detection (LLOD) for each assay was defined as the lowest analyte concentration that yielded a signal distinguishable from its background. LLOD can be identified by the equation described previously8,9, LLOD = LoB + 1.645(SDlow concentration sample). LoB is the lower limit of blank, and it is the "apparent" concentration of analyte that is produced from the blank when a zero value is expected, and it can be ascertained using this equation LoB = Meanblank + 1.645(SDblank)8. Based on this method, the MFI values for the Spike S1 assay ranged from 134.38 to 20191.2, with 134.38 MFI representing 0.00024 µg/mL and defined as the LLOD. For the Membrane assay, the practical MFI range was 52.24 to 4764.9, with 52.24 MFI calculated to be 0.004885 µg/mL and assigned as the LLOD. The MFI range for the Nucleocapsid assay was 517.9 to 19666.34, with 517.9 specified as 0.00024 µg/mL, which was the LLOD. The upper limit of detection (ULOD) is defined as the concentration of analyte after which the change in MFI is no longer linear, and the signal response is saturated. It should be noted that the full sigmoidal character of these curves is not observable for the standards tested, with the exception to the Nucleocapsid curve. However, given the observed MFI values for all unknowns assayed to date (at a 1:500 dilution) are within the presented curve range for each analyte and are easily quantified using a 4- or 5- parametric fit via linear regression.
Assay precision
Intra-assay precision: Four replicates of assays were performed on the same plate to assess assay precision, calculated as the %CV, or the quotient of the standard deviation and the average multiplied by 100. Standard points 2 and 5 were selected for these tabulations, with values cataloged in Table 2. The typical acceptable upper limit threshold for %CV values are ≤20%, which was observed for these data, with the exception to that for standard 2 of Membrane IgG, which likely results from background levels and can be rectified by eliminating outlying values (data not shown). It should be noted that an apparent instability to read value was observed for Membrane assays where the MFI values were <200, most commonly in the case of IgA and IgM isotypes.
Inter-assay precision: Three distinct batches of bead sets were prepared for each assay and tested, as defined for Intra-assay precision (above and as seen in Figure 1). Inter-assay variability was assessed by calculating the %CV from the average results for each of three batches, as shown in Table 3. Again, the upper limit threshold for an acceptable %CV is set at ≤20%, which exists for all conditions tested (with a similar effect with standard 2 of Membrane IgG, as seen above). It should be noted that batch-to-batch variability in net MFI values is commonly observed within multiple batches of the same immunoreagents during custom assay development. The use of a calibration curve erected from a commercially-obtained anti-target antibody (e.g., rabbit anti-Spike S1) followed by an anti-species detection antibody can provide consistency in the analytical results and permit comparisons between multiple batches at different periods of time.
Inter-assay precision with human samples: The evaluation of inter-assay precision was repeated with human plasma samples (n = 5) collected within a month of first-reported symptoms for a SARS-CoV-2 infection; accomplished with three distinct batches of assays (i.e., different preparations of the bead sets). These results are depicted in Table 4 and demonstrate precision with a %CV value with the typical upper threshold limit value of ≤20%. The averaged %CV values for the Spike S1, Nucleocapsid and Membrane IgG titers were calculated to be 9.9% (range 2.6%-18%), 11.0% (range 3.5%-24.4%), and 7.6% (range 3.2%-12.9%), respectively. Similar observations were made with the IgM and IgA titers of these three analytes, all providing %CV values <20%. The only exception to this was Subject 5 IgM titers for the Membrane protein, which was subsequently excluded as an outlier. The precision values for the human subject evaluations are consistent with those seen above for the rabbit antibodies, which suggests these assays may be readily reconfigured to evaluate titers of the antigens in multiple species with little impact on assay precision. As noted above, there was an apparent instability to read values observed for Membrane assays where the MFI values were <200, most commonly in the case of IgA and IgM isotypes.
Primary antibody concentration optimization
The analyte 'capture time' was evaluated with the antigen-conjugated beads, and the antibodies in the plasma specimens or in the standards were tested by modifying the length of the primary incubation (30 min, 1 h, 2 h, and 4 h). The difference in the average MFI is presented as the quotient of a specific incubation and the maximum incubation time, termed % Max., in Figure 2, between a 30 min incubation (minimum duration) and a 4 h incubation (maximum duration). Values at 120 min were optimal for IgG titers for the Spike S1, the Membrane, and the Nucleocapsid antibodies, indicating a fast-primary antibody binding kinetics, allowing flexibility to increase assay throughput. However, slower kinetics were observed for the IgA and IgM (data not shown) isotypes, demonstrating peak capture levels at the 4 h time point, as shown in Figure 2. Overall, there is a balance between approaching assay saturation and the practical time expediency for running each assay when in production (to maximize throughput). With this, suitable signals for quantitative purposes at minimal incubation times of 30 min for IgG, 60 min for IgM, and 120 min for IgA were observed in these findings.
Secondary antibody concentration optimization
Five concentrations of secondary antibodies (goat anti-human IgG, PE-conjugated; goat anti-human IgA, PE-conjugated; goat anti-human IgM, SB-conjugated) were tested (0.5, 1, 2, 4, and 8 µg/mL). All antibodies revealed wide ranges of signal, with no obvious signal saturation in any condition, thereby ensuring a linear measurement for any of the concentrations. As an example, the average signal generated from the Spike S1 assay using goat anti-human IgM, SB-conjugated at 0.5 µg/mL was 13.2% of the MFI generated from the maximum signal (8 µg/mL), whereas MFI generated from 4 µg/mL was 73.3% of the MFI manifested at the maximum signal. Details of the range of signals from the other Spike S1 antibody isotypes, the Membrane antibodies, and the Nucleocapsid antibodies are included in Table 5 and Figure 3. As a practical point, the primary impact between the optimal secondary antibody concentration and the previously stated 4 µg/mL secondary antibody concentration is reflected in terms of assay sensitivity and assay cost. That is, an 8 µg/mL secondary antibody concentration may be desirable for application with low antibody titers or low amounts of valuable sample, but the cost associated with these assays would be considerably higher than the use of the previously defined 4 µg/mL concentration. Inversely, instances in which high antibody titers were to be observed (such as individuals that have experienced Covid-19 vaccinations or with non-limiting amounts of sera) would see a cost-benefit through the application of the lower quantities of secondary antibodies (e.g., 1 µg/mL).
Secondary antibody incubation optimization
The potential influence of the duration of the secondary antibody incubation was also investigated by modifying the length of the incubation (15, 30, 60, and 120 min). Generally, the difference in the average MFI as presented as the quotient of a specific incubation and the maximum incubation time, termed %Max, between a 15 min incubation (minimum duration) and a 120 min incubation (maximum duration) did not exceed 30%, 55%, and 50% for the Spike S1, the Membrane, and the Nucleocapsid antibodies, respectively, indicating a fast kinetic step in secondary antibody binding and a means to increase assay throughput. Table 6 includes details on signal changes for all incubation times. Illustrations of the observed signals from different incubations of this analysis are shown in Figure 4.
Dual-channel performance and specificity
For each analyte, a single reporter format run (IgG-PE only, IgA-PE only, or IgM-SB only) was compared to the signal generated for the same analyte when it was run in a dual-reporter format (e.g., Spike S1 IgG-PE only versus Spike S1 IgG-PE in combination with Spike S1 IgM-SB in the dual-reporter format). Assay precision (expressed as %CV) for the signals created in the two formats were used to analyze the relationship in the findings of this experiment. The %CV values of the Spike S1 assays were 6.19%, 16.4%, and 23% for IgM, IgG, and IgA, respectively. For the Membrane assay, the %CV values were 3.3%, 7.9%, and 16.4% for IgM, IgG, and IgA, respectively. Finally, the Nucleocapsid assay provided %CV values at 8.7%, 10.3%, and 24.2% for IgM, IgG, and IgA, respectively. The precision values observed for the IgM and IgA isotypes suggest a longer incubation time may confer superior assay results due to the known binding kinetic differences across these classes of immunoglobulins. Figure 4 shows the agreement between the formats of different concentrations of secondary antibodies.
To confirm the specificity of reporter channels, a single reporter channel was tested at one time while the other channel was assigned as a blank to inquire about the non-specific signal (bleeding effect). These findings indicate there is negligible cross-signal contamination between the two reporter channels, given the high specificity across the spectrum of conditions. These findings are illustrated in Figure 5. Overall, we observed a 6.45% interference across channel 1 to channel 2. However, when the magnitude of the signals was accounted for, we observed the following potential interference levels in dual reporter mode: Spike IgG/ IgM at 71.98%, Spike IgA/ IgM at 28.11%; Membrane IgG/ IgM at 7.41%, Membrane IgA/ IgM at 134.61%; and Nucleocapsid IgG/ IgM at 146.03%, Nucleocapsid IgA/ IgM at 112.13%. In the specified configuration, this would necessitate measurement of Spike IgM in combination with the IgA isotype, Membrane IgM with the IgM isotype, and nucleocapsid measurements not performed in a dual-channel format. This finding may necessitate exploration of the inversion of the labeling strategy whereby IgA and IgG be measured in channel 2 and IgM in Channel 1.
Evaluation of seroconversion events following Covid-19 vaccination
Seroconversion was monitored in four subjects upon assessment of IgA, IgM, and IgG with the Spike S1 assay at time points ranging from pre-vaccination to four months after completion of the Covid-19 vaccination series. Measurements were accomplished in dual channel mode (IgG/ IgM and IgA/ IgM, with IgM values averaged). All subjects received the vaccine as a 2-stage immunization, per standard practice, with a 21-day interval between the first and second doses. Plots of each subject's immune response are shown in Figure 6A-C. Immune response values for the Nucleocapsid and Membrane antigens were observed at background levels for all immunoglobulins evaluated (data not shown), which was consistent with the subjects having no documented prior SARS-CoV-2 infection in the time prior to vaccination. Overall, the observed Spike S1 IgA and IgM values were approximately 40-fold lower than the IgG isotype titers, with peak titers being cresting as soon as 14 days for both IgM and IgG isotypes and the IgA isotype reaching peak titers between the time of the second dose (day 0) and 14 days post second dose, depending on the subject. Notably, the Spike S1 IgG titers start decaying during the course of the four months following completion of vaccination at a highly variable rate, in a subject-dependent manner.
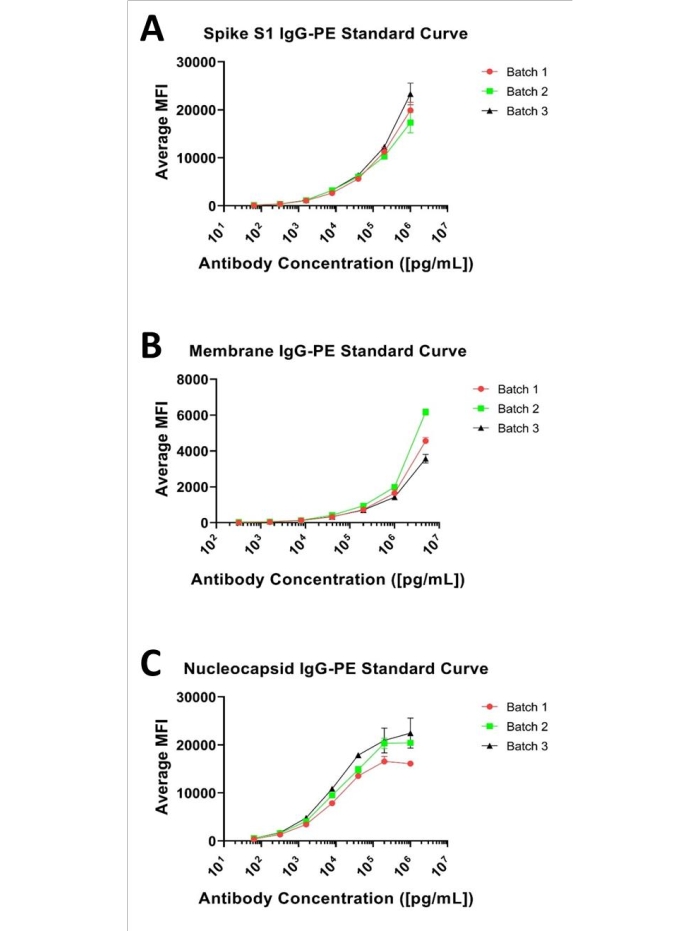
Figure 1: Representative 3-plex standard curves. Representative standard curves for the three analytes; presented as a 7-point, 1:5 serial dilution curve starting at (A) 1 µg/mL for Spike S1, (B) 5 µg/mL for Membrane, and (C) 1 µg/mL for Nucleocapsid and antibodies. Please click here to view a larger version of this figure.
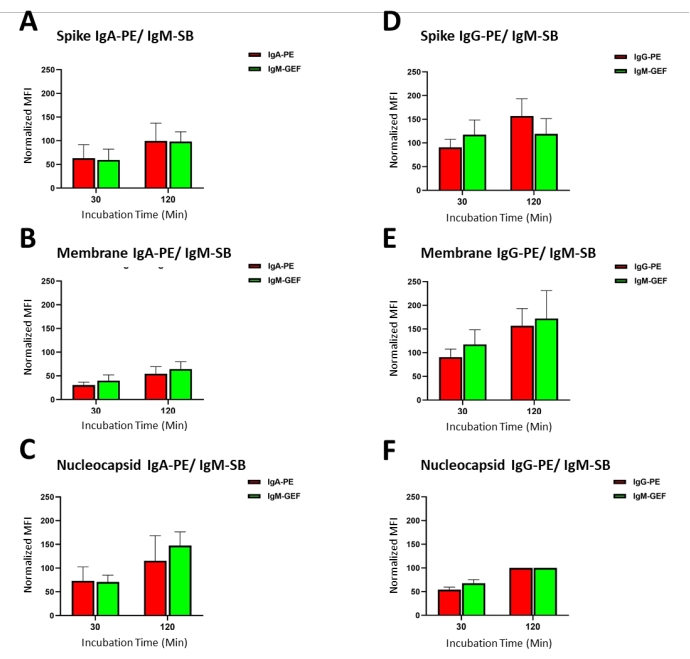
Figure 2: Primary antibody/sample incubation time optimization: The average MFI signal produced from different incubation times of primary antibody/samples (antibody capture) ranging from 30 min to 4 h for standards 1-7 (as indicated in Table 1). Please click here to view a larger version of this figure.

Figure 3: Secondary antibody concentration optimizations and dual-channel performance. Curves illustrate the average MFI (normalized to the highest recorded value in the series) produced from tested secondary antibody concentrations, ranging from 0.5-8 µg/mL. Each instance was performed both as a single- and dual-channel assay to appreciate differences in the experimental format. Please click here to view a larger version of this figure.

Figure 4: Secondary antibodies incubation time optimization, dual-channel format. Representative plots of observed MFI values (normalized to the highest recorded value in the series) with respect to time of incubation with secondary antibodies. Experiments were performed as dual-channel assays as (A-C) IgA/IgM or (D-F) IgG/IgM combinations. Please click here to view a larger version of this figure.
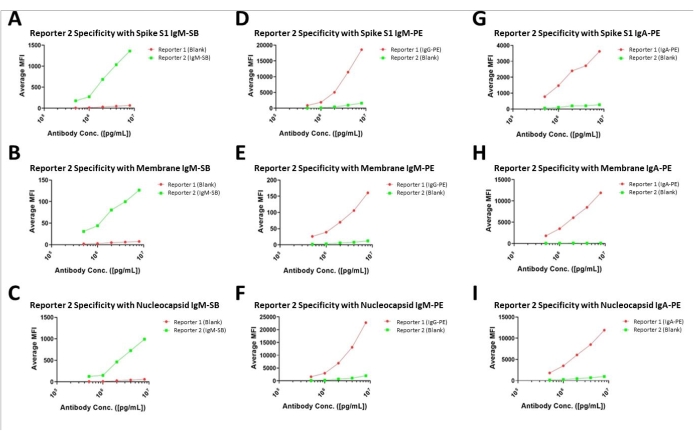
Figure 5: Specificity assessments for dual-channel assays. Assay results of the dual-channel assay format with one of each combination designated as the blank to illustrate the lack of cross-channel fluorescent or interference. Please click here to view a larger version of this figure.
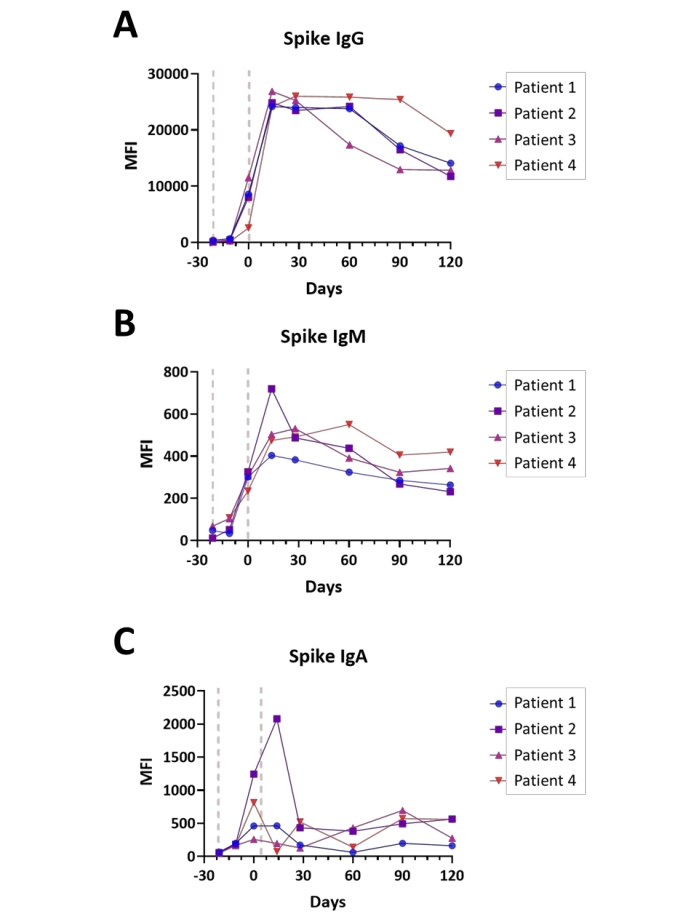
Figure 6: Illustration of seroconversion following Covid-19 vaccination. Plots illustrating the relative titers of (A) IgG, (B) IgM, and (C) IgA antibodies for the Spike S1 antigen during the course of Covid-19 vaccination (Pre-vaccination - 4 months post-completion); time is shown in days relative to completion of the vaccination series; general points of the vaccine administration are indicated (red lines). Experiments were performed in dual channel mode, as described in the Protocol. Please click here to view a larger version of this figure.
| Standard Number | Dilution series | Anti-Spike S1 or N (µg/mL) | Anti-Membrane (µg/mL) |
| Blank | Blank | - | - |
| 1 | STD7 1:1 | 1 | 5 |
| 2 | STD6 1:5 | 0.2 | 1 |
| 3 | STD5 1:25 | 0.04 | 0.2 |
| 4 | STD4 1:125 | 0.008 | 0.04 |
| 5 | STD3 1:625 | 0.0016 | 0.008 |
| 6 | STD2 1:3125 | 0.00032 | 0.0016 |
| 7 | STD1 1:15625 | 0.000064 | 0.00032 |
Table 1: Dilution series for standard curves: Table of dilution factors used for the standard curves for the IgG serotype; presented as a 7-point, 1:5 serial dilution curve starting at 1 µg/mL for α-Spike S1 and α-Nucleocapsid and 5 µg/mL for α-Membrane antibodies.
| Analyte | Sample | Rep 1 | Rep 2 | Rep 3 | Rep 4 | Ave | SD | %CV |
| Spike S1 | STD2 | 369.4 | 356.9 | 295.2 | 271.5 | 323.3 | 47.4 | 14.6 |
| STD5 | 3869.1 | 3437 | 3970.2 | 4240.7 | 3879.3 | 334 | 8.6 | |
| Membrane | STD2 | 40.6 | 37.7 | 49.9 | 27.8 | 39 | 9.1 | 23.3 |
| STD5 | 733.2 | 731.3 | 724 | 678.1 | 716.7 | 26 | 3.6 | |
| Nucleocapsid | STD2 | 1746.7 | 1790.8 | 1577.3 | 1664.8 | 1694.9 | 94.2 | 5.6 |
| STD5 | 15598.1 | 14735.5 | 18369.5 | 17408.5 | 16527.9 | 1657.7 | 10 |
Table 2: Intra-assay precision: Percent coefficient of variance (%CV) calculated from four replicates of standard antibody mixtures at standard 2 (STD2) and standard 5 (STD5) with a single assay batch in the same experiment. Values provided for replicates and averages represent the observed MFI values.
| Analyte | Sample | Batch 1 | Batch 2 | Batch3 | Ave | SD | %CV |
| Spike S1 | STD2 | 383.2 | 424.4 | 379.9 | 395.8 | 24.8 | 6.3 |
| STD5 | 5639.7 | 6062.5 | 6384.3 | 6028.8 | 373.4 | 6.2 | |
| Membrane | STD2 | 39.1 | 58.5 | 59.1 | 52.2 | 11.4 | 21.8 |
| STD5 | 732.3 | 941.4 | 701.1 | 791.6 | 130.7 | 16.5 | |
| Nucleocapsid | STD2 | 1342.6 | 1621 | 1718.2 | 1560.6 | 195 | 12.5 |
| STD5 | 13543.9 | 14843.2 | 17883.4 | 15423.5 | 2227.2 | 14.4 |
Table 3: Inter-assay precision with standard samples: Percent coefficient of variance (%CV) calculated from three distinct batches of assays, evaluated at standard 2 and standard 5 in the same experiment. Values provided for replicates and averages represent the observed MFI values.
| IgG-PE | IgM-SB | IgA-PE | |||||
| Ave. MFI | %CV | Ave. MFI | %CV | Ave. MFI | %CV | ||
| Spike S1 | Subject 1 | 8002.3 | 17.7 | 1949.5 | 1.3 | 2045.8 | 5.5 |
| Subject 2 | 19155.8 | 7.3 | 918.6 | 4.1 | 1684.5 | 3.9 | |
| Subject 3 | 17865.6 | 18.0 | 549.4 | 3.8 | 961.3 | 8.1 | |
| Subject 4 | 11901.1 | 2.6 | 1603 | 4.8 | 8736.4 | 5.5 | |
| Subject 5 | 9801.8 | 4.0 | 1014.1 | 3.0 | 2747.6 | 9.3 | |
| Nucleocapsid | Subject 1 | 15097.8 | 11.3 | 1049.7 | 9.9 | 5276.5 | 3.9 |
| Subject 2 | 15204.3 | 12.1 | 265.9 | 5.2 | 6761.3 | 11.9 | |
| Subject 3 | 18471.7 | 24.4 | 329.1 | 4.5 | 14308 | 2.9 | |
| Subject 4 | 16424.7 | 3.5 | 2418.1 | 0.1 | 4234.7 | 4.2 | |
| Subject 5 | 13344.9 | 3.6 | 225.6 | 10.0 | 13436.5 | 9.7 | |
| Membrane | Subject 1 | 514.6 | 8.6 | 180.6 | 14.0 | 141.2 | 9.8 |
| Subject 2 | 196.8 | 5.2 | 57 | 20.7 | 55.5 | 13.0 | |
| Subject 3 | 553.7 | 12.9 | 54.5 | 21.2 | 191.2 | 18.6 | |
| Subject 4 | 377.9 | 3.2 | 68.1 | 22.1 | 62 | 2.3 | |
| Subject 5 | 325.4 | 8.2 | 11.4 | 91.6 | 74.6 | 20.8 |
Table 4: Inter-assay precision with human samples: Average percent coefficient of variance (%CV) calculated from three batches of assays tested with plasma samples (diluted 500-fold) from five human subjects with SARS-CoV-2 infections.
| Spike S1 | Membrane | Nucleocapsid | |||||
| µg/mL | Ave. MFI | % Max. | Ave. MFI | % Max. | Ave. MFI | % Max. | |
| IgM | 0.5 | 186 | 13.2 | 32 | 25.2 | 132.7 | 13.6 |
| 1 | 304.2 | 21.6 | 45.8 | 36 | 194.4 | 19.9 | |
| 2 | 664.5 | 47.2 | 78.8 | 61.9 | 458.2 | 47 | |
| 4 | 1032.1 | 73.3 | 101.3 | 79.6 | 707.8 | 72.6 | |
| 8 | 1407.1 | 100 | 127.2 | 100 | 975 | 100 | |
| IgG | 0.5 | 809.7 | 4.9 | 27.5 | 15 | 1355.6 | 6.3 |
| 1 | 1696.9 | 10.2 | 40.6 | 22.2 | 2782.1 | 13 | |
| 2 | 4543.8 | 27.3 | 68.3 | 37.3 | 6661.2 | 31.2 | |
| 4 | 10003.5 | 60 | 110.7 | 60.5 | 12605.6 | 59 | |
| 8 | 16662.8 | 100 | 182.9 | 100 | 21360.6 | 100 | |
| IgA | 0.5 | 797.4 | 19.3 | 31.1 | 47.2 | 2056.5 | 16.1 |
| 1 | 1529.5 | 37 | 41.4 | 62.8 | 3869 | 30.4 | |
| 2 | 2261.3 | 54.7 | 48.6 | 73.3 | 6648.9 | 52.2 | |
| 4 | 2320.4 | 56.2 | 48.3 | 73.2 | 6548.1 | 51.4 | |
| 8 | 4132.2 | 100 | 65.9 | 100 | 12744.8 | 100 | |
Table 5: Secondary antibody concentration optimization: The average MFI signal produced from different concentrations of secondary antibodies ranging from 0.5 µg/mL to 8 µg/mL. The value of each signal is also presented as a percentage of the signal at 8 µg/mL ("Max.") to demonstrate relative signal magnitude.
| Spike S1 | Membrane | Nucleocapsid | |||||
| Incubation time (min.) | Ave. MFI | % Max. | Ave. MFI | % Max. | Ave. MFI | % Max. | |
| IgM | 15 | 1185 | 72.2 | 40.4 | 48.9 | 609.5 | 53.3 |
| 30 | 1416.6 | 86.3 | 58.4 | 70.7 | 894.2 | 78.2 | |
| 60 | 1324.8 | 80.7 | 73.6 | 89.1 | 945.6 | 82.7 | |
| 120 | 1641.2 | 100 | 82.6 | 100 | 1143.2 | 100 | |
| IgG | 15 | 12917.6 | 80.5 | 244.4 | 44.9 | 15429.8 | 80.8 |
| 30 | 14915.4 | 92.9 | 434.7 | 79.9 | 18797 | 98.5 | |
| 60 | 15340.3 | 95.6 | 421.4 | 77.5 | 18694.4 | 97.9 | |
| 120 | 16050.3 | 100 | 544 | 100 | 19085.8 | 100 | |
| IgA | 15 | 3141.9 | 78.2 | 75 | 66.8 | 9103 | 86.6 |
| 30 | 3569.1 | 88.8 | 83.9 | 74.8 | 9563.8 | 91 | |
| 60 | 3539.1 | 88 | 86 | 76.6 | 9555.7 | 90.9 | |
| 120 | 4020 | 100 | 112.2 | 100 | 10512.9 | 100 |
Table 6: Secondary antibody incubation time optimization: The average MFI signal produced from different incubation times of secondary antibodies ranging from 15 min to 120 min. The value of each signal is also represented as a percentage of the signal at 120 min ("Max.") to demonstrate relative signal magnitude.
Discussion
The appreciation of an immune response to SARS-CoV-2 exposure, in conjunction with RT-PCR-based surveillance of infection status, has been well described as a prescription to clarify the course of recovery from Covid-19, to serve as a means to identify convalescent plasma with potential therapeutic value, and to survey infection rates on a population-scale basis10,11. Different examples to understanding seroconversion in human subjects include protein (antigen) arrays12, immunoblots13, rapid immunochromatographic constructs14, and enzyme-linked immunosorbent assays (ELISAs)15,16,17. Each of these aforementioned techniques can assess multiple immunoglobulin isotypes individually with minor modifications. These procedures, however, are not capable of being practically repurposed to permit parallel analysis of multiple isotypes, as presented in this manuscript, rendering cost and throughput factors as limitations for their administration on a population-based scale testing strategy. Several of these applications also provide the opportunity to concatenate levels of multiple antigens in parallel either as presented or in altered formats, such as a multiplex ELISA18,19. Finally, the immunobead platform supplies the possibility to evaluate levels of multiple antigens in parallel20,21 but has been limited to a single epitope (i.e., immunoglobulin isotype) per assay unless, however, the recent instrument with 'dual-channel' assay capabilities is employed.
In this report, protocols are enumerated which establish the reliable measurement of multiple epitopes in an immunobead assay using the instrument in 'dual-channel' mode in a case study of seroconversion of Covid-19-vaccinated individuals. The method demonstrated excellent precision (%CV values typically <20%) using manual assay designs that may be improved with the integration of laboratory automated systems. Assay sensitivity and dynamic range for all selected analytes and epitopes were suitable for routine evaluations. Although the lack of commercially-available anti-antigen IgA and IgM immunoreagents limited quantitation to the IgG isotype, such a restriction does not preclude the capability to offer semi-quantitative assessments or assessments relative to a specific specimen as a calibrant22,23.
The validated immunobead assay was allocated to investigate seroconversion in a cohort of individuals immunized with the Covid-19 vaccine. Contrasted against other similar platforms, the family of instrumentation allows the prospecting of seroconversion in hundreds of individuals per day in a manual workflow and thousands per day in an automated scheme. Overall, these findings confirm that the 'dual-channel' approach has appropriate sensitivity for the description of multiple epitopes in parallel for the identical assay and is viable in a multianalyte context. A difference in sensitivities to channel 1 and channel 2, as performed with phycoerythrin and Super Bright 436 fluorophores, respectively, may warrant the design of a specific experiment to ensure viable analytical results are acquired for a given experiment. That is, the reservation of channel 1 for epitopes or analytes of a lower prevalence may be necessary to maintain a dynamic range of the assay that includes the observed values of unknowns. Beyond this consideration, assay design was obvious and should be readily accessible to laboratories with limited analytical capabilities. Certainly, this consideration should be weighed when considering channel 1 to channel 2 interference, as we noted for Figure 5, whereby interference from higher abundance isotypes may cause misleading analytical errors for those in much lower abundance when measured in a dual-channel format. This potential for interference with situations with highly different analyte concentrations may represent a significant limitation to the approach if not properly handled in the assay design phase.
In conclusion, a method to rapidly measure antibody titers from the major immunoglobulin isotypes associated with an immune response to Covid-19 infection or vaccination was presented. Applying this approach in a longitudinal fashion to assess seroconversion may provide insights that could be better used to manage and/or monitor the course of the disease or, alternately, guide prospective Covid-19 booster vaccine programs.
Disclosures
Dr. Borgia is the inventor of the serological test used in this manuscript which is patent pending. The article is presented in a descriptive manner only with no statistical analyses presented to avoid potential bias introduced by author conflict.
Acknowledgements
The authors wish to thank the Rush Biomarker Development Core for the use of their facilities, the Rush Biorepository for subject enrollment and biospecimen processing, and the Walder Foundation's Chicago Coronavirus Assessment Network (Chicago CAN) Initiative grant numbers SCI16 (J.R.S. and J.A.B.) and 21-00147 (J.R.S. and J.A.B.) and an award from the Swim Across America Foundation (J.A.B.).
Materials
| Name | Company | Catalog Number | Comments |
|---|---|---|---|
| 384-well black side polystyrene microtiter plates | Thermo Fisher | 12-565-346 | |
| Activation buffer (0.1 M NaH2PO4, pH 6.2) | Prepared in house | ||
| Assay buffer (PBS, 1% Bovine Serum Albumin, 0.01% Polysorbate-20) | Prepared in house | ||
| Bovine Serum Albumin, heat shock fraction | MilliporeSigma | A-7888-50G | |
| Coupling buffer (50 mM MES, pH 5.0) | Prepared in house | ||
| COVID 19 M Coronavirus Recombinant Matrix Protein (6xHis tag) | MyBioSource | MBS8574735 | |
| Disposable pipette tips | |||
| EDC (1-Ethyl-3-[3-dimethylaminopropyl]carbodiimide hydrochloride) | Thermo Fisher | PIA35391 | |
| Goat Albumin, Fraction V Powder | MilliporeSigma | A2514-1G | |
| IgA Goat anti-Human, R-PE, Polyclonal | Thermo Fisher | OB205009 | |
| IgG Goat anti-Human, R-PE, Polyclonal | Thermo Fisher | OB204009 | |
| IgG Goat anti-Rabbit, R-PE, Polyclonal | Thermo Fisher | OB403009 | |
| IgM Goat anti-Human, R-PE, Polyclonal | Thermo Fisher | OB202009 | |
| IgM Mouse anti-Human, SB 436, Clone SA-DA4 | Thermo Fisher | 62999842 | |
| Instrument Analyzer | Luminex Corp. | INTELLIFLEX-RUO | |
| Low-Bind microcentrifuge tubes (1.5 mL) | Thermo Fisher | 13-698-794 | |
| MagPlex-C Microspheres, Region XXX | Luminex Corp. | MC10XXX-01 | |
| MES hydrate (2-(N-Morpholino) ethane sulfonic acid hydrate) | MilliporeSigma | M2933 | |
| Microplate aluminum sealing tape | Thermo Fisher | 07-200-683 | |
| Polysorbate-20 | Thermo Fisher | BP337-500 | |
| Quality Biological Inc. PBS, pH 7.2 | Thermo Fisher | 50-751-7328 | |
| Quench buffer (PBS, 1% Goat Serum Albumin, 0.01% Polysorbate-20) | Prepared in house | ||
| SARS-CoV-2 (2019-nCoV) Nucleocapsid Protein (His tag) | Sino Biologicals | 40588-V08B | |
| SARS-CoV-2 (2019-nCoV) Spike Protein (S1 Subunit, His tag) | Sino Biologicals | 40591-V08H | |
| SARS-CoV-2 (2019-nCoV) Spike RBD Antibody, Rabbit pAb | Sino Biologicals | 40592-T62 | |
| SARS-CoV-2 (2019-nCoV) Nucleocapsid Antibody, Rabbit mAb | Sino Biologicals | 40588-R0004 | |
| SARS-CoV-2 (COVID-19) Membrane Antibody (IN), Rabbit pAb | ProSci | 10-516 | |
| Sulfo-NHS (N-hydroxysulfosuccinimide) | Thermo Fisher | PIA39269 | |
| Wash Buffer (PBS, 0.01% Polysorbate-20) | Prepared in house | ||
| Water, LC/MS grade | Thermo Fisher | W-64 |
References
- Tighe, P. J., Ryder, R. R., Todd, I., Fairclough, L. C. ELISA in the multiplex era: potentials and pitfalls. Proteomics - Clinical Applications. 9, 406-422 (2015).
- Baker, H. N., Murphy, R., Lopez, E., Garcia, C. Conversion of a capture ELISA to a Luminex xMAP assay using a multiplex antibody screening method. Journal of Visualized Experiments: JoVE. (65), e4084(2012).
- Powell, R. L., et al. A multiplex microsphere-based immunoassay increases the sensitivity of siv-specific antibody detection in serum samples and mucosal specimens collected from rhesus macaques infected with SIVmac239. BioResearch Open Access. 2 (3), 171-178 (2013).
- Volpetti, F., Garcia-Cordero, J., Maerkl, S. J. A microfluidic platform for high-throughput multiplexed protein quantitation. PLoS One. 10 (2), 0117744(2015).
- Rabi, F. A., Al Zoubi, M. S., Kasasbeh, G. A., Salameh, D. M., Al-Nasser, A. D. SARS-CoV-2 and coronavirus disease 2019: What we know so far. Pathogens. 9 (3), 231(2020).
- Asif, M., Xu, Y., Xiao, F., Sun, Y. Diagnosis of COVID-19, vitality of emerging technologies and preventive measures. Chemical Engineering Journal. 423, Lausanne, Switzerland. 130189(2021).
- La Marca, A., Capuzzo, M., Paglia, T., Roli, L., Trenti, T., Nelson, S. M. Testing for SARS-CoV-2 (COVID-19): a systematic review and clinical guide to molecular and serological in-vitro diagnostic assays. Reproductive Biomedicine Online. 41 (3), 483-499 (2020).
- Armbruster, D. A., Pry, T. Limit of blank, limit of detection and limit of quantitation. The Clinical Biochemist. Reviews. 29, Suppl 1 49-52 (2008).
- Tarhoni, I., et al. Relationship between circulating tumor-associated autoantibodies and clinical outcomes in advanced-stage NSCLC patients receiving PD-1/-L1 directed immune checkpoint inhibition. Journal of Immunological Methods. 490, 112956(2021).
- Deeks, J. J., et al. Antibody tests for identification of current and past infection with SARS-CoV-2. The Cochrane Database of Systematic Reviews. 6, 013652(2020).
- Mahalingam, S., et al. Landscape of humoral immune responses against SARS-CoV-2 in patients with COVID-19 disease and the value of antibody testing. Heliyon. 7 (4), 06836(2021).
- Ruano-Gallego, D., et al. A multiplex antigen microarray for simultaneous IgG and IgM detection against SARS-CoV-2 reveals higher seroprevalence than reported. Microbial Biotechnology. 14 (3), 1228-1236 (2021).
- Shah, J., et al. IgG and IgM antibody formation to spike and nucleocapsid proteins in COVID-19 characterized by multiplex immunoblot assays. BMC Infectious Diseases. 21 (1), 325(2021).
- Gambino, C. M., et al. Comparison of a rapid immunochromatographic test with a chemiluminescence immunoassay for detection of anti-SARS-CoV-2 IgM and IgG. Biochemia Medica (Zagreb). 30 (3), 030901(2020).
- Algaissi, A., et al. SARS-CoV-2 S1 and N-based serological assays reveal rapid seroconversion and induction of specific antibody response in COVID-19 patients. Scientific Reports. 10, 16561(2020).
- Chiereghin, A., et al. Recent advances in the evaluation of serological assays for the diagnosis of SARS-CoV-2 infection and COVID-19. Frontiers in Public Health. 8, 620222(2020).
- Nicol, T., et al. Assessment of SARS-CoV-2 serological tests for the diagnosis of COVID-19 through the evaluation of three immunoassays: Two automated immunoassays (Euroimmun and Abbott) and one rapid lateral flow immunoassay (NG Biotech). Journal of Clinical Virology: The Official Publication of the Pan American Society for Clinical Virology. 129, 104511(2020).
- Butt, J., et al. From multiplex serology to serolomics-A novel approach to the antibody response against the SARS-CoV-2 proteome. Viruses. 13 (5), 749(2021).
- Byrum, J. R., et al. multiSero: open multiplex-ELISA platform for analyzing antibody responses to SARS-CoV-2 infection. medRxiv. , (2021).
- Dobano, C., et al. Highly sensitive and specific multiplex antibody assays to quantify immunoglobulins m, a, and g against SARS-CoV-2 antigens. Journal of Clinical Microbiology. 59 (2), 01731(2021).
- Schultz, J. S., et al. Development and validation of a multiplex microsphere immunoassay using dried blood spots for SARS-CoV-2 seroprevalence: Application in first responders in first responders in Colorado, USA. Journal of Clinical Microbiology. 59 (6), 00290(2021).
- Beavis, K. G., et al. Evaluation of the EUROIMMUN anti-SARS-CoV-2 ELISA assay for detection of IgA and IgG antibodies. Journal of Clinical Virology: The Official Publication of the Pan Americal Society for Clinical Virology. 129, 104468(2020).
- Jung, J., et al. Clinical performance of a semi-quantitative assay for SARS-CoV2 IgG and SARS-CoV2 IgM antibodies. Clinica Chimica Acta: International Journal of Clinical Chemistry. 510, 790-795 (2020).
Reprints and Permissions
