The comet assay is a popular means of detecting DNA damage. This study describes an approach to running slides in representative variants of the comet assay. This approach significantly increased the number of samples while decreasing assay run-time, the number of slide manipulations, and the risk of damage to gels.
Method Article
A High-Throughput Comet Assay Approach for Assessing Cellular DNA Damage
* These authors contributed equally
In This Article
Summary
Abstract
Cells are continually exposed to agents arising from the internal and external environments, which may damage DNA. This damage can cause aberrant cell function, and therefore DNA damage may play a critical role in the development of, conceivably, all major human diseases, e.g., cancer, neurodegenerative and cardiovascular disease, and aging. Single-cell gel electrophoresis (i.e., the comet assay) is one of the most common and sensitive methods to study the formation and repair of a wide range of types of DNA damage (e.g., single- and double-strand breaks, alkali-labile sites, DNA-DNA crosslinks, and, in combination with certain repair enzymes, oxidized purines, and pyrimidines), in both in vitro and in vivo systems. However, the low sample throughput of the conventional assay and laborious sample workup are limiting factors to its widest possible application. With the "scoring" of comets increasingly automated, the limitation is now the ability to process significant numbers of comet slides. Here, a high-throughput (HTP) variant of the comet assay (HTP comet assay) has been developed, which significantly increases the number of samples analyzed, decreases assay run time, the number of individual slide manipulations, reagent requirements, and risk of physical damage to the gels. Furthermore, the footprint of the electrophoresis tank is significantly decreased due to the vertical orientation of the slides and integral cooling. Also reported here is a novel approach to chilling comet assay slides, which conveniently and efficiently facilitates the solidification of the comet gels. Here, the application of these devices to representative comet assay methods has been described. These simple innovations greatly support the use of the comet assay and its application to areas of study such as exposure biology, ecotoxicology, biomonitoring, toxicity screening/testing, together with understanding pathogenesis.
Introduction
Cells are exposed continually to agents arising from the internal and external environments, which can damage DNA1,2. This damage can cause aberrant cell function3, and therefore DNA damage may play a critical role in the development of many major human diseases, e.g., cancer, neurodegenerative and cardiovascular disease, and aging4. The comet assay (also called single-cell gel electrophoresis) is an increasingly popular method for detecting and quantifying cellular DNA damage.
At its simplest, the alkaline comet assay (ACA) detects strand breaks (SB; both single and double), together with apurinic/apyrimidinic sites and alkali-labile sites (ALS) both of which become single-strand breaks under alkaline conditions5. The neutral pH comet assay can evaluate frank single- and double-strand breaks6. Furthermore, the ACA, in combination with a number of DNA repair enzymes, can detect a considerable range of types of DNA damage, e.g., oxidized purines (identified by the use of human 8-oxoguanine DNA glycosylase 1; hOGG17); oxidized pyrimidines (using Endonuclease III; EndoIII) and cyclobutane pyrimidine dimers (using T4 endonuclease V; T4endoV)8. The comet assay can also be used to evaluate DNA lesions induced by crosslinking agents, such as cisplatin9,10,11. As indicated by the assay's formal name, i.e., single cell gel electrophoresis, the assay relies upon the cells under analysis being a single cell suspension; most commonly, these are cultured cells but may be isolated from whole blood12,13, or whole blood itself can be used14,15. Alternatively, a single cell suspension may be generated from solid tissues.
Apart from a few exceptions, most notably the CometChip reports from the Engleward lab16, the overall comet assay protocol has not changed dramatically from that originally described by the assay's inventors (Östling and Johansson17 and Singh et al.18). The comet assay involves numerous steps (Figure 1). Many of these steps involve the transfer of the thin, cell-containing agarose gels, one slide at a time, and, therefore, pose a risk of damage or loss of the gel, jeopardizing the experiment's success. Consequently, the comet assay can be time-consuming, particularly if a significant number of slides are being run. Typically, a maximum of 40 slides are run in a large (33 cm x 59 cm x 9 cm) electrophoresis tank, which sits within an even larger tray containing wet ice for cooling. It has been recently reported that the assay runtime can be shortened to 1 day by decreasing the duration of the lysis step and not drying the slides before staining19.
The present authors have previously reported a novel approach to the high throughput alkaline comet assay (HTP ACA), in which multiple (batches of 25) comet assay microscope slides can be manipulated simultaneously throughout the comet assay process20,21,22. This patented approach minimizes the risk of damage to, or loss of, the sample-containing gels by removing the need to manipulate the microscope slides individually and can be applied to all variants of the comet assay, which use microscope slides. The slide-containing racks protect the gels during the manipulations, and consequently, the sample processing is quicker and more efficient. The slides can also undergo electrophoresis in the racks, held in the vertical, rather than horizontal, orientation. This, and integral cooling, significantly decrease the footprint of the electrophoresis tank and removes the need for wet ice. Taken together, this represents a significant improvement over the conventional procedure. The equipment used is illustrated in Figure 2. The protocols described here, using this novel approach, demonstrate the representative application to cultured cells and whole blood14 for detection of alkali-labile sites (ALS), DNA inter-strand crosslinks (ICL), and the substrates of various DNA repair enzymes.
Protocol
Commercially available blood samples were used in the present study. At our institution, Institutional Review Board approval is not needed for the use of commercially available blood.
1. Preparation of materials for the comet assay
- Preparation of the microscope slides
- Pour 1% (w/v) normal melting point agarose [dissolved in double-distilled water (ddH2O)] in a 50 mL tube and microwave to dissolve the agarose in the ddH2O. Store at 37 °C to prevent solidification prior to coating slides. Should solidification occur, discard and prepare fresh.
- Pre-coat microscope slides by dipping the slides into the 50 mL tube containing 1% (w/v) normal melting point agarose.
- Wipe the back of the slides quickly after dipping the slides.
NOTE: Failure to wipe the back of the slides properly will increase the background noise of the slides during the analysis step by microscope. - Label the coated slide with a permanent marker on the bottom-right corner of the frosted section (Figure 3A). This shows which side of the slide is pre-coated.
- Allow the agarose to set and dry overnight at room temperature.
- Wrap the dried slides in tissue paper and store them in a box.
2. Preparation of samples
- Cultured cells
NOTE: Firstly, treat cells with the damaging agent(s) prior to starting the comet assay. Then, perform the following.- If the cells are adherent, trypsinize the cells to release them from the cell culture flask or cell culture Petri dishes, at the appropriate confluency of cells. Neutralize trypsin by adding serum-containing media.
- Transfer the cells to a 50 mL tube, centrifuge (e.g., for HaCaTs, centrifuge at 300 x g for 5 min at room temperature), gently remove the supernatant, and add 1 mL of PBS to the cell pellet.
- Perform cell counting.
- Transfer 30,000 cells to a 1.5 mL microcentrifuge tube and centrifuge at 7,607 x g for 5 min at 4 °C.
- Gently remove the supernatant and store the cell pellet on ice in the dark prior to performing the comet assay.
NOTE: Cells should regularly be tested for Mycoplasma contamination prior to performing the comet assay to prevent, among other effects, the formation of artefactual DNA damage and altered DNA damage response, as reported elsewhere23. Centrifugation conditions may be changed, as needed, depending on the cell type used.
- Preparation of cultured cells for repair assay
- Culture cells in the cell culture flask or Petri dishes.
- Wash the cells with 1 mL of PBS twice prior to treating the cells with damaging agents (e.g., for BE-M17 cells, treat with 50 µM of H2O2 for 20 min) on ice to prevent the repair from occurring during the treatment.
- Wash the cells gently with 1 mL of PBS twice to remove any residual damaging agents.
- Re-introduce the cell culture medium and allow the cells to repair for varying durations (e.g., 0 min, 30 min, 2 h, 6 h, 24 h, and 30 h) in a humidified incubator (37 °C, 5% CO2).
- At each time point, collect 30,000 cells in 10% dimethyl sulfoxide (DMSO)-containing cell culture medium and store them at -80 °C.
- Before performing the comet assay, thaw the cells quickly at 37 °C in a water bath and centrifuge them at 7,607 x g for 5 min at 4 °C.
- Remove the supernatant and store the cell pellet on ice prior to performing the assay (i.e., from step 3).
- Preparation of whole blood
NOTE: The following method benefits from (i) being a minimally invasive approach to obtain a blood sample, (ii) not requiring the isolation of PBMC before the comet assay, and (iii) allowing the blood samples (with a volume < 250 µL) to be stored at -80 °C, for up to 1 month (although more recent evidence suggests that longer storage is possible), without the need for cryopreservatives, and with no risk or artefactual damage formation14. Ethical approval, or equivalent, may be needed before obtaining blood samples from patients or animals. Alternatively, commercially available blood samples can be used as in the present study. At our institution, Institutional Review Board approval is not needed for the use of commercially available blood.- Using a pipette, transfer whole blood samples (<250 µL) (Table of Materials) into a collection tube containing a minimal volume containing 0.4 mg of EDTA (per 250 µL of blood).
- Freeze the blood samples at -80 °C before performing the HTP comet assay.
- Thaw stored blood samples (<250 µL) at room temperature, without heating.
- Transfer 5 µL of the whole blood to microcentrifuge tubes prior to performing the comet assay (see step 3).
3. Cell lysis
NOTE: Carry out all the procedures on ice.
- Use 12,000 cells or 2.5 µL of whole blood per gel.
- Prepare 0.6% (w/v) low melting point agarose dissolved in PBS using a microwave, and place in a water bath at 37 °C to prevent it from solidifying.
- Label the frosted end of the pre-coated slides with the investigator's name, date, and treatment information using a permanent marker or pencil.
- Place a chilling plate on a flat bench and insert the two frozen cooling packs into the sliding drawer below the metal surface (as shown in Figure 4)21.
- Place the slides on the chilling plate and allow the slides to pre-chill for 1-2 min before adding the 0.6% (w/v) low melting point agarose-containing cells (step 3.7).
NOTE: Leaving the slides on the chilling plate for more than 1-2 min may cause condensation to form on the slide surface due to ambient humidity. This may make the low melting point agarose gels less stable on the slides. - Disperse the pellet (step 2.2.7) by vortexing. Ensure that all the supernatant has been removed from the pellet. Place the sample tubes (containing the pelleted cells) immediately back on ice.
NOTE: When placing the sample-containing tubes in the centrifuge, put them with the hinge facing outward so that the pellet will be collected on this side of the tube. Sometimes it is difficult to see the pellet, and it is easy to dislodge it while removing the supernatant. Centrifuging with the tube lid in this orientation will enable one to know where the cell pellet will be. - Resuspend the cell pellet with 200 µL of 0.6% low melting point agarose (LMP agarose) and mix by pipetting up and down without creating bubbles. Next, quickly transfer 80 µL of LMP agarose-containing cells onto a chilled slide and quickly place a coverslip onto the gel.
- Allow the gel to set on the chilling plate for 1-2 min.
- Meanwhile, prepare a 500 mL working solution of lysis buffer (Table 1) and pour it into the lysis dish (Figure 2).
- Once the gels have been set, remove the coverslips quickly by gently holding the slide between thumb and forefinger and sliding the coverslip off the gel.
- Place the slides containing samples inside the slide carrier (all the black "dot" marks on slides should be facing in the same direction when they are placed in a carrier) (Figure 3B), and then place the slide carrier inside the lysis dish (Figure 2).
- Close the lid of the lysis dish and keep the lysis dish in the fridge overnight at 4 °C or 30 min at room temperature, whichever best suits the operator's time schedule19.
4. Electrophoresis
- Carefully remove the slide carrier from the lysis dish. Take care not to disturb the gels.
- Gently place the slide carrier in a washing dish pre-loaded with ice-cold ddH2O and leave it for 30 min ensuring that slides are completely covered with ddH2O.
- Insert a frozen cooling pack inside the sliding drawer under the electrophoresis tank to maintain optimal buffer temperature.
- Carefully add ice-cold electrophoresis working solution (Table 1) to the electrophoresis tank and transfer the slide carrier into the electrophoresis tank. Orientate the slides such that their clear parts with the cell-containing gels (i.e., NOT the frosted/labeling ends) point toward the cathode (red electrode).
- Allow the slides to sit in the electrophoresis tank for 20 min so that the DNA relaxes and unwinds. Keep the power supply swtiched off during this step.
- If needed, insert a new frozen cooling pack to maximize chilling.
- Perform electrophoresis for 20 min at 1.19 V/cm, or whatever conditions have been optimized.
NOTE: Optimization of electrophoresis running conditions and volume of buffer is recommended for every laboratory24. Using only a single slide carrier during electrophoresis does not cause any effect of slides on the resistance of the electrophoresis buffer, and the authors did not see a significant effect in the voltage or current when the number of the slides changed. - Switch off the power supply, carefully remove the slide carrier from the electrophoresis tank, and allow it to drain on tissue paper for 30 s.
- Place the slide carrier into the dish containing neutralization buffer (Table 1). Leave it for 20 min.
- Remove the slide carrier from the neutralization dish, place it in the washing dish containing ice-cold ddH2O, and leave it for 20 min.
- Remove the slide carrier from the water and allow the slides to dry in an incubator at 37 °C for 1 h, or at room temperature overnight, or do not dry, depending upon the operator's schedule19.
NOTE: If there is no drying in step 4.11, perform the staining step from 5.2.
5. Propidium iodide (PI) staining
- Transfer the slide carrier to a washing dish containing ice-cold ddH2O to rehydrate the slides and leave for 30 min.
- Place the slide carrier into a staining dish containing 2.5 µg/mL propidium iodide solution.
NOTE: Propidium iodide is light-sensitive, so handle it in a darkened area. It is also toxic. - Close the lid of the staining dish and incubate it for 20 min in the dark at room temperature.
- Transfer the slide carrier to a separate dish, and wash it with ice-cold ddH2O for 20 min.
- Remove the slide carrier from the dish and dry it completely in the dark, either in a 37 °C incubator or at room temperature, depending upon the operator's schedule or preference.
- Once the slides are fully dried, remove them from the slide carrier and store them in a slide box in the dark until ready for image analysis.
NOTE: The slides will remain readable indefinitely and can be re-stained if necessary.
6. Enzyme-modified alkaline comet assay
NOTE: The enzyme-modified alkaline comet assay employs an enzyme treatment step after lysis but before electrophoresis. The activity of the enzyme causes breaks in the DNA at sites that are substrates for the enzyme. Before performing this assay, enzyme concentration and duration of enzyme incubation must be optimized.
- After the cell lysis (step 3), wash slides twice with ice-cold ddH2O for 20 min each.
- Remove the slide carrier from the water and transfer the slides to a tray lined with paper towels.
- Add 80 µL of the enzyme at the optimized concentration (e.g., 3.2 U/mL of hOGG1 for BE-M17 cells, diluted in enzyme reaction buffer) and cover with a coverslip to spread the enzyme over the gel-containing sample.
- Incubate the slides at 37 °C for the optimized duration (e.g., 45 min for hOGG1).
- After incubation, remove the coverslips gently and transfer the slides to the carrier.
NOTE: Do not wash the slides after enzyme treatment; directly perform electrophoresis from step 4.3.
7. DNA inter-strand crosslinks (ICL)-modified alkaline comet assay
NOTE: The concept of this variant of the ICL-ACA is that the presence of ICL in DNA will retard the electrophoretic migration of damaged DNA, induced following exposure to an oxidatively generated insult. In this instance, the shorter the comet tail, the greater the number of ICL25,26,27,28.
- Treat cells with a reagent that induces ICL (e.g., cisplatin; see Supplementary File).
- Expose the treated cells with one of the following agents to induce sufficient strand breaks to create a suitably sized comet tail (~20% tail DNA): hydrogen peroxide (50 µM H2O2 for 30 min), ionizing radiation (2-5 Gy), or Ultraviolet B (UVB) (0.5 J/cm2).
- Additionally, produce a strand break positive control by treating a batch of cells with the same agent and dose, as used in step 7.2 (i.e., no treatment with ICL-inducing agent).
- Centrifuge the cells at 7,607 x g for 5 min, discard the supernatant, wash the cell pellet thrice with 1 mL of PBS, and process as for the alkaline comet assay (steps 3-5).
- Calculate levels of DNA inter-strand cross-linking using the formula below.
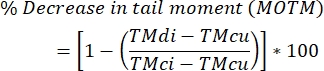
NOTE: MOTM (Mean Olive Tail Moment) is a comet assay endpoint widely used when describing the ICL-modified comet assay, and is defined as the product of the tail length and the fraction of total DNA in the tail (i.e., tail moment = tail length x % of DNA in the tail)29; TMdi: tail moment of samples treated with both crosslinking agent and H2O2 (or other strand breaker inducer); TMcu: tail moment of samples not treated with a crosslinking agent and not treated with H2O2 (no treatment), and TMci: tail moment of samples not treated with a crosslinking agent but treated with H2O2.
8. Comet scoring and data analysis
NOTE: The term "comet" derives from the images of damaged cells when viewed under a microscope after the assay has been performed (Figure 5). Under electrophoresis conditions, DNA in the undamaged cells largely does not migrate, but remains in a spheroid termed as comet "head". However, the presence of strand breaks allows the cell's DNA to migrate out of the head, and form a "tail", thus leading to an appearance like a comet (Figure 5). The more DNA in the tail, the more damage is present.
- Turn on the fluorescence microscope with the PI (red) filter (λ = 536/617 nm) and the comet assay scoring software.
- Add a drop of water using a Pasteur pipette to the gel and cover with a coverslip.
- Place the slides into the fluorescence microscope and "score" the comets.
NOTE: Scoring is a means by which the comets are assessed, to determine the amount of damage present in each comet. Broadly, this can be achieved by using two approaches, according to the user's chosen preference, either by eye (gauging the size of the comets on a scale of zero to four) or by using freely, or commercially available software30. Generally, both approaches assess the size of the comet tail, although a variety of comet-related endpoints can be determined. If using the software, click on the middle of the comet head and wait until the software detects the comet automatically, and then assesses the chosen endpoint (Figure 5). - Score 50 comets per gel and 100 comets per sample (i.e., each sample corresponding to different DNA damaging treatments, or their replicates).
- Replicate the experiments (n = 2) or triplicate the experiments (n = 3).
NOTE: If only n=2 replicate experiments are undertaken, statistical analysis cannot be performed, but if n=3, perform the D'agostino normality test. Most comet assay data does not pass a normality test. In this case, use a nonparametric test (Kruskal-Wallis test with Dunn's multiple comparisons test, and Mann-Whitney tests significance set at p < 0.05).
Results
Optimization of the electrophoresis voltage for the HTP ACA
Human keratinocytes (HaCaTs; Table of Materials) were irradiated with different doses of ultraviolet A radiation (UVA) (5 or 10 J/cm2; Figure 6A), UVB (0.5 or 1 J/cm2; Figure 6B), or treated with 50 µM H2O2 (Figure 6C) to induce damage. Three different voltages of the electrophoresis were tested to determine the optimal voltage for electrophoresis. The results from all three DNA damaging treatments revealed that, while all voltages generated linear dose-responses, the most sensitive response was obtained with 1.19 V/cm. HaCaTs showed the highest baseline DNA damage using 1.19 V/cm during electrophoresis compared to 1 V/cm and 1.09 V/cm (Figure 6A-C). In addition, using 1.19 V/cm, the greatest % tail DNA is seen, following all damaging treatments (Figure 6)31.
Detection of DNA damage in human whole blood using Fpg modified HTP ACA
Human whold blood (Table of Materials) was irradiated with different doses of 10 J/cm2 UVA to induce damage. Four different concentrations of Fpg (1, 2, 4 or 8 U/mL) were used to determine the optimal concentration for enzyme treatment in HTP ACA. The results showed that the optimal levels of DNA damage were revealed with 4 U/mL Fpg (Figure 7A). Representative comet images from UVA irradiated blood samples (Figure 7B).
Detection of DNA ICL in a representative ovarian cancer cell line using the ICL-modified HTP ACA
An ovarian cancer cell line (SKOV-3; Table of Materials) was treated with combinations of 200 µM cisplatin and/or subsequent treatment with 50 µM H2O2 for 30 min on ice. No appreciable damage was noted in the unexposed cells (Figure 8A). Exposure to H2O2 alone generated a significant MOTM (Figure 8B). In contrast, the cells in which ICL were induced showed a decreased MOTM (Figure 8C)28.
Formation and repair of cisplatin-induced DNA ICL in a representative, ovarian cancer cell line
The ICL-modified HTP ACA was used to determine the time course for DNA ICL formation and repair induced by cisplatin in an ovarian cancer cell line (A2780; Table of Materials). The cells were treated with 100 µM cisplatin for 1 h, and then incubated in cisplatin-free media (RPMI 1640 medium supplemented with 10% (v/v) fetal bovine serum (FBS)) for a subsequent time course. At various time points, the ICL-modified HTP ACA was performed to establish the levels of ICL (Figure 9)28. No ICL were detected prior to cisplatin treatment. However, after a single treatment with 100 µM cisplatin, ICL levels increased significantly, peaking at 12 h, after which levels decreased back to zero after 30 h.
Correlation between DNA ICL and DNA platinum levels
Three ovarian cancer cells were treated with 100 µM cisplatin to induce different levels of DNA-ICL, prior to analysis by the ICL-modified HTP ACA and inductively-coupled mass spectrometry (ICP-MS; see Supplementary File for details). As shown in Figure 10, differing levels of DNA-ICL were induced in the three cell lines, together with differing levels of Pt in DNA. A positive correlation (R2 = 0.9235) was observed between DNA ICL levels and platinum concentrations, indicating the association between DNA platinum levels and the corresponding ICL28.
Base excision repair in Mycoplasma-infected and uninfected BE-M17 cells
Mycoplasma infected and uninfected BE-M17 cells were treated with 50 µM H2O2 for 30 min and incubated with complete medium (Dulbecco's modified Eagle's medium supplemented with 10% (v/v) FBS) for different durations (0 min, 30 min, 1 h, 2 h, 6 h, 24 h, or 30 h) during which cells were allowed to repair. At each time point, cells were collected and frozen at -80 ˚C, in a 10% DMSO-containing medium, before performing the hOGG1-modified HTP ACA (step 6). After 30 min, levels of SB/ALS had decreased to 21% TD (percentage tail DNA) in the uninfected cells, whereas the infected cells showed 49% TD (Figure 11A). After ~15 h, levels of SB/ALS had returned to baseline in both infected and uninfected cells. For the oxidized purines, the uninfected BE-M17 initially showed a small increase in damage, before returning to baseline within 30 h (Figure 11B). In contrast, the infected cells showed a sustained, significant increase in oxidized purines, which remained elevated, and did not return to baseline levels even after 30 h (Figure 11B)23.

Figure 1: Overview of the conventional alkaline comet assay procedure. (i) A single-cell suspension of cultured cells or a sample of whole blood is mixed with 0.6% (w/v) LMP agarose. (ii) The cell/agarose mixture is applied to pre-coated microscope slides and covered with coverslip until solidified. (iii) The cells are lysed using a high pH lysis buffer overnight, forming nucleoid bodies, before (iv) washing with ddH2O. (v) The cellular DNA unwinds in the high pH electrophoresis buffer. The presence of strand breaks allows the DNA to relax and unwind, and under electrophoresis, the DNA is drawn out of the nucleoid body, forming a tail. The slides are then (vi) drained, dried, (vii) neutralized, and (viii) washed with ddH2O before (ix) being dried overnight. Slides are then (x) rehydrated with ddH2O, (xi) stained, (xii) washed, and finally (xiii) scored and analyzed, typically using fluorescent microscopy and image analysis software. This figure is reproduced from a previous publication20. Please click here to view a larger version of this figure.
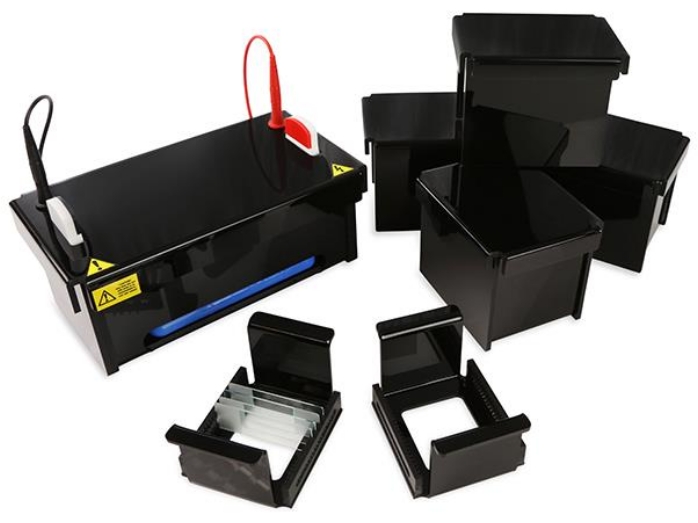
Figure 2: The materials comprising the high-throughput comet electrophoresis system. HTP electrophoresis tank, HTP racks, and the dishes for lysis, wash, neutralization, and staining are shown. Please click here to view a larger version of this figure.
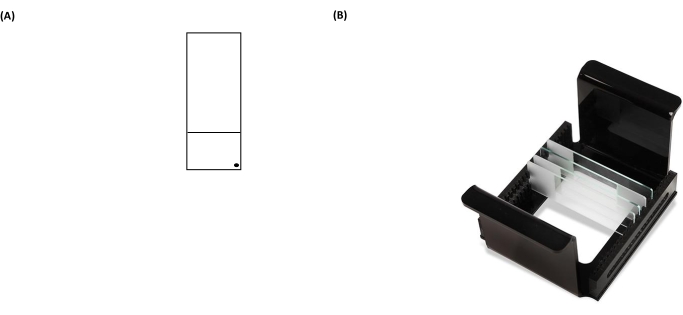
Figure 3: Representative images of a comet assay slide and HTP rack (microscope slide carrier). (A) For correct orientation, the pre-coated face of the microscope slide is recognized by a black dot in the right-hand corner of a microscope slide. (B) The image of the HTP rack illustrates how the slides are kept in a tight vertical orientation, with tabs on the carrier to fix its orientation within the electrophoresis tank. Each carrier can accommodate up to 25 slides. Please click here to view a larger version of this figure.
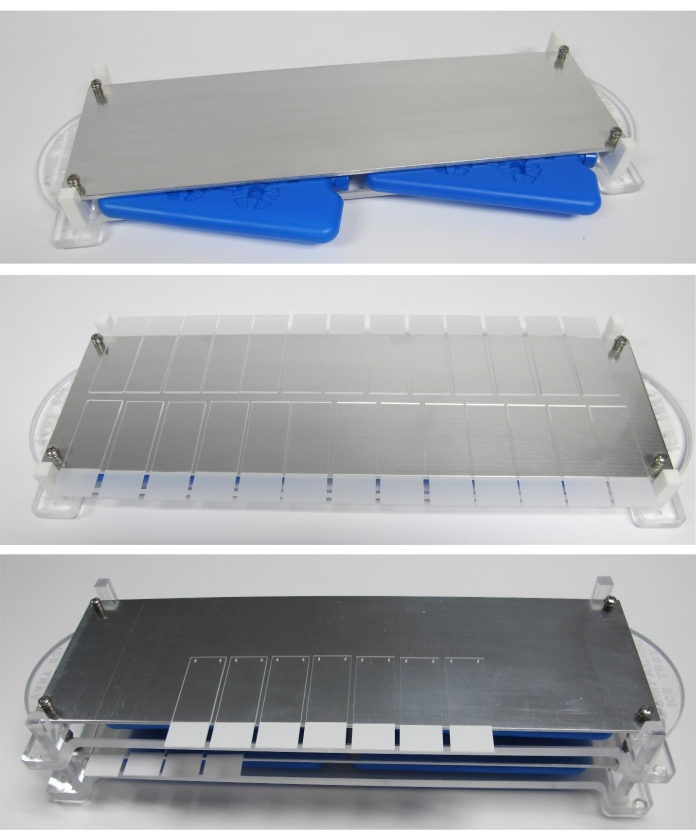
Figure 4: Representation of the chilling plate with sample slides and freezer packs in place. Please click here to view a larger version of this figure.
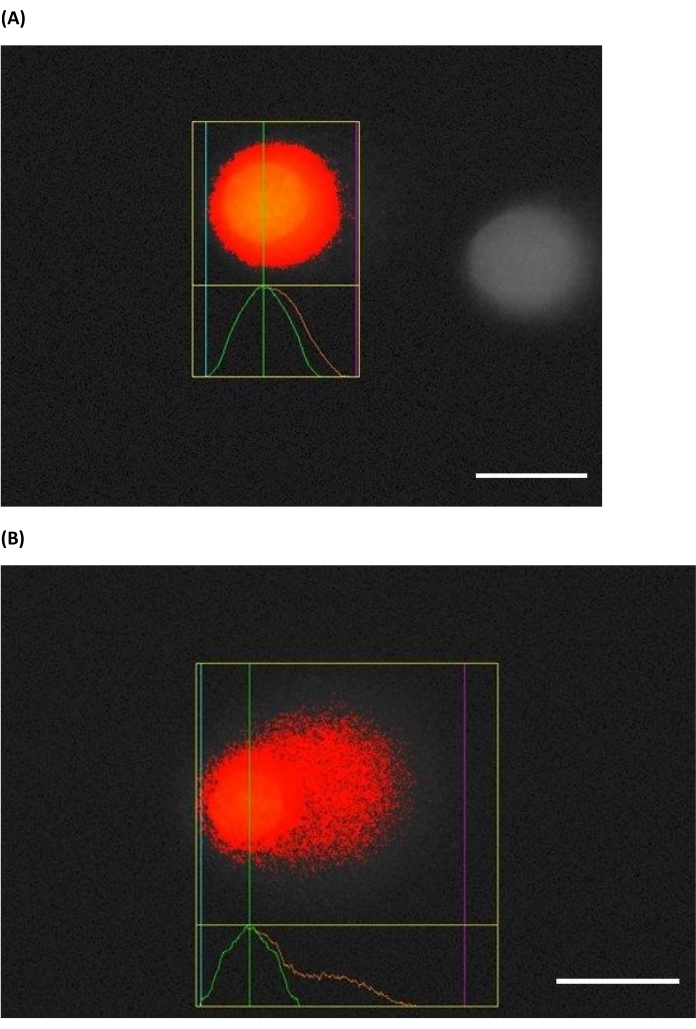
Figure 5: Screenshot of representative comets taken during scoring. HaCaTs (A) without treatment and (B) treated with 1 J/cm2 UVB prior to performing HTP ACA. Most software packages can calculate a variety of comet endpoints, but the most common ones are the % tail DNA (preferred) or tail moment based upon these images (blue: start of the head, green: middle of the head, and purple: end of tail). The scale bar is 10 µm. Please click here to view a larger version of this figure.
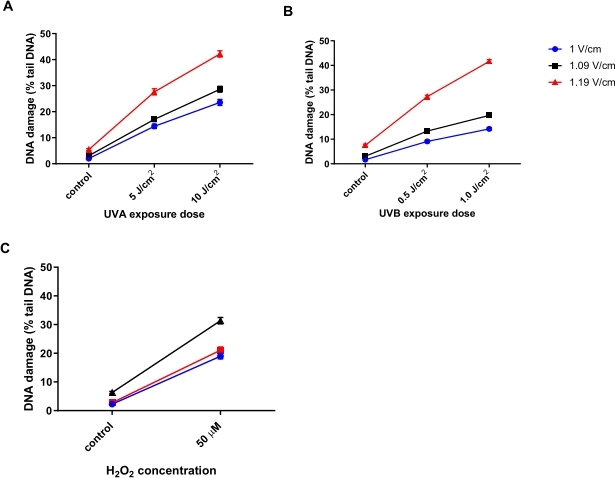
Figure 6: Representative graphs illustrating the effect of electrophoresis voltage on percentage tail DNA, determined using the HTP ACA. Cells were exposed to (A) 5 or 10 J/cm2 UVA, (B) 0.5 or 1.0 J/cm2 UVB, or (C) 50 µM H2O2 prior to the HTP ACA, with the electrophoresis voltage at either 1, 1.09, or 1.19 V/cm. Data represent the mean of 200 determinations from n = 2 duplicate experiments31. Please click here to view a larger version of this figure.

Figure 7: Representative graph and comet images of human blood analysed by the Fpg modified HTP ACA. Human blood samples were irradiated with 10 J/cm2 UVA or sham irradiated ('ctrl') on ice prior to the lysis step. Different concentrations of Fpg (1, 2, 4, or 8 U/mL) were used for the enzyme treatment prior to electrophoresis. (A) Data represent the mean ± SEM of 300 determinations from n=3 experiments. (B) Representative images of comets for each concentration of Fpg in 10 J/cm2 UVA irradiated blood samples. The scale bar is 10 µm. Please click here to view a larger version of this figure.

Figure 8: Representative comet images illustrating ICL detection following cisplatin treatment. (A) Control cells without any treatment, (B) cells which were treated with H2O2 (50 µM) only, (C) cells which were treated with H2O2 (50 µM) and cisplatin (200 µM), illustrating the tail to be shorter than in (B), due to the presence of ICL28. The scale bar is 10 µm. Please click here to view a larger version of this figure.
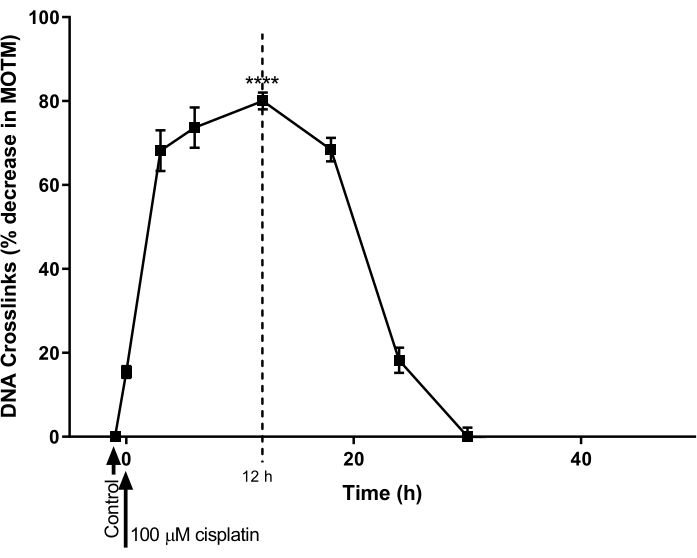
Figure 9: Demonstration of the kinetics of cisplatin-induced ICL formation and repair. A2780 cells were treated with 100 µM of cisplatin in the culture medium for 1 h. The cisplatin-containing medium was then removed, and the cells were cultured for various time points, before analysis by ICL-modified HTP ACA. Data represent mean ± SEM from n = 3 experiments28. **** P < 0.0001. Please click here to view a larger version of this figure.
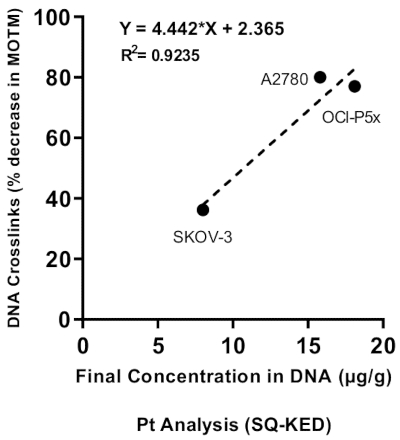
Figure 10: Correlation between DNA ICL and platinum concentration. DNA ICL were determined by the ICL-modified HTP ACA and platinum levels were measured by ICP-MS (with Single Quad-Kinetic Energy Discrimination, SQ-KED), in three ovarian cancer cell lines. R2 = 0.9235. See Supplementary File for ICP-MS methodology to quantify platinum levels in DNA28. Please click here to view a larger version of this figure.
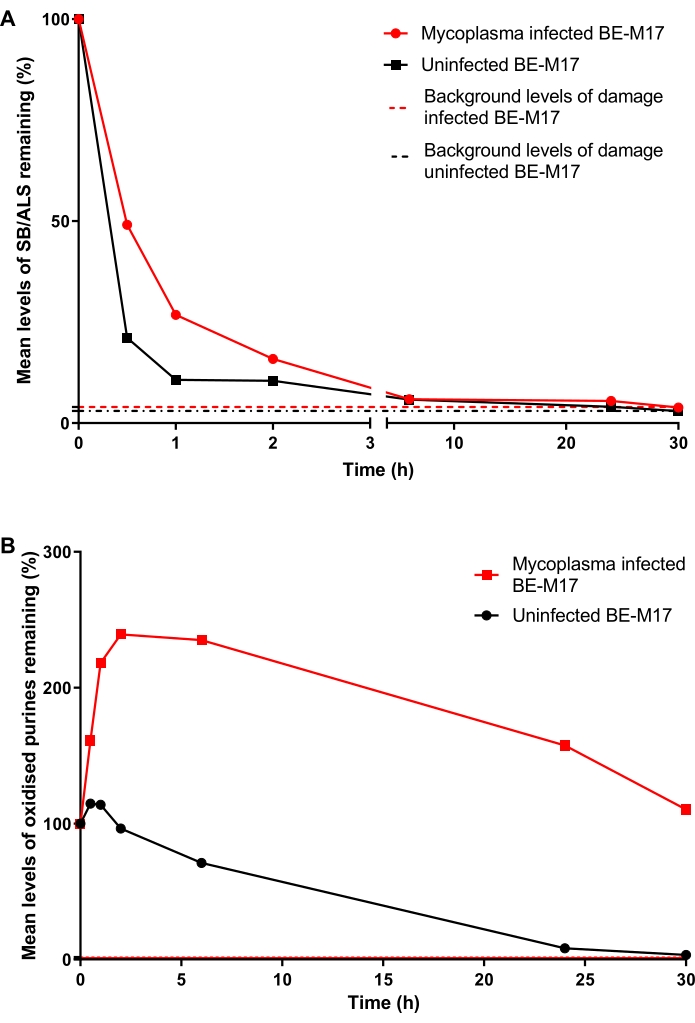
Figure 11: A representative graph illustrating DNA damage and repair, determined by the hOGG1-modified comet assay, in Mycoplasma infected versus uninfected BE-M17 cells. After treatment with 50 µM H2O2 for 30 min, cells were allowed to repair for different durations (0, 30 min, 1 h, 2 h, 6 h, 24 h, or 30 h). The hOGG1-modified HTP ACA was used to measure (A) SB/ALS and (B) oxidized purines in infected (red data points) and uninfected (black data points) BE-M17 cells. Data represent the mean of 200 determinations from n = 2 duplicate experiments. This figure is reproduced with permission from a previous publication23. Please click here to view a larger version of this figure.
| Reagent | Stock Solution | Working solution | |
| Lysis buffer | 100 mM Na2EDTA, 2.5 M NaCl, and 10 mM Tris Base in ddH2O; adjust pH to 10 with 10 M NaOH | 1% Triton X-100 in lysis stock solution | |
| Electrophoresis buffer | 10 M NaOH and 200 mM Na2EDTA in ddH2O | 300 mM NaOH and 1 mM Na2EDTA; pH > 13 | |
| Neutralization buffer | 0.4 M Tris Base in ddH2O; adjust pH to 7.5 with HCl | ||
| Staining buffer | 1 mg/mL propidium iodide | 2.5 µg/mL propidium iodide in ddH2O | |
Table 1: Composition of reagents used in HTP ACA. The stock and working concentrations of lysis, electrophoresis, neutralization, and staining buffers are shown.
Supplementary File. Please click here to download this File.
Discussion
This study demonstrates the versatility provided by the current equipment, which can be used to achieve high throughput with a variety of representative, common variants of the comet assay (i.e., alkaline, enzyme-modified, blood, and ICL, and other variants will be suitable too). In addition, the present approach brings with it several benefits20,21: (a) assay run time is decreased due to manipulation of multiple slides in parallel (handling time decreases by 60%); (b) risk of damage to gels, and hence the risk to the experiment are decreased; (c) reagent requirements are decreased (e.g., the volume of the electrophoresis tank is smaller than the conventional tank); (d) the number of slides run is increased. One tank can provide a 20% increase in the number of slides run compared to a single conventional tank; however, multiple electrophoresis tanks can be run or slaved (i.e., multiple tanks controlled by a single power supply), in parallel from the same power supply, and still require a benchtop footprint smaller than a single conventional tank with ice tray; and (e) tank footprint is decreased due to vertical orientation of slides and integral cooling (saves lab space); the HTP tank comprises a high-performance ceramic cooling base with a sliding drawer that can fit one frozen cooling pack to maintain optimal buffer temperature without having to perform the process in a cold room.
Moreover, the chilling plate developed by us accommodates 26 comet slides, enables rapid solidification of the low melting point agarose on the comet assay slides and facilitates an easy retrieval of the slides after the agarose gel is solidified. The above innovations make the comet assay process simpler and easier.
While other high-throughput approaches have been developed (e.g., 12-gel comet assay, CometChip, or 96 mini-gel formats)25, many scientists prefer using the conventional microscope slides (which includes the commercially available pre-coated slides, or other specialized slides). The present approach can accommodate all types of microscope slides, allowing experiments using these slides to be scaled up through faster slide processing and handling. As noted above, the HTP comet system brings many advantages, but there is one notable limitation: the current approach provides only a 20% increase in the number of samples run, compared to a conventional horizontal tank (although processing of slides is much faster). The CometChip and 96 mini-gel formats run a greater number of samples. To date, we do not know whether the present approach can accommodate the CometChip or 96 mini-gel formats, although we predict that it will. As noted above, the number of samples can be increased further by slaving tanks to a single power supply. As with all approaches, there is still a chance of losing or damaging the gels while loading samples and analyzing them under the microscope, but this is more due to operator error, and the chances of this are minimized with the current approach.
The use of the HTP comet system can greatly help analyze DNA damage, facilitating the use of the comet assay in a wide range of applications, such as molecular epidemiology, male reproductive science, genotoxicology studies, and environmental toxicology. This is particularly true for those users who wish to have all the benefits of improved throughput, and ease of use, without moving away from the familiar, cost-effective, conventional microscope slides.
Disclosures
Dr. Cooke and Dr. Karbaschi are inventors on three granted patents relating to the technologies described here.
Acknowledgements
The work reported in this publication was, in part, supported by the National Institute of Environmental Health Sciences of the National Institutes of Health under award number: 1R41ES030274. The content is solely the authors' responsibility and does not necessarily represent the official view of the National Institutes of Health.
Materials
| Name | Company | Catalog Number | Comments |
|---|---|---|---|
| 22 x 22 mm glass coverslips | Fisher Scientific, Hampton, NH, USA | 631-0124 | |
| A2780 | ECACC, Louis, MO, USA | 93112519 | |
| Concentrated nitric acid (OptimaTM grade) | Fisher Scientific Fair Lawn, NJ, USA | A467-250 | |
| Fluorescence microscope equipped with a camera | Zeiss, Jena, Germany | ||
| Fresh human whole blood | Zen Bio Inc | SER-WB10ML | Commercial human whole blood sample |
| GraphPad Prism | GraphPad Software, San Diego, California | Data analysis software | |
| HTP Comet Assay system | Cleaver Scientific | COMPAC- 50 | |
| Human Keratinocyte (HaCaTs) | American Type Culture Collection (ATCC), Manassas, VA, USA | Discontinued | Can be purchased from another company ADDEXBIO TECHNOLOGIES Cat# T0020001 |
| Hydrogen peroxide (H2O2) 30% in water | Fisher Scientific, Hampton, NH, USA | BP2633-500 | |
| ICP-MS iCAP RQ ICP-MS system | Thermo Scientific, Waltham, MA, USA | IQLAAGGAAQFAQKMBIT | |
| Image and Data Analysis software | Perceptive Instrument, Bury St Edmunds, England, UK | 125525 | Free image analysis softwared is available e.g., ImageJ |
| Internal Standard Mix | SPEX Certiprep, Metuchen, NJ, USA | CL-ISM1-500 | Bismuch (isotope monitored 209 Bi)-concnetration of 10 µg/mL in 5% HNO3 |
| Low melting point Agarose | Invitrogen Waltham, MA, USA | P4864 | |
| Na2EDTA (disodium ethylenediaminetetraacetic acid) | Sigma Aldrich, St. Louis, MO, USA | E5134 | |
| NaCl (Sodium chloride) | Sigma Aldrich, St. Louis, MO, USA | S7653 | |
| NanoDrop One | Thermo Scientific, Waltham, MA, USA | 701-058108 | Nanodrop for measuring DNA concentration |
| Nanopure Infinity Ultrapure Water System (Barnstead Nanopure) | Thermo Scientific, Waltham, MA, USA | D11901 | Ultrapure water (16 MΩ cm-1) |
| NaOH (sodium Hydroxide) | Sigma Aldrich, St. Louis, MO, USA | E5134 | |
| Normal melting point Agarose | Fisher Scientific, Hampton, NH, USA | 16520100 | For pre-coating slides |
| OCI-P5X | University of Miami, Miami, FL, USA | N/A | Live Tumor Culture Core facility provided the cells |
| Platinum (Pt) reference standard | SPEX Certiprep, Metuchen, NJ, USA | PLPT3-2Y | (1000 µg/mL in 10% HCl) containing Bismuch |
| Propidium Iodide (1.0 mg/mL in water) | Sigma Aldrich, St. Louis, MO, USA | 12-541BP486410ML | |
| QIAamp DNA Mini Kit | Qiagen Valencia, CA, USA | 51304 | DNA extraction Kit |
| Single-frosted glass microscope slides | Fisher Scientific, Hampton, NH, USA | 12-541B | |
| SKOV3 | ECACC, Louis, MO, USA | 91091004 | |
| Slide box | Fisher Scientific, Hampton, NH, USA | 03-448-2 | Light proof, to protect cells from the formation adventitious damage (according to the widely held view) and prevent fading of the fluorescent dye |
| Slide Chilling plate | Cleaver Scientific, Rugby, England, UK | CSL-CHILLPLATE | |
| Treatment dish | Cleaver Scientific, Rugby, England, UK | STAINDISH4X | |
| Tris-base | Sigma Aldrich, St. Louis, MO, USA | 93362 | |
| Triton X-100 | Fisher Scientific, Hampton, NH, USA | BP151-500 | |
| Trypsin EDTA (0.5%) | Invitrogen Gibco, Waltham, MA, USA | 15400054 | |
| Vertical Slide Carrier | Cleaver Scientific, Rugby, England, UK | COMPAC-25 |
References
- Cooke, M. S., Evans, M. D., Dizdaroglu, M., Lunec, J. Oxidative DNA damage: mechanisms, mutation, and disease. The FASEB Journal. 17 (10), 1195-1214 (2003).
- Barnes, J. L., Zubair, M., John, K., Poirier, M. C., Martin, F. L. Carcinogens and DNA damage. Biochemical Society Transactions. 46 (5), 1213-1224 (2018).
- Evans, M. D., Cooke, M. S. Factors contributing to the outcome of oxidative damage to nucleic acids. Bioessays. 26 (5), 533-542 (2004).
- Evans, M. D., Dizdaroglu, M., Cooke, M. S. Oxidative DNA damage and disease: induction, repair and significance. Mutatation Research. 567 (1), 1-61 (2004).
- Miyamae, Y., et al. Detection of DNA lesions induced by chemical mutagens using the single-cell gel electrophoresis (comet) assay. 2. Relationship between DNA migration and alkaline condition. Mutatation Research. 393 (1-2), 107-113 (1997).
- Angelis, K. J., Dusinská, M., Collins, A. R. Single cell gel electrophoresis: detection of DNA damage at different levels of sensitivity. Electrophoresis. 20 (10), 2133-2138 (1999).
- Duarte, T. L., Cooke, M. S., Jones, G. D. Gene expression profiling reveals new protective roles for vitamin C in human skin cells. Free Radical Biology & Medicine. 46 (1), 78-87 (2009).
- Karbaschi, M., et al. Rescue of cells from apoptosis increases DNA repair in UVB exposed cells: implications for the DNA damage response. Toxicology Research. 4 (3), 725-738 (2015).
- Wu, J. H., Jones, N. J. Assessment of DNA interstrand crosslinks using the modified alkaline comet assay. Methods in Molecular Biology. 817, 165-181 (2012).
- Merk, O., Speit, G. Detection of crosslinks with the comet assay in relationship to genotoxicity and cytotoxicity. Environmental and Molecular Mutagenesis. 33 (2), 167-172 (1999).
- Spanswick, V. J., Hartley, J. M., Hartley, J. A. Measurement of DNA interstrand crosslinking in individual cells using the Single Cell Gel Electrophoresis (Comet) assay. Methods in Molecular Biology. 613, 267-282 (2010).
- Saha, D. T., et al. Quantification of DNA repair capacity in whole blood of patients with head and neck cancer and healthy donors by comet assay. Mutation Research. 650 (1), 55-62 (2008).
- Giovannelli, L., Pitozzi, V., Riolo, S., Dolara, P. Measurement of DNA breaks and oxidative damage in polymorphonuclear and mononuclear white blood cells: a novel approach using the comet assay. Mutatation Research. 538 (1-2), 71-80 (2003).
- Al-Salmani, K., et al. Simplified method for the collection, storage, and comet assay analysis of DNA damage in whole blood. Free Radical Biology & Medicine. 51 (3), 719-725 (2011).
- Akor-Dewu, M. B., et al. Leucocytes isolated from simply frozen whole blood can be used in human biomonitoring for DNA damage measurement with the comet assay. Cell Biochemistry and Function. 32 (3), 299-302 (2014).
- Ge, J., et al. CometChip: a high-throughput 96-well platform for measuring DNA damage in microarrayed human cells. Journal of Visualized Experiments: JoVE. (92), e50607(2014).
- Ostling, O., Johanson, K. J. Microelectrophoretic study of radiation-induced DNA damages in individual mammalian cells. Biochemical and Biophysical Reseach Communications. 123 (1), 291-298 (1984).
- Singh, N. P., McCoy, M. T., Tice, R. R., Schneider, E. L. A simple technique for quantitation of low levels of DNA damage in individual cells. Experimental Cell Research. 175 (1), 184-191 (1988).
- Karbaschi, M., et al. Evaluation of the major steps in the conventional protocol for the alkaline comet assay. International Journal of Molecular Sciences. 20 (23), 6072(2019).
- Karbaschi, M., Cooke, M. S. Novel method for the high-throughput processing of slides for the comet assay. Scientific Reports. 4 (1), 7200(2014).
- Karbaschi, M., Cooke, M. S. Chilling apparatus. USA patent. , 10690574 (2020).
- Cooke, M. S., Karbaschi, M. Method and apparatus for performing electrophoresis. USA patent. , 20160195494 (2019).
- Ji, Y., Karbaschi, M., Cooke, M. S. Mycoplasma infection of cultured cells induces oxidative stress and attenuates cellular base excision repair activity. Mutatation Research. 845, 403054(2019).
- Møller, P., et al. Minimum Information for Reporting on the Comet Assay (MIRCA): recommendations for describing comet assay procedures and results. Nature Protocols. 15 (12), 3817-3826 (2020).
- Almeida, G. M., Duarte, T. L., Steward, W. P., Jones, G. D. Detection of oxaliplatin-induced DNA crosslinks in vitro and in cancer patients using the alkaline comet assay. DNA Repair (Amst). 5 (2), 219-225 (2006).
- Moneef, M. A., et al. Measurements using the alkaline comet assay predict bladder cancer cell radiosensitivity. British Journal of Cancer. 89 (12), 2271-2276 (2003).
- Bowman, K. J., et al. Comet assay measures of DNA damage are predictive of bladder cancer cell treatment sensitivity in vitro and outcome in vivo. International Journal of Cancer. 134 (5), 1102-1111 (2014).
- Abdulwahed, A. M. S. Investigation of DNA Damage and Genomic Organization in the Cellular Response to Platinum Chemotherapy. , Florida International University. Doctor of Philosophy thesis (2020).
- Olive, P. L., Banáth, J. P., Durand, R. E. Heterogeneity in radiation-induced DNA damage and repair in tumor and normal cells measured using the "comet" assay. Radiation Research. 122 (1), 86-94 (1990).
- Kumaravel, T. S., Vilhar, B., Faux, S. P., Jha, A. N. Comet Assay measurements: a perspective. Cell Biology and Toxicology. 25 (1), 53-64 (2009).
- Ji, Y. Formation and Repair of Environmetally-induced damage to Mitochondrial and Nuclear Genomess. , Florida International University. Doctor of Philosophy thesis (2020).
Reprints and Permissions
