

Summary
Formation of actomyosin bundles in vitro and measuring myosin ensemble force generation using optical tweezers is presented and discussed.
Abstract
Myosins are motor proteins that hydrolyze ATP to step along actin filament (AF) tracks and are essential in cellular processes such as motility and muscle contraction. To understand their force-generating mechanisms, myosin II has been investigated both at the single-molecule (SM) level and as teams of motors in vitro using biophysical methods such as optical trapping.
These studies showed that myosin force-generating behavior can differ greatly when moving from the single-molecule level in a three-bead arrangement to groups of motors working together on a rigid bead or coverslip surface in a gliding arrangement. However, these assay constructions do not permit evaluating the group dynamics of myosin within viscoelastic structural hierarchy as they would within a cell. We have developed a method using optical tweezers to investigate the mechanics of force generation by myosin ensembles interacting with multiple actin filaments.
These actomyosin bundles facilitate investigation in a hierarchical and compliant environment that captures motor communication and ensemble force output. The customizable nature of the assay allows for altering experimental conditions to understand how modifications to the myosin ensemble, actin filament bundle, or the surrounding environment result in differing force outputs.
Introduction
Motor proteins are essential to life, converting chemical energy into mechanical work1,2,3. Myosin motors interact with actin filaments by taking steps along the filaments similar to a track, and the dynamics of actin-myosin networks carry out muscle contraction, cell motility, the contractile ring during cytokinesis, and movement of cargo inside the cell, among other essential tasks3,4,5,6,7,8. Since myosins have so many essential roles, failure in the functionality of the myosin-actin network can lead to disease development, such as mutations in the myosin heavy chain that cause heart hypercontractility in hypertrophic cardiomyopathy (HCM)9,10,11,12,13,14. In muscle contraction, individual myosin motors cooperate with each other by working as an ensemble to provide the required mechanical energy that carries out the relative sliding of AFs4,15,16,17,18. Myosin motors form crossbridges between AFs and use conformational changes due to its mechanochemical cycle to collectively move toward the barbed end of the aligned filaments17,18,19,20,21.
Development of quantitative in vitro motility assays at the SM level using techniques such as optical trapping has facilitated gathering unprecedented detail of how individual myosin motors function, including measuring SM force generation and step sizes22,23,24,25,26,27,28,29,30. Finer et al. developed the "three-bead" or "dumbbell" optical trapping assay to probe the force-generation mechanics of single myosin II motors23,31. As muscle myosin II works in teams to contract AFs but is non-processive at the SM level, the optical trapping assay orientation had to be rearranged from the classic motor-bound bead approach32. To form the dumbbell assay, two optical traps were used to hold an AF over a myosin motor bound to a coverslip-attached bead, and force output by the single motor was measured through movements of the AF within the trap23.
However, SM forces and using a single motor/single filament assay orientation do not give a full image about system-level force generation since many motor proteins, including myosin II, do not work in isolation and often do not function as a sum of their parts15,16,17,32,33,34,35,36. More complex structures that include more than one motor interacting with more than one filament are necessary to better understand the synergy of myosin and actin filaments' networks15,32. The dumbbell assay orientation has been exploited to investigate small ensemble force generation by having multiple myosins attached to a bead or using a myosin-thick filament attached to a surface and allowing the motors to interact with the suspended AF4,23,34,37,38,39,40.
Other small ensemble assays include an in vitro filament gliding assay wherein myosin motors are coated onto a coverslip surface, and a bead bound to an AF is used to probe the force generated by the team of motors4,35,36,38,39,40,41,42,43. In both these cases, the myosins are bound to a rigid surface – bead or coverslip – and utilize one AF. In these cases, the motors are not able to move freely or communicate with each other, nor does having myosins rigidly bound reflect the compliant, hierarchical environment in which the motors would work together in the sarcomere32. Previous studies have suggested that myosin II can sense its environment and adapt accordingly to changing viscoelastic or motor concentration conditions by altering characteristics such as force generation and duty ratio41,44,45. Thus, there is a need to develop an optical trapping assay that fosters and captures motor communication and system compliancy to paint a more realistic picture of the mechanistic underpinnings of myosin II ensemble force generation.
Here, we developed a method to couple hierarchical structure in vitro with optical trapping by forming actomyosin bundles or sandwiches consisting of multiple myosin motors interacting between two actin filaments. This modular assay geometry has the ability to directly probe how molecular and environmental factors influence ensemble myosin force generation. Further, investigating force generation mechanisms through these actin-myosin ensembles have the potential to aid in modeling and understanding how large-scale cellular tasks, such as muscle contraction, propagate up from the molecular level9,10,13.
Subscription Required. Please recommend JoVE to your librarian.
Protocol
1. Etching coverslips
- Dissolve 100 g of KOH in 300 mL of 100% ethanol in a 1,000 mL beaker. Stir with a stir bar until the majority of the KOH has dissolved.
CAUTION: Concentrated KOH solution can cause burns and damage to clothing. Wear gloves, eye protection, and a lab coat. - Place coverslips individually in coverslip cleaning racks.
NOTE: Racks are designed with slits that hold single coverslips spaced apart to allow for etching and rinsing on each face of the coverslip, drain holes in the bottom, and made of material that can withstand the harsh etching conditions. They can be custom-made or purchased commercially. - Prepare and label three 1,000 mL beakers: one with 300 mL of ethanol and two beakers with 300 mL of reverse osmosis (RO) water.
NOTE: Here, RO water was sourced from a lab water purifier, but it could also be purchased commercially if a local purifier is not available. - Place each of the four beakers in a bath sonicator to degas for 5 min.
- Submerge a rack of coverslips in the beaker of KOH and ethanol and sonicate for 5 min.
- Transfer the rack of coverslips from the KOH/ethanol beaker to the ethanol-only beaker. Dip rack up and down in the beaker until there is no beading.
NOTE: Take care to not disturb the coverslips or forcefully drop the rack into the beaker. This will cause the coverslips to come out of the rack or cause chemical splashing. - Carefully transfer the rack of coverslips from the ethanol beaker to a beaker of water, dipping up and down until there is no beading.
- Submerge the rack of coverslips in the beaker of water that has not been used yet and sonicate again for 5 min.
- Use a bottle to spray the rack of coverslips with water until it runs off the coverslips smoothly. Repeat with the ethanol.
- Place the racks to dry in an oven at 90 °C for 20 min. Store the racks of etched coverslips at room temperature in closed containers to prevent contamination before use.
2. Actin filament polymerization
- Make Solution T
- In a 50 mL conical tube, add 3.94 g of Tris-HCl and 0.147 g of CaCl2. Add RO water to make a total volume of 50 mL and mix well.
NOTE: The final concentrations of Solution T are 500 mM Tris-HCl and 20 mM CaCl2, respectively. - Label the tube Solution T and store it at 4 °C.
- In a 50 mL conical tube, add 3.94 g of Tris-HCl and 0.147 g of CaCl2. Add RO water to make a total volume of 50 mL and mix well.
- Make TC Buffer
- Mix 40 mL of RO water and 1.5 mL of Solution T in a 50 mL conical tube. Change the pH to 8.0 by adding small amounts of concentrated KOH. Add water to make 50 mL of the solution, and verify the pH. Adjust the pH if needed.
NOTE: The final TC buffer contains 5 mM Tris-HCl and 0.2 mM CaCl2 at pH 8. - Label the tube TC and store it at 4 °C.
- Mix 40 mL of RO water and 1.5 mL of Solution T in a 50 mL conical tube. Change the pH to 8.0 by adding small amounts of concentrated KOH. Add water to make 50 mL of the solution, and verify the pH. Adjust the pH if needed.
- Make FC Buffer
- Add 85 mL of RO water, 10 mL of Solution T, 3.73 g of KCl, and 0.041 g of MgCl2 to a 100 mL buffer bottle. Modify the pH to 7.5 by adding small volumes of concentrated KOH. Add water to make a final volume of 100 mL and verify the pH.
NOTE: The final FC buffer contains 500 mM Tris-HCl, 500 mM KCl, 2 mM MgCl2, and 2 mM CaCl2 at pH 7.5. - Label the tube FC and store it at 4 °C.
- Add 85 mL of RO water, 10 mL of Solution T, 3.73 g of KCl, and 0.041 g of MgCl2 to a 100 mL buffer bottle. Modify the pH to 7.5 by adding small volumes of concentrated KOH. Add water to make a final volume of 100 mL and verify the pH.
- Prepare General Actin Buffer (GAB).
- Mix 485 μL of TC buffer, 10 μL of 10 mM ATP, and 5 μL of 50 mM DTT in a microcentrifuge tube.
NOTE: Final buffer conditions are 5 mM Tris-HCl, 0.2 mM CaCl2, 0.5 mM DTT, and 0.2 mM ATP. - Label it as GAB and store it at 4 °C.
- Mix 485 μL of TC buffer, 10 μL of 10 mM ATP, and 5 μL of 50 mM DTT in a microcentrifuge tube.
- Prepare Actin Polymerization Buffer (APB).
- Mix 455 μL of FC buffer, 25 μL of 100 mM ATP, and 20 μL of 50 mM DTT in a microcentrifuge tube.
NOTE: The final buffer conditions are 50 mM Tris-HCl, 500 mM KCl, 2 mM MgCl2, 2 mM CaCl2 2 mM DTT, and 5 mM ATP. - Label the tube as APB and store it at 4 °C.
- Mix 455 μL of FC buffer, 25 μL of 100 mM ATP, and 20 μL of 50 mM DTT in a microcentrifuge tube.
- Reconstitute actin
- Reconstitute rabbit skeletal muscle actin by adding 100 μL of deionized water to a 1 mg vial of lyophilized actin. Mix well by gently pipetting up and down. Aliquot into 5 μL samples, snap-freeze, and store the 10 mg/mL actin aliquots at -80 °C.
- Reconstitute biotinylated rabbit skeletal muscle actin by adding 20 μL of RO water. Aliquot into 5 μL samples, snap-freeze, and store the 1 mg/mL biotinylated actin aliquots at -80 °C.
- Non-labeled actin polymerization with rhodamine phalloidin stabilization
- Thaw one vial of 10 mg/mL actin and keep it on ice.
- Prepare fresh GAB buffer, add 100 μL of GAB to the actin aliquot, and mix by gently pipetting up and down. Incubate the solution on ice for 1 h.
- Prepare fresh APB during the incubation. After incubation, polymerize the actin into filaments by adding 11 μL of APB to the actin solution. Mix well by gently pipetting up and down. Place on ice for 20 min.
- Add 5 μL of rhodamine-labeled phalloidin to the freshly polymerized actin filament solution. Leave on ice in the dark for 1 h.
- Store the rhodamine actin vial wrapped in aluminum foil in the dark at 4 °C.
NOTE: It is suggested to use these filaments for a maximum period of 1 week. AF quality can be confirmed each day through a quick imaging of a flow cell containing only AFs and viewing consistent filaments day to day.
- Biotinylated actin polymerization with Alexa Fluor 488 phalloidin stabilization
- Thaw one vial of 10 mg/mL actin and 1 vial of 1 mg/mL biotinylated actin and keep them on ice.
- Make fresh GAB buffer.
- Combine the two vials (step 2.8.1) in a 10:1 actin:biotinylated actin ratio. Add 100 μL of GAB to the actin mixture and mix well by gently pipetting up and down. Incubate on ice for 1 h.
- Make fresh APB during the incubation.
- After the incubation step, polymerize the actin by adding 11 μL of APB to the actin solution. Mix well by pipetting up and down gently. Incubate on ice for 20 min.
- Add 5 μL of Alexa Fluor 488-labeled phalloidin and incubate on ice in the dark for 1 h.
- Store the biotinylated actin vial wrapped in aluminum foil in the dark at 4 °C.
NOTE: These filaments can be used for a maximum period of 1 week.
3. Myosin and bead preparation
- Reconstitute Myosin II
- Briefly spin down (~5 s) lyophilized skeletal myosin II to collect it at the bottom of the tube using a standard minicentrifuge.
- Reconstitute the myosin to 10 mg/mL by adding 100 μL of 1 mM DTT prepared in RO water.
- Dilute the stock myosin solution 10x by adding 10 μL of 10 mg/mL myosin to 90 μL of 1 mM DTT in RO water. Make small-volume (1-5 μL) aliquots, snap-freeze, and store at -80 °C.
NOTE: Myosin activity can be confirmed by performing a standard gliding filament assay as published previously46,47. See the discussion for a brief description.
- Cleaning streptavidin-coated beads
- Dilute 20 μL of 1 μm streptavidin beads into 80 μL of RO water. Wash four times by spinning down at 9,600 × g and reconstituting in 100 μL of RO water.
- Sonicate for 2 min at 40% amplitude and store the washed beads on a rotator at 4 °C.
4. Flow cell preparation
- Prepare a poly-l-lysine solution (PLL) by adding 30 mL of 100% ethanol to a 50 mL tube and adding 200 μL of 0.1% w/v poly-l-lysine in water and mix well.
- Add an etched coverslip to the PLL solution and allow it to soak for 15 min. Remove the coverslip with tweezers, taking care to only touch the edge of the coverslip as it is pulled up from the tube (see Figure 1A-C). Grab the coverslips by their edges with a gloved hand.
- Dry the coverslip with a filtered airline until there is no ethanol left and no residue on the coverslip.
- Apply two pieces of double-sided sticky tape to the middle of a microscope slide, 3-4 mm apart from each other. Tear or cut off the excess tape that hangs off the edge of the slide.
- Add the PLL-coated coverslip on top of the tape perpendicular to the long axis of the microscope slide (forming a T) to form a channel.
- Use a small tube to compress the coverslip onto the tape and microscope slide thoroughly until the tape is transparent (Figure 1A). Ensure there are no bubbles in the tape as this can cause leakage from the flow channel.
NOTE: The flow cell can hold a volume of 10-15 μL.
5. Actomyosin bundle preparation
- In separate tubes, dilute each type of actin filament (rhodamine- and biotinylated 488-labeled) 600x by mixing 0.5 μL of the respective, labeled actin with 300 μL of APB. Add an additional 5 μL of the correspondingly labeled phalloidin to each tube and incubate on ice in the dark for 15 min.
- To the biotinylated actin solution, add an oxygen scavenging system of 1 μL of beta-D-glucose at 500 mg/mL, 1 μL of glucose oxidase at 25 mg/mL, and 1 μL of catalase at 500 units/mL. Add 1 μL of 100 mM ATP and 1 μL of 100x diluted, cleaned streptavidin beads. Gently stir with a pipette tip. Put the suspension on a rotator at 4 °C while the rest of the actomyosin bundle is being assembled.
- Add 15 μL of the diluted rhodamine actin to the PLL flow cell (Figure 1D). Wick the excess solution through the flow cell but do not allow the flow channel to become dry. Incubate for 10 min in a humidity chamber.
NOTE: Humidity chambers can be made from empty pipette tip boxes with water added to the bottom and the lid covered in aluminum foil to block light. - Prepare a 1 mg/mL casein solution in APB.
- Add 15 μL of 1 mg/mL casein to prevent non-specific binding of the subsequent components (Figure 1E). Incubate for 5 min in a humidity chamber.
- Add the desired concentration of myosin to the biotinylated actin and bead suspension from step 5.2. Gently stir with the pipette tip, and then immediately add 15 μL of the step 5.2 suspension + the desired myosin concentration to the flow cell (Figure 1F,G). Incubate for 20 min. Seal the open ends of the flow cell with nail polish to prevent evaporation during imaging and optical trapping experiments.
NOTE: A myosin solution concentration of 1 μM yields robust bundling and can be used as a starting point for the desired customization of the assay (see Figure 2).
6. Force measurements using Optical Trap (NT2 Nanotracker2)
NOTE: While the protocol below is specifically for the NT2 system, this assay can be used with other optical trapping systems, including those that are custom-built, that also have fluorescence capabilities. The general workflow remains the same of getting the surface of the slide in focus, performing bead calibrations, and acquiring data by finding fluorescent actin bundles. For the NT2 system, Supplemental Figure S1, Supplemental Figure S2, Supplemental Figure S3, Supplemental Figure S4, Supplemental Figure S5, Supplemental Figure S6, and Supplemental Figure S7 provide details of the optical trapping system and the software interface.
- Turn on the control box and laser (Supplemental Figure S1).
- Start the optical trap computer software by clicking on the JPK Nanotracker icon on the desktop.
- Wake up the remote controller by clicking on the Logitech button at the center (Supplemental Figure S2).
- Turn on the fluorescence module by toggling the on/off switch (Supplemental Figure S3).
- Turn the filter cube turret for brightfield imaging (Supplemental Figure S4).
- Once the system is ready, turn on the laser using the Laser Power button at the left-bottom corner of the screen to 50 mW and let it stabilize for 30 min (Supplemental Figure S5).
- Sequentially click on the Illumination, Camera, Objective, and Stage Movement buttons within the software to bring up those windows for viewing and manipulation during the experiment. Turn the microscope illumination on by clicking on the On/Off button and setting it to maximum power by clicking and dragging the bar all the way to the right (Supplemental Figure S5).
- Open the sample area and remove the sample holder from the microscope stage. Add the flow cell, secure it with the metal sample holders, and make sure that the slide with the coverslip is on the bottom.
- Add 30 μL of RO water to the center of the bottom objective. Do not let the pipette tip touch the lens. Reinsert the sample stage.
NOTE: As the NT2 system uses a water immersion objective as the trapping objective, the immersion media may be different depending on the trapping objective in the user's setup. - Raise the lower objective using the on-screen control arrows or L2 on the remote controller until the bead of water touches the coverslip (Supplemental Figure S5).
- Lower the top objective until about half the distance to the flow cell is reached using the on-screen arrows or R2 on the remote controller. Add 170 μL of RO water to the top of the flow cell directly under the top objective. Lower the top objective until it breaks the surface tension of the water and forms a meniscus.
- Move the microscope stage using the arrow pad on the remote controller until the edge of the tape adjacent to the flow channel is reached. Close the sample door.
NOTE: A "click" upon closing the sample door indicates that the laser shutter is now open. This is a safety feature that only allows the shutter to open if the door is closed. - Using the Objective window in the screen, bring the edge of the tape in focus by bringing the bottom objective named Laser Objective up by clicking on the upper arrow using the on-screen controls. Do the same for the top objective by clicking bottom arrow (Supplemental Figure S5).
NOTE: The double arrows move the objective or stage faster. The edge of the tape is used for focusing because it is a large, easy-to-find object that is close to the coverslip surface. Air bubbles within the tape are another option. However, this is not required if the user has an automated routine to find the surface focus or a preferred in-house method. - Once the tape is in focus, partially close the iris at the top of the optical trap. Bring the top objective down until the polygon shape of the iris is visible. Bring those edges in focus, reopen the iris, and then couple the objectives using by clicking on the Padlock icon (Supplemental Figure S5).
- Find a floating bead and trap it by clicking on the Trap Shutter button, which will open the shutter and allow the trapping laser to hit the sample. Click on the Trap cursor on the screen and drag it to move the location of the trapping laser. Once trapped, calibrate the bead to correlate voltage measurements to force and displacement.
- Click on the Calibration button. Adjust the calibration routine based on power spectra analysis and fit the corner frequency within the software for the X, Y, and Z directions (Supplementary Figure S6).
- Click on Settings. Type in the diameter of the bead (1,000 nm), and type in the temperature of the stage found in the bottom left of the software window. (see Supplemental Figure S6).
- Click on Trap 1. Click on X Signal. Click on Run to perform the corner frequency fit. Click and drag within the window to optimize the function fit. Click on Use It for sensitivity and stiffness values. Click on Accept Values. Repeat for the Y and Z signals. Close the window. (see Supplemental Figure S6).
NOTE: Bead calibration routines on other optical trapping systems or custom-built systems that have been robustly tested by the user, such as the equipartition method or drag force method, are also acceptable57,58. - Find an actomyosin bundle by searching for beads bound to AFs on the surface of the coverslip.
- When a bead uncrowded by other floating beads is detected, observe the AFs around it by fluorescence imaging to verify the presence of a bundle.
- Verify that a bundle is present by looking for both fluorescent AFs colocalized. Turn on the white light source and use the appropriate filter cube to image each actin filament by turning the turret (488 nm and 532 nm excitation filter cubes for Alexa Fluor 488 and rhodamine excitation, respectively). See Supplemental Figure S4.
NOTE: A control experiment to verify the fluorescence intensity of single AFs can be useful in identifying bundles that are composed of a single 488- and single rhodamine-labeled filaments, or applicable to whichever set of fluorophores the user chooses to use. - Once verified, trap the bead attached to the top filament of the bundle by clicking on the Trap Shutter button.
- Use the on-screen controls to record the data by clicking on the Oscilloscope button (Supplemental Figure S7). To visualize measurements without recording the data, click on Start. To save all data, click on Autosave. To record measurements, click on Start Record. Choose which data are to be visualized in real-time (position, force, x-direction, y-direction) by choosing from the drop down menu X signal or Y signal. Remember that xdirection is left to right, and y-direction is up and down on the screen. See Supplemental Figure S7.
NOTE: Data will be saved as .out files and includes time, voltage, displacement, and force for each direction. These files can be exported into other software for visualization and analysis.
Subscription Required. Please recommend JoVE to your librarian.
Representative Results
Flow cells containing the actomyosin bundle systems are of a standard design, consisting of a microscope slide and an etched coverslip separated by a channel made from double-sided sticky tape (Figure 1). The assay is then built from the coverslip up using staged introductions as described in the protocol. The final assay consists of template rhodamine-labeled actin filaments; the desired myosin concentration (1 μM was used for the representative results in Figure 2 and Figure 3); biotinylated, Alexa Fluor 488-labeled actin filaments; 1 μm streptavidin beads; the oxygen scavenging system; ATP; and APB buffer. Multiple bundles will be formed per flow cell, and the actin concentrations described above give adequate spacing between bundles to ensure no unwanted interactions. This also facilitates obtaining multiple force measurements per flow cell to increase data acquisition efficiency. Force profiles should be reproducible within a flow cell and from flow cell to flow cell.
While the protocol above is geared toward the use of a commercial optical trapping setup, the flow cell and assay presented here could be easily utilized for a different commercial instrument or custom-built optical trapping setup coupled with a microscope or microscope stage and possessing fluorescence imaging capabilities. Once all flow cell additions are complete according to the above protocol, the actomyosin bundles on the slide (Figure 1) are ready for immediate measurement. The flow cell is added to the optical trap microscope stage, multiple bead calibration measurements are acquired, and bundles are identified through fluorescence colocalization of the bundle filaments. A bead bound to a bundle is trapped, and the displacement and corresponding force measurement begins. The user can observe the acquisition of data in real time on the computer monitor. Depending on the concentration of myosin used in the flow cell, the bundle could begin exhibiting substantial movement immediately, or it may take 30 s-1 min to effectively see an increase in displacement/force.
A representative force trace is shown in Figure 3A where the myosin motors exhibit a steady ramp in force followed by a plateau. It is typical to see these types of traces develop over 2-5 min. However, it is also possible to measure actomyosin bundles that do not generate any net force (Figure 3B). These traces appear as baseline noise or exhibit no substantial net increase in force over 90 s. This is likely due to a low local concentration of motor that does not permit productive sliding, or the bundle is in an unfavorable parallel orientation where the plus and minus ends of the filaments are aligned.
As the contents of the flow cell can be susceptible to degradation from the incident illumination and trapping laser, local heating on the slide over time, and generation of radical oxygen species, it is strongly advised to not use the same flow cell for more than 1 h. For maximum efficiency, it is suggested to have another assay incubating while acquiring data. Displacement/force trace can be exported from the optical trapping software into Excel, Matlab, Igor, or other data management programs for further filtering and analysis. Data that can be extracted from such optical trapping ensemble/bundle experiments include different types of force generation profiles (baseline, ramp/plateau) under varying assay conditions, velocity of force generation, maximum force generation, ensemble kinetic and stepping behavior through step sizes and dwell times between steps or teams of steps, as well as duty ratio. The user can also alter the assay conditions to compare how adding different types of myosin motors, adding actin binding proteins, or changing buffer conditions influence these ensemble force generation characteristics.
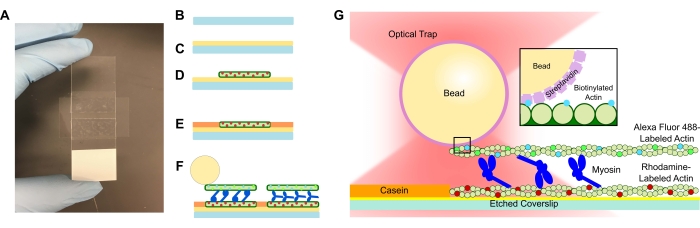
Figure 1: Assay schematic. (A-C) Etched coverslips are coated in poly-L-lysine and used to form the flow cell by using double-sided tape and a microscope slide. Timed introductions and incubation steps described in the protocol result in rhodamine-labeled phalloidin-stabilized actin as the template or bottom filament (D), followed by casein blocking to prevent non-specific binding (E), and (F) Alexa Fluor 488 phalloidin-stabilized biotinylated actin as the cargo or top filament, and teams of myosin II that slide the filaments apart and generate force when ATP is introduced. The geometry of the motors and nature of crosslinking within the bundle could vary under different conditions, such as salt concentration59. Previous studies have demonstrated that the myosin tail domain has the ability to interact with actin filaments and slow ensemble motility46. However, myosin heads in heavy meromyosin experiments demonstrate binding of each head to adjacent actin filaments60. (G) Streptavidin beads are used as the optical handle for the trap and bind solely to the cargo biotinylated actin filament, which aids in validating that proper bundles are formed on the slide. Please click here to view a larger version of this figure.

Figure 2: Fluorescent actomyosin bundles. Four different encounters of actin filaments and bundles within the bundle assay presented in Figure 1. The top cargo biotinylated actin filament with the Alexa Fluor 488 phalloidin channel is shown on the left, and the bottom template actin filament with the rhodamine phalloidin channel is on the right. At the bottom, the same figure is shown with colored lines overlaid to help guide the eye. (A) A top actin filament is found near a bottom actin filament but has an incomplete overlay. This would not be used for bundle experiments. (B) Top and bottom actin filaments are colocalized, and the intensity of each filament confirms that they are each single filaments within the bundle. This would be a good candidate for bundle experiments. (C) A large bundle of self-assembled rhodamine filaments is found on the bottom. While there is a corresponding top actin filament that is colocalized, there are too many bottom filaments present; thus, it would not be used for bundle experiments. This is also an example of how when multiple actin filaments of the same type are bundled, the fluorescence intensity increases. The user can utilize this as a gauge for judging single filaments versus bundles of the same filament type. (D) A bottom filament is present with no corresponding top filament, also confirming no bleedthrough. This would not be used for bundle experiments. We note that the intensity of the filaments in the Alexa Fluor 488 channel is low and believe it is due to the filter set that is being used (Filter Set 09 from Zeiss). The filter set used for the rhodamine channel is Filter Set 43 from Zeiss. Please click here to view a larger version of this figure.

Figure 3: Myosin II ensemble force generation. Representative traces of skeletal myosin II motors generating force within the constructed in vitro actin structural hierarchy. The myosin motors are working together to collectively and productively generate force until a plateau is reached and force is sustained (A) or experience antagonization near baseline (B). Please click here to view a larger version of this figure.
Supplemental Figure S1: Bruker/JPK Nanotracker2 optical trap. (A) Computer monitor. (B) Computer keyboard. (C) Computer tower. (D) Controller box. (E) Laser power supply. (F) Optical trap optics box. (G) Inverted microscope. (H) Door to microscope stage. (I) Polarizer slider to switch between brightfield and differential interference contrast imaging. Please click here to download this File.
Supplemental Figure S2: Remote control for optical trap. (A) Keypad to position the motorized stage. (B-C) Adjust trap position. (D) A, X, and B switch on and off the main shutter, trap 1 shutter, and trap 2 shutter, respectively. (E) The Logitech button is used to wake up the controller. (F) The up and down buttons that are used to position the trapping objective. (G) The up and down buttons that are used to position the detection objective. Note that the remote control is not required, and all these manipulations can be accomplished in the software. However, it is convenient to be able to control the objectives and stage position while looking into the microscope stage environment. Please click here to download this File.
Supplemental Figure S3: Fluorescence module for optical trap. The 89North PhotoFluor fluorescence white light source is coupled to the back of the inverted microscope. It is turned on and off with a toggle switch (arrow). Please click here to download this File.
Supplemental Figure S4: Fluorescence filter cube turret. The turret (arrow) can be turned to use the filter cube necessary for imaging in DIC, rhodamine, or Alexa Fluor 488 dyes. Note that filter cubes can be switched out to customize the setup for using different fluorophores. Please click here to download this File.
Supplemental Figure S5: Nanotracker2 software. (A) Laser power button and control. (B) Objective positioning window. Directional arrows are used to move the detection (top) and trapping (bottom) objectives. Double arrows move the objectives at a higher speed. The blue and red button at the bottom-left uncouples the objectives and retracts them back to their original position. This is necessary for when taking samples in and out of the microscope stage. The third button from the left with the objectives and padlock icon "couples" the objectives so that when they are both in focus and achieve Kohler illumination, the user can move both the trapping and detection objectives up and down in the z-axis. (C) Sample positioning window used to move the microscope stage in the x- and y-axis. Double arrows move the stage at a higher speed. This window is activated by clicking the up/down and left/right arrow icon at the top menu. (D) Camera visualization window. The wrench icon can be used to set customized imaging conditions. This window is activated by clicking on the Camera icon at the top menu. (E) Microscope illumination window. This window is activated by clicking on the Light Bulb icon at the top menu. Please click here to download this File.
Supplemental Figure S6: Calibration window. (A)This window is used for bead calibration and is activated by clicking on the Cal icon at the top menu. To calibrate a bead, a best fit of the corner frequency is accomplished in the x, y, and z signals. (B) For each signal, choose the appropriate signal button in the top left. (C) Click on run and optimize the fit by clicking and dragging within the green window (D). (E) Once satisfied with the fit, click on Use It for sensitivity and stiffness. This will allow for recording displacement in nanometers and force in piconewtons. (F) Then, click on Accept Values at the bottom left. Repeat for the y and z directions. Please click here to download this File.
Supplemental Figure S7: Data Acquisition window. This window is used to acquire position and force data and allows the user to see the measurements in real time. (A) This window is activated by clicking the x,t icon at the top menu. (B) The user can switch between viewing the x and y signals. (C) Click on Start to begin visualizing data. Click on Autosave to save the data. Click on Start Record to begin recording and saving data. Please click here to download this File.
Subscription Required. Please recommend JoVE to your librarian.
Discussion
An in vitro study using optical tweezers combined with fluorescence imaging was performed to investigate the dynamics of myosin ensembles interacting with actin filaments. Actin-myosin-actin bundles were assembled using muscle myosin II, rhodamine actin at the bottom of the bundle and on the coverslip surface, and 488-labeled, biotinylated actin filaments on the top of the bundle. Actin protein from rabbit muscle was polymerized and stabilized using general actin buffers (GAB) and actin polymerizing buffers (APB). GAB and APB must be freshly prepared every day in the lab using ATP, FC buffer, and TC buffer. Muscle myosin II was used to form the actin-myosin-actin sandwiches. Phalloidin was used for fluorescent staining of the actin filaments, as well as stabilization in vitro.
Myosin activity can be confirmed by performing a standard gliding filament assay as published previously46,47. Myosin II and its subfragments can bind to the coverslip surface in a variety of orientations, and the presence of the tail domain can slow down filament sliding as compared to assays using heavy meromyosin46,48,49. However, gliding and surface movement can still be observed. A more apparent demonstration of myosin activity is active actin filament breaking that can be observed where longer actin filaments are broken into smaller fragments that then glide away in multiple directions. This occurs due to the high concentration of active motors on the surface, has been observed by multiple laboratories, and does not occur without active myosin motors present42,50,51,52,53,54. Further, the bundle assay presented here aids in alleviating motility issues that have primarily been associated with the gliding filament assay, such as the variety of motor binding orientations on a glass coverslip, because the bundle assay involves casein blocking of the glass surface so that motors bind within the bundle47,55,56.
The first step is to add rhodamine actin filaments as the bottom or template filament to a poly-L-lysine coated coverslip in a flow cell. Poly-L-lysine is used to promote actin binding since poly-lysine is positively charged while actin has negative charges and has been used in previous cytoskeletal in vitro assay preparations61,62,63. Before bundle formation, different actin dilutions were added to a flow cell to optimize the actin concentration. In this case, 600x from the stock was the optimal dilution that yielded a sufficient number of template filaments for bundle formation but with adequate spacing so that bundles were individualized. Dilution was carried out using the APB buffer. Adding rhodamine actin was followed by a layer of casein to block the surface and avoid non-specific binding. The flow cell was incubated for 30 min and washed after incubation with buffer to wash out any unbound actin filaments. Finally, a combination of myosin, 488/biotin actin, and streptavidin-coated beads were added to the flow cell to facilitate actin-myosin bundle formation. The bead concentration should be such that there are enough to bind surface-bound bundles and enough in suspension to facilitate calibration. However, too high of a bead concentration can cause difficulty during trapping experiments due to neighboring beads falling into the laser trap and disrupting measurement. Myosin motors are added to the combination right before injecting it to the slide so that the myosin motors do not preemptively aggregate with the cargo or top biotinylated actin filament and will thus bind the bottom rhodamine to bundle biotinylated actin filaments.
The NT2 optical trapping system is a commercial optical trap with combined brightfield, differential interference contrast (DIC), and epifluorescence imaging modalities. It is coupled with a Zeiss AxioObserver 3 inverted microscope with 100x/NA 1.46 and 63x/NA 1.0 water immersion trapping and detection objectives. The system is equipped with click and drag trapping capability of one laser trap and can be used while imaging in any of the listed modalities previously. The formed bundles are detected and confirmed by using fluorescence imaging. Having a white light source with appropriate filter cubes (GFP/FITC and TRITC/CY3) allows for rapid switching between filament imaging. Colocalized AFs were verified by visualizing the AFs at the different excitation wavelengths before taking each force measurement using optical tweezers. As the filaments can photobleach quickly even with an oxygen scavenging reagent, it is suggested that researchers optimize visualization parameters such as intensity and exposure time before performing the bundle experiments.
Optical trapping was employed to take the force measurements, using the streptavidin beads in the presence of ATP to bind the biotinylated cargo actin filament and activate myosin force generation as a force transducer. Displacement and force versus time data obtained by optical trapping were extracted from the trapping software for analysis. However, the commercial trapping software also provides analysis routines that can be utilized, or custom algorithms in other programs can be programmed by the user to visualize and analyze trapping data. On custom optical trapping systems, the user may have excitation lasers instead of a white light source with filters, which are also acceptable to use. Further, fluorescent dyes can be changed to be suited to the existing equipment a user may have if the emission spectra do not overlap and cause bleedthrough.
We note that the assay presented is a baseline assay that can be further customized by the user depending on their research question within the realm of actomyosin ensemble mechanics. The general workflow can also be applied to other in vitro cytoskeletal ensemble systems that may be of interest, such as microtubule bundle assays that form minimal models of mitotic spindle32,61,63,64,65,66. Modifications could include but are not limited to changing the fluorophore labels that are suited to the user's existing setup; altering myosin concentration, construct, or isotype; and titrating buffer conditions, among other aspects.
Potential challenges are possible when performing this assay. When forming the actin-myosin bundles, myosin concentration within the actin bundles may not be homogeneous across the slide. To accommodate this, multiple bundles across the entire slide will be measured to ensure that motor distribution and force generation profiles are properly sampled. It is also challenging to know bundle orientation if this is required for interpretation of force data. Thus, multiple trials should be taken for each bundle. One could also incorporate actin filament end labeling through fluorescent gelsolin or gelsolin-coated beads of a smaller size than the optical trapping handle. Fluorescence imaging can also be used to look at x and y component forces to deduce bundle orientation. Moreover, as myosin aggregation state is highly influenced by the ionic strength of the buffer with formation of thick filaments occurring upon rapid dilution of KCl, buffer salt concentration should monitored appropriately67,68.
Previous studies that used other in vitro methods such as gliding assays were helpful to identify the role of myosin domains and study the configuration and interactions between myosin and other actin binding proteins. However, these methods have a disadvantage in that binding myosin onto a rigid surface will limit the potential for coordination between myosin motors and thus mechanosensing feedback that occurs to determine whether the motor ensemble is in a high or low duty ratio mode33,35,41,69. Further, optical trapping with single-myosin motor networks does not give a clear understanding of how myosin motors interact with each other and with actin filaments. The protocol developed here allows for the investigation of myosin motor ensemble dynamics within a compliant, hierarchical actin network. It is also customizable in terms of motor-filament ensemble characteristics such as concentration, isoform, and buffer environment, among other aspects, to allow for systematic investigation. The presented protocol is a platform for future studies of more complex actomyosin networks and maintains the precision of displacement and force generation measurements facilitated by optical trapping that has traditionally been used for single-molecule studies.
Subscription Required. Please recommend JoVE to your librarian.
Disclosures
The authors have no conflicts of interest to declare.
Acknowledgments
This work is supported in part by the University of Mississippi Graduate Student Council Research Fellowship (OA), University of Mississippi Sally McDonnell-Barksdale Honors College (JCW, JER), the Mississippi Space Grant Consortium under grant number NNX15AH78H (JCW, DNR), and the American Heart Association under grant number 848586 (DNR).
Materials
| Name | Company | Catalog Number | Comments |
| Actin protein (biotin): skeletal muscle | Cytoskeleton | AB07-A | Biotinylated actin protein |
| Actin protein, rabbit skeletal muscle | Cytoskeleton | AKL99-A | Actin protein |
| Alexa Fluor 488 Phalloidin | Invitrogen | A12379 | Actin stabilizer and Alexa Fluor 488 stain |
| ATP | Fisher scientific | BP413-25 | Required for actin assembly and myosin motility |
| Beta-D-glucose | Fisher scientific | MP218069110 | Part of oxygen scavenging system used to reduce photobleaching during fluorescence imaging |
| Blotting Grade Blocker (casein) | Biorad | 1706404 | Used to block surface from non-specific binding |
| CaCl2 | Fisher scientific | C79500 | Calcium chloride, provides the necessary control over the dynamics of actin myosin network |
| Catalase | Fisher scientific | ICN10040280 | Part of oxygen scavenging system used to reduce photobleaching during fluorescence imaging |
| Coverslips | Fisher scientific | 12544C | Used to make flow cells |
| DTT | Fisher scientific | AC327190010 | Used for buffer preparation |
| Ethanol | Fisher scientific | A4094 | Regent used for cleaning coverslips |
| Glucose oxidase | Fisher scientific | 34-538-610KU | Part of oxygen scavenging system used to reduce photobleaching during fluorescence imaging |
| KCl | Fisher scientific | P217-500 | Used for buffer preparation |
| KOH | Fisher scientific | P250-1 | Used to etch coverslips and adjust buffer pH |
| MgCl2 | Fisher scientific | M33-500 | Used for buffer preparation |
| Microscope slides | Fisher scientific | 12-544-2 | Used to make flow cells |
| Myosin II protein: rabbit skeletal muscle | Cytoskeleton | MY02 | Full length myosin motor protein isolated from rabbit skeletal muscle |
| Nanotracker2 | Bruker/JPK | NT2 | Optical trapping instrument |
| Poly-l-lysine | Sigma-Aldrich | P8920 | Facilities adhesion of actin filaments onto glass surface of the coverslip |
| Rhodamine Phalloidin | Cytoskeleton | PHDR1 | Actin stabilizer and rhodamine fluorescent stain |
| Streptavidin beads, 1 μm | Spherotech | SVP-10-5 | Optical trapping handle |
| Tris-HCl | Fisher scientific | PR H5121 | Used for buffer preparation |
References
- Goldstein, L. S. Kinesin molecular motors: transport pathways, receptors, and human disease. Proceedings of the National Academy of Sciences of the United States of America. 98 (13), 6999-7003 (2001).
- Lee Sweeney, H., Holzbaur, E. L. F. Motor proteins. Cold Spring Harbor Perspectives in Biology. 10 (5), 021931 (2018).
- O'Connell, C. B., Tyska, M. J., Mooseker, M. S. Myosin at work: Motor adaptations for a variety of cellular functions. Biochimica et Biophysica Acta - Molecular Cell Research. 1773 (5), 615-630 (2007).
- Kaya, M., Tani, Y., Washio, T., Hisada, T., Higuchi, H. Coordinated force generation of skeletal myosins in myofilaments through motor coupling. Nature Communications. 8, 1-13 (2017).
- Akhshi, T. K., Wernike, D., Piekny, A. Microtubules and actin crosstalk in cell migration and division. Cytoskeleton. 71 (1), 1-23 (2014).
- Brawley, C. M., Rock, R. S. Unconventional myosin traffic in cells reveals a selective actin cytoskeleton. Proceedings of the National Academy of Sciences of the United States of America. 106 (24), 9685-9690 (2009).
- Hartman, M. A., Spudich, J. A. The myosin superfamily at a glance. Journal of Cell Science. 125 (7), 1627-1632 (2012).
- Spudich, J. A., et al. Myosin structure and function. Cold Spring Harbor Symposium on Quantitative Biology. 60, 783-791 (1995).
- Sommese, R. F., et al. Molecular consequences of the R453C hypertrophic cardiomyopathy mutation on human β-cardiac myosin motor function. Proceedings of the National Academy of Sciences of the United States of America. 110 (31), 12607-12612 (2013).
- Nag, S., et al. The myosin mesa and the basis of hypercontractility caused by hypertrophic cardiomyopathy mutations. Nature Structural & Molecular Biology. 24 (6), 525-533 (2017).
- Kawana, M., Sarkar, S. S., Sutton, S., Ruppel, K. M., Spudich, J. A. Biophysical properties of human b-cardiac myosin with converter mutations that cause hypertrophic cardiomyopathy. Science Advances. 3 (2), 1-11 (2017).
- Girolami, F., et al. Novel α-actinin 2 variant associated with familial hypertrophic cardiomyopathy and juvenile atrial arrhythmias: A massively parallel sequencing study. Circulation: Cardiovascular Genetics. 7 (6), 741-750 (2014).
- Debold, E. P., et al. Hypertrophic and dilated cardiomyopathy mutations differentially affect the molecular force generation of mouse α-cardiac myosin in the laser trap assay. American Journal of Physiology - Heart and Circulatory Physiology. 293 (1), 284-291 (2007).
- Barron, J. T. Hypertrophic cardiomyopathy. Current Treatment Options in Cardiovascular Medicine. 1 (3), 277-282 (1999).
- Duke, T. A. J. Molecular model of muscle contraction. Proceedings of the National Academy of Sciences of the United States of America. 96 (6), 2770-2775 (1999).
- Vilfan, A., Duke, T. Instabilities in the transient response of muscle. Biophysical Journal. 85 (2), 818-827 (2003).
- Huxley, A. F. Muscle structure and theories of contraction. Progress in Biophysics and Biophysical Chemistry. 7, 255-318 (1957).
- Huxley, H. E. Fifty years of muscle and the sliding filament hypothesis. European Journal of Biochemistry. 271 (8), 1403-1415 (2004).
- Kad, N. M., Kim, S., Warshaw, D. M., VanBuren, P., Baker, J. E. Single-myosin crossbridge interactions with actin filaments regulated by troponin-tropomyosin. Proceedings of the National Academy of Sciences of the United States of America. 102 (47), 16990-16995 (2005).
- Veigel, C., Molloy, J. E., Schmitz, S., Kendrick-Jones, J. Load-dependent kinetics of force production by smooth muscle myosin measured with optical tweezers. Nature Cell Biology. 5 (11), 980-986 (2003).
- Spudich, J. A. The myosin swinging cross-bridge model. Nature reviews. Molecular Cell Biology. 2, 387-392 (2001).
- Simmons, R. M., Finer, J. T., Chu, S., Spudich, J. A. Quantitative measurements of force and displacement using an optical trap. Biophysical Journal. 70 (4), 1813-1822 (1996).
- Finer, J. T., Simmons, R. M., Spudich, J. Single myosin molecule mechanics: piconewton forces and nanometre steps. Nature. 368 (6467), 113-119 (1994).
- Kron, S. J., Uyeda, T. Q. P., Warrick, H. M., Spudich, J. A. An approach to reconstituting motility of single myosin molecules. Journal of Cell Science. 98, 129-133 (1991).
- Molloy, J. E., Burns, J. E., Kendrick-Jones, B., Tregear, R. T., White, D. C. S. Movement and force produced by a single myosin head. Nature. 378 (6553), 209-212 (1995).
- Ruegg, C., et al. Molecular motors: Force and movement generated by single Myosin II molecules. Physiology. 17 (5), 213-218 (2002).
- Nayak, A., et al. Single-molecule analysis reveals that regulatory light chains fine-tune skeletal myosin II function. Journal of Biological Chemistry. 295 (20), 7046-7059 (2020).
- Dupuis, D. E., Guilford, W. H., Wu, J., Warshaw, D. M. Actin filament mechanics in the laser trap. Journal of Muscle Research and Cell Motility. 18 (1), 17-30 (1997).
- Tyska, M. J., et al. Two heads of myosin are better than one for generating force and motion. Proceedings of the National Academy of Sciences of the United States of America. 96 (8), 4402-4407 (1999).
- Tyska, M. J., Warshaw, D. M. The myosin power stroke. Cell Motility and the Cytoskeleton. 51 (1), 1-15 (2002).
- Finer, J. T., et al. Characterization of single actin-myosin interactions. Biophysical Journal. 68, 291-296 (1995).
- Al Azzam, O., Trussell, C. L., Reinemann, D. N. Measuring force generation within reconstituted microtubule bundle assemblies using optical tweezers. Cytoskeleton. 78 (3), 111-125 (2021).
- Wagoner, J. A., Dill, K. A. Evolution of mechanical cooperativity among myosin II motors. Proceedings of the National Academy of Sciences of the United States of America. 118 (20), 2101871118 (2021).
- Walcott, S., Warshaw, D. M., Debold, E. P. Mechanical coupling between myosin molecules causes differences between ensemble and single-molecule measurements. Biophysical Journal. 103 (3), 501-510 (2012).
- Stewart, T. J., Murthy, V., Dugan, S. P., Baker, J. E. Velocity of myosin-based actin sliding depends on attachment and detachment kinetics and reaches a maximum when myosin-binding sites on actin saturate. Journal of Biological Chemistry. 297 (5), 101178 (2021).
- Hilbert, L., Cumarasamy, S., Zitouni, N. B., Mackey, M. C., Lauzon, A. M. The kinetics of mechanically coupled myosins exhibit group size-dependent regimes. Biophysical Journal. 105 (6), 1466-1474 (2013).
- Debold, E. P., Walcott, S., Woodward, M., Turner, M. A. Direct observation of phosphate inhibiting the Force-generating capacity of a miniensemble of myosin molecules. Biophysical Journal. 105 (10), 2374-2384 (2013).
- Kaya, M., Higuchi, H. Nonlinear elasticity and an 8-nm working stroke of single myosin molecules in myofilaments. Science. 329 (5992), 686-689 (2010).
- Pertici, I., et al. A myosin II nanomachine mimicking the striated muscle. Nature Communications. 9 (1), 1-10 (2018).
- Cheng, Y. S., De Souza Leite, F., Rassier, D. E. The load dependence and the force-velocity relation in intact myosin filaments from skeletal and smooth muscles. American Journal of Physiology - Cell Physiology. 318 (1), 103-110 (2020).
- Stam, S., Alberts, J., Gardel, M. L., Munro, E. Isoforms confer characteristic force generation and mechanosensation by myosin II filaments. Biophysical Journal. 108 (8), 1997-2006 (2015).
- Rastogi, K., Puliyakodan, M. S., Pandey, V., Nath, S., Elangovan, R. Maximum limit to the number of myosin II motors participating in processive sliding of actin. Scientific Reports. 6, 1-11 (2016).
- Debold, E. P., Patlak, J. B., Warshaw, D. M. Slip sliding away: Load-dependence of velocity generated by skeletal muscle myosin molecules in the laser trap. Biophysical Journal. 89 (5), 34-36 (2005).
- Albert, P. J., Erdmann, T., Schwarz, U. S. Stochastic dynamics and mechanosensitivity of myosin II minifilaments. New Journal of Physics. 16, (2014).
- Erdmann, T., Schwarz, U. S. Stochastic force generation by small ensembles of myosin II motors. Physical Review Letters. 108 (18), 1-5 (2012).
- Guo, B., Guilford, W. H. The tail of myosin reduces actin filament velocity in the in vitro motility assay. Cell Motility and the Cytoskeleton. 59 (4), 264-272 (2004).
- Miller-Jaster, K. N., Petrie Aronin, C. E., Guilford, W. H. A quantitative comparison of blocking agents in the in vitro motility assay. Cellular and Molecular Bioengineering. 5 (1), 44-51 (2012).
- Mansoon, A., Balaz, M., Albet-Torres, N., Rosengren, K. J. In vitro assays of molecular motors -- impact of motor-surface interactions. Frontiers in Bioscience. 13, 5732-5754 (2008).
- Persson, M., et al. Heavy meromyosin molecules extending more than 50 nm above adsorbing electronegative surfaces. Langmuir. 26 (12), 9927-9936 (2010).
- Kron, S. J., Spudich, J. A. Fluorescent actin filaments move on myosin fixed to a glass surface. Proceedings of the National Academy of Sciences of the United States of America. 83 (17), 6272-6276 (1986).
- Yanagida, T., Nakase, M., Nishiyama, K., Oosawa, F. Direct observation of motion of single F-actin filaments in the presence of myosin. Nature. 307 (5946), 58-60 (1984).
- Tsuda, Y., Yasutake, H., Ishijima, A., Yanagida, T. Torsional rigidity of single actin filaments and actin-actin bond breaking force under torsion measured directly by in vitro micromanipulation. Proceedings of the National Academy of Sciences of the United States of America. 93 (23), 12937-12942 (1996).
- Stewart, T. J., et al. Actin sliding velocities are influenced by the driving forces of actin-myosin binding. Cellular and Molecular Bioengineering. 6 (1), 26-37 (2013).
- Harada, Y., Sakurada, K., Aoki, T., Thomas, D. D., Yanagida, T. Mechanochemical coupling in actomyosin energy transduction by in vitro movement assay. Journal of Molecular Biology. 216 (1), 49-68 (1990).
- Fordyce, P. M., Valentine, M. T., Block, S. M. Advances in surface-based assays for single molecules. Single-Molecule Techniques: A Laboratory Manual. , 431-460 (2008).
- Ozeki, T., et al. Surface-bound casein modulates the adsorption and activity of kinesin on SiO2 surfaces. Biophysical Journal. 96 (8), 3305-3318 (2009).
- Neuman, K. C., Nagy, A. Single-molecule force spectroscopy: Optical tweezers, magnetic tweezers and atomic force microscopy. Nature Methods. 5 (6), 491-505 (2008).
- Neuman, K. C., Block, S. M. Optical trapping. Review of Scientific Instruments. 75 (9), 2787-2809 (2004).
- Thoresen, T., Lenz, M., Gardel, M. L. Thick filament length and isoform composition determine self-organized contractile units in actomyosin bundles. Biophysical Journal. 104 (3), 655-665 (2013).
- Matusovsky, O. S., et al. Millisecond conformational dynamics of skeletal Myosin II power stroke studied by high-speed atomic force microscopy. ACS Nano. 15 (2), 2229-2239 (2021).
- Reinemann, D. N., et al. Collective force regulation in anti-parallel microtubule gliding by dimeric Kif15 kinesin motors. Current Biology. 27 (18), 2810-2820 (2017).
- Cordova, J. C., et al. Bioconjugated core-shell microparticles for high-force optical trapping. Particle and Particle Systems Characterization. 35 (3), 1-8 (2018).
- Reinemann, D. N., Norris, S. R., Ohi, R., Lang, M. J. Processive Kinesin-14 HSET exhibits directional flexibility depending on motor traffic. Current Biology. 28 (14), 2356-2362 (2018).
- Forth, S., Hsia, K. C., Shimamoto, Y., Kapoor, T. M. Asymmetric friction of nonmotor MAPs can lead to their directional motion in active microtubule networks. Cell. 157 (2), 420-432 (2014).
- Shimamoto, Y., Kapoor, T. M. Analyzing the micromechanics of the cell division apparatus. Methods in Cell Biology. 145, 173-190 (2018).
- Shimamoto, Y., Forth, S., Kapoor, T. M. Measuring pushing and braking forces generated by ensembles of Kinesin-5 crosslinking two microtubules. Developmental Cell. 34 (6), 669-681 (2015).
- Thoresen, T., Lenz, M., Gardel, M. L. Reconstitution of contractile actomyosin bundles. Biophysical Journal. 100 (11), 2698-2705 (2011).
- Murrell, M., Thoresen, T., Gardel, M. Reconstitution of contractile actomyosin arrays. Methods in Enzymology. 540 (11), 265-282 (2014).
- Weirich, K. L., Stam, S., Munro, E., Gardel, M. L. Actin bundle architecture and mechanics regulate myosin II force generation. Biophysical Journal. 120 (10), 1957-1970 (2021).
