The present protocol combines functional near-infrared spectroscopy (fNIRS) and video-based observationto measure interpersonal synchronization in quartets during a collaborative drawing task.
A subscription to JoVE is required to view this content. Sign in or start your free trial.
Method Article
Group Synchronization During Collaborative Drawing Using Functional Near-Infrared Spectroscopy
In This Article
Summary
Abstract
Functional near-infrared spectroscopy (fNIRS) is a noninvasive method particularly suitable for measuring cerebral cortex activation in multiple subjects, which is relevant for studying group interpersonal interactions in ecological settings. Although many fNIRS systems technically offer the possibility to monitor more than two individuals simultaneously, establishing easy-to-implement setup procedures and reliable paradigms to track hemodynamic and behavioral responses in group interaction is still required. The present protocol combines fNIRS and video-based observation to measure interpersonal synchronization in quartets during a cooperative task.This protocol provides practical recommendations for data acquisition and paradigm design, as well as guiding principles for an illustrative data analysis example. The procedure is designed to assess differences in brain and behavior interpersonal responses between social and non-social conditions inspired by a well-known ice-breaker activity, the Collaborative Face Drawing Task. The described procedures can guide future studies to adapt group naturalistic social interaction activities to the fNIRS environment.
Introduction
Interpersonal interaction behavior is an important component of the process of connecting and creating empathic bonds. Previous research indicates that this behavior can be expressed in the occurrence of synchronicity, when biological and behavioral signals align during social contact. Evidence shows that synchronicity can occur between people interacting for the first time1,2,3. Most studies on social interactions and their underlying neural mechanisms use a single person or second person approach2,4, and little is known about transposing this knowledge to group social dynamics. Evaluating interpersonal responses in groups of three or more individuals is still a challenge for scientific research. This leads to the necessity of bringing to the laboratory the complex environment of social interactions in everyday human beings under naturalistic conditions5.
In this context, the functional near-infrared spectroscopy (fNIRS) technique is a promising tool for assessing the relationships between interpersonal interaction in naturalistic contexts and its brain correlates. It presents fewer restrictions on participant mobility compared to functional magnetic resonance imaging (fMRI) and is resilient to motion artifacts6,7. The fNIRS technique works by assessing hemodynamic effects in response to brain activation (changes in blood concentration of oxygenated and deoxygenated hemoglobin). These variations can be measured by the amount of diffusion of infrared light through scalp tissue. Previous studies have demonstrated the flexibility and robustness of the technique in ecological hyperscanning experiments and the potential to expand knowledge in applied neuroscience6,8.
The choice of an experimental task for the naturalistic assessment of the neural correlates of social interaction processes in groups is a crucial step in approaching applied neuroscience studies9. Some examples already reported in the literature with the use of fNIRS in group paradigms include music performance10,11,12, classroom interaction8, and communication13,14,15,16,17.
One of the aspects not yet explored by previous studies is the use of drawing games that have as the main feature the manipulation of empathic components to assess social interaction. In this context, one of the games frequently used to induce social interaction in dynamics among strangers is the collaborative drawing game18,19. In this game, sheets of paper are divided into equal parts, and the group participants are challenged to draw shared self-portraits of all members. In the end, each member has their portrait drawn in a collaborative way by several hands.
The objective is to promote quick integration among strangers, provoked by directing visual attention to the faces of the group partners. It can be considered an "ice-breaking" activity due to its ability to support curiosity and consequent empathic processes among the members19.
One of the advantages of using drawing tasks is their simplicity and ease of reproduction20. They also do not require any specific technical training or skills, as seen in the studies using musical performance paradigms21,22,23,24. This simplicity also enables the choice of a more naturalistic stimulus within a social context4,9,25.
Besides being an instrument for inducing social behavior in groups, drawing is also considered a tool for psychological evaluation26. Some graphic-projective psychological tests, such as House-Tree-Person (HTP)27,28,29, Human Figure Drawing - Sisto Scale27, and Kinetic Family Drawing30 are used in a complementary way for qualitative and quantitative diagnoses. Their results usually express unconscious processes, giving clues about the individual's symbolic system and, therefore, their interpretations of the world, experiences, affections, etc.
The practice of drawing makes one think and helps create meaning for experiences and things, adding sensations, feelings, thoughts, and actions31. It gives clues about how to perceive and process these life experiences26. Drawing uses visual codes to allow one to understand and communicate thoughts or feelings, making them accessible to manipulation and, thus, creating the possibility for new ideas and readings31.
In art therapy, drawing is a tool to work on attention, memory, and organization of thoughts and feelings32, and it can be used as means to produce social interaction33.
This study aimed to develop a naturalistic experimental protocol to assess vascular and behavioral brain responses during interpersonal interaction in quartets using a collaborative drawing dynamic. In this protocol, the evaluation of the brain responses of the quartet (individually and the synchronicity between partners) and the possible outcome measures, such as behavioral measures (drawing and gaze behavior) are proposed. The aim is to provide more information on social neuroscience.
Access restricted. Please log in or start a trial to view this content.
Protocol
The methodology was approved by the Hospital Israelita Albert Einstein (HIAE) Ethics Committee and is based on a procedure for collecting neural data (fNIRS), as well as gaze behavior data, with young adults during a collaborative drawing experience. All collected data were managed on the Redcap platform (see Table of Materials). The project was audited by the Scientific Integrity Committee of the Hospital Israelita Albert Einstein (HIAE). Young adults, 18-30 years old, were selected as subjects for the present study. Written informed consent was obtained from all participants.
1. Preparation for the study
- Subjects
- Determine the target study sample.
- Inform all volunteers about the experimental protocol and their rights, prior to the game. Ensure that they sign an informed consent form and an image use consent form (not mandatory), fill in a registration form, and answer psychological questionnaires and scales.
- Control the level of relationship between participants of the quartet (strangers, friends, partners, etc.), as previous knowledge may interfere. In this study, the quartets were composed of strangers.
- Compose quartets of same-gender individuals.
NOTE: This gender criterion avoids social interaction interferences34,35.
- Setting
- Remove all potential eye distractors from the scene.
- To set up, include a square table, four stools (measuring 18.11 in x 14.96 in), and two wire supports (e.g., tripod) (Figure 1).
- Turn off all electrical devices such as air conditioning during the experimental condition. Ensure that the room has sufficient lighting for people to observe and draw and that the room temperature is pleasant.
- Consider the extent of fNIRS wires (see Table of Materials), position all cables so that they remain stable during the experimental task.
- Consider space for two researchers to move along the setting.
- Ensure that experimenters follow their scripts and movement schemes.
- Position the quartet on the square table, two by two, so that each individual can observe the other three individuals.
- Give each quartet participant a tag with a number (1 to 4). Ensure Subject 1 sits across from Subject 3 and next to Subject 2.
NOTE: The tag number corresponded to subjects position on the table and their previously prepared cap (Table of Materials).
- Drawing paradigm
- Collaborative face drawing-the social condition
NOTE: This game's goal is to direct the visual attention of the subjects to their partners' faces, inducing them to more conscious observation among themselves. By connecting feelings and visual perception, the collaborative face drawing technique is a valuable way to activate empathic responses, interpersonal curiosity, and connectivity among participants. It requires theory of mind capacity, which includes imitation and anticipating others' behavior19. Use the following steps:- Instruct the participants about the game rules.
- Divide each paper into three horizontal strips, namely drawing strips.
- Have each strip correspond to a social drawing condition (e.g., C1, C2.). After every social drawing condition, change papers among the quartet.
- Have participants draw the forehead and eye area, on the top strip of all paper sheets.
NOTE: The middle strip is for depicting the nose and mouth area. The bottom strip is for depicting the chin, neck, and shoulder area. - Include instructions of who to draw (e.g., S1/S3 meaning that participant 1 draws participant 3 and vice versa) in all paper strips.
- Have each paper representing a fully drawn portrait of a participant.
NOTE: Consider different pastel writing paper colors for the different game phases. - Have each participant's face depicted in a collaborative way by their partners. (Figure 2)
- Connect the dots game-the non-social condition
NOTE: The control drawing condition is a game of connecting the dots. Each participant is invited to connect the dots of ascendent serial numbers to form a drawing. The connect the dots game is used as a neuropsychological instrument to measure cognitive domains such as mental flexibility and visual-motor skills36. The game stimulates visuospatial skills, increases mental activity37, and enhances mental abilities38. Use the following steps: - Instruct the participants.
- Once the cap is in position, instruct the participants about fNIRS, the equipment, the caps, the wires, and the possible risks or discomforts involving the procedure.
- Remind them again about their right to leave the experiment at any time.
- Explain the two different drawing tasks.
- For the collaborative drawing, explain the horizontal strips and how to know where and who to draw in each strip.
- For the connect dots game, explain that they will have to connect the numbers in ascending order until the figure is revealed.
- Explain about the resting period and the recorded task commands.
- Engage the participants to observe their partners and the details that differentiate them. Indicate that, at the end of the study, the quartet that follows the rules and draws the most detailed figures will be rewarded.
- Collaborative face drawing-the social condition
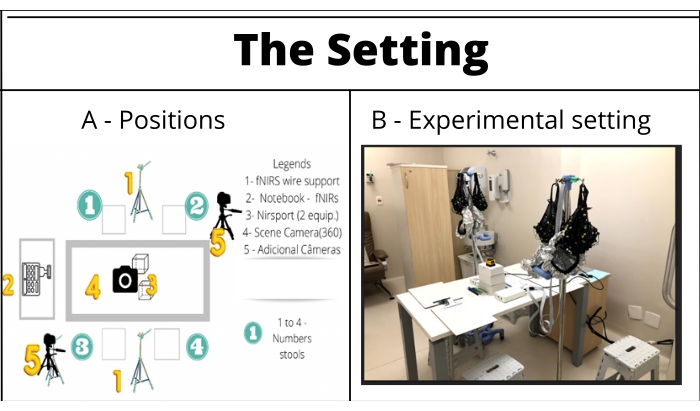
Figure 1: The setting. The setup includes a squared table, four stools, and two wire supports (e.g., tripod), fNIRS equipment, a computer, and the cameras. (A) The setting scheme: Green numbers (1-4) correspond to the participants' labels and their stools/positioning at the table during the experimental run. Yellow numbers: 1 = fNIRS wiring supports, 2 = fNIRS signals' notebook receiver, 3 = NIRSport, 4 = 360° camera, 5 = support cameras. (B) Setting ready for the experimental run. Please click here to view a larger version of this figure.
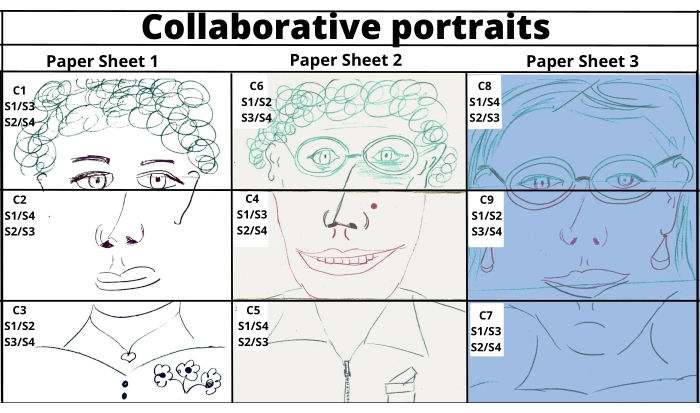
Figure 2: Collaborative portraits-examples of portraits drawn in a collaborative way. Please click here to view a larger version of this figure.
2. Experimental paradigm
- Adapt the game for fNIRS acquisition
NOTE: Adapt the game so that it is possible to capture the functional image of the brain through fNIRS and that data has a significant quality.- Define the number of blocks.
NOTE: The conditions must be repeated an adequate number of times to reduce the margin of error in the results. However, many repetitions can lead participants to automate tasks. - Plan the duration of each block.
NOTE: Consider the hemodynamic caption response time (on average 6 s after the beginning of a task). Also, consider the influence of block sizes to determine the filter for the following steps. - Add a resting state period at the end of each block of both conditions (so that the hemodynamic signal decays before the start of the next block).
- Plan the order of blocks and create pseudo-randomized block sequences to reduce anticipatory effects.
- Plan the total duration of the game.
NOTE: Consider participants' possible discomfort regarding the fNIRS tight caps and their proximity to each other. The blocks and conditions used in this protocol were designed as follows: nine blocks of the social condition of collaborative drawing (Table 1) and nine blocks of the non-social condition of connecting dots were created (duration = 40 s each); A resting period of 20 s between each of the blocks; three different sequences (Table 2) to perform the tasks (to avoid a condition being performed more than two times in a row). The experimental task duration was approximately 18 min.
- Define the number of blocks.
- Paradigm programming software
- Use a software to assist in creating and organizing paradigm blocks and signaling to the participants when to start a new task.
NOTE: The NIRStim software (see Table of Materials) was used in this case. Create the block sequences and program their distribution over the time during the experiment. - Define events with visual (text and images) or auditory contents to indicate to the participants when to begin each task. In the Events tab, click on the button Add Event. Name the event in Event Name, select the event type in Stim Type, and define a color to represent the event in a presentation overview on Color-ID. Create markers to send to the acquisition software at the beginning of these tasks on Event Marker.
- Determine the task execution order and the number of repetitions of each one of them in the Trials tab. Also, insert rest periods. Determine the duration of both. Randomizing or not randomizing the trials is possible by selecting On/Off on Randomize Presentation; save the settings on the Save button.
- During the experimental run, display all the stimuli programmed in a black window (to prevent participant distraction) by pressing Run.
- Use a software to assist in creating and organizing paradigm blocks and signaling to the participants when to start a new task.
Table 1: Collaborative drawing condition. S1 = Subject 1, S2 = Subject 2, S3 = Subject 3 and S4 = Subject 4. Drawing dyads represents who is drawing who, and the drawing strip represents the writing paper's position for drawing in each condition. For example, for the first Block, use a blue paper sheet. C1, C2, and C3 represent 40 s of the paradigm of drawing social conditions that complete one portrait. C1 (drawing the forehead area, drawing dyads: S2 and S4; S1 and S3), C2 (drawing the nose area, drawing dyads: S1 and S4; S2 and S3) and C3 (drawing the chin area, drawing dyads: S3 and S4; S1 and S2). Follow the diagram for Blocks 2 and 3. This randomization maintains the order of drawing among volunteers (drawing the frontal partner, then the front-side partner, and lastly, the partner sitting next to them) and alters the order of the sheet strips to be drawn. Please click here to download this Table.
Table 2: Sequence 1-task randomization (social, non-social, and resting). Please click here to download this Table.
3. Video setup and data acquisition
- Cameras and video recording
- Select a commercially available scene camera (360°, see Table of Materials). Position that on the table so that all the participants' eye and head movements can be perceived simultaneously.
- Clean and check the memory card and battery. Check the brightness of the image. Test these items before the participants are located.
- Check for possible interferences on fNIRS reception. If so, increase the space between the equipment and its receiver.
- The equipment receiver must be independent of the fNIRS data receiver. Consider a notebook or a tablet located as far as possible from the table setting.
- Start the equipment, check the interface, and set the recording mode before fNIRS calibration.
- Consider one or two adjacent or supporting cameras that can be placed after both edges of the table.
- Video analysis
- For valuable statistical results, select a synchronized view/analysis software or platform that allows the transcription and coding of several video contents simultaneously, like INTERACT (see Table of Materials).
- Set parameters that enable the search for patterns/sequences to refine observational data to the research questions, e.g., individual gaze behavior metrics, head and eye movement, hand movement, facial expressions, and talking behavior.
- If one plans to record physiological measures, consider a software (see Table of Materials) that allows the integration of measured data from other acquisition systems.
- In the analysis process, consider not only the duration of events but also the sequence, their position in time, and how they relate to each other.
- Data extraction
- Start by downloading the video from all cameras (MP4 format). Load them into INTERACT. Segment the video data for coding and further analysis. For data extraction, mark the video sections manually and provide them with codes.
NOTE: The purpose of segmenting and coding is to provide data categories so that the researcher can highlight and analyze different target behaviors. - Segmentation
- By pressing Code Settings, create a first tier by dividing the block sections into social and non-social conditions and resting period. Create a second tier by dividing participants' behavioral data along with social conditions (face drawing). Align them by using the audio trigger timeline. Manually mark the start and end of each condition. Define the coding scheme following the guidelines (steps 3.3.2.2.-3.3.2.6.).
- Ensure that the coding scheme tracks behavior cues (duration and quantity) for each face drawing section (social condition) from all participants individually.
- Code for object-related attention-participant's gaze toward the drawing partner.
NOTE: Gaze behavior has a dual function: gathering information from others (encoding), as well as communicating to others (signaling)39,40. - Code for mutual gaze (when both partners that are drawing one another share visual contact).
NOTE: Recent studies revealed increased activity in the anterior rostral medial prefrontal cortex (arMPFC) and its coupling with the inferior frontal gyrus (IFG) when partners established mutual gaze41. - Code for associated behaviors during gaze behavior (single or mutual) such as smiling, direct speech, facial expressions, and laughs, indicating higher attentiveness to the drawing partner (Supplementary Figure 1).
- Transcribe and subdivide into categories the group participants' gaze behavioral data. Create interaction codes for each participant by labeling them. Make explicit the target behavior and tag number while coding.
- Coding and analyses
NOTE: One of the researchers must undertake the behavioral coding task and analysis, since they are easily identified in the video. Observe the following:- The extraction of the information must occur manually; mark on the timeline of each condition the observed behaviors according to the coding scheme. Mark the duration of each behavior. Do this for each participant separately.
- Cross-reference the participants' timelines to look for shared behaviors. Return to the video observation to analyze the quality of sharing (Supplementary Figure 2).
- Using the Export key, export the raw data as a text file or table file so that data can be sorted along the timeline, selected, counted, and tabled.
NOTE: In this protocol, the sequential analysis function was not used due to the small number of coded event sequences42.
- Start by downloading the video from all cameras (MP4 format). Load them into INTERACT. Segment the video data for coding and further analysis. For data extraction, mark the video sections manually and provide them with codes.
- Drawing metrics
NOTE: This protocol uses drawing metrics to study possible correlations between participants' gaze behavior and the applied psychological tests. The following criteria were determined:- Stroke quantity: Manually count the number of drawing strokes made by each participant in every face drawing section.
- Line continuity: Subdivide categories of long and short drawn lines. Manually count participants' long and short drawn lines.
NOTE: Observational drawing results from direct observation of a chosen real object. Some recent studies found a correlation between line length and tracing or drawing tasks. Tracing task lines tend to be longer than drawing task lines43. This protocol associates tracing with memorized images that the individual has made stable and carries as drawing references in his/her symbolic system18. - Drawing patterns: Relate to individual drawing patterns18 (Figure 3).
NOTE: This protocol considers a binary classification for drawing pattern: 0, when the participant is in observational drawing mode (i.e., when the participant observes his/her drawing object and copies what he/she sees); and 1, when the drawing reflects internal stable memorized images (when there is a pattern of repeating shapes such as eyes, mouth, and hair throughout the drawing conditions). - Observe details, including counting drawn details during the experiment (example.g., wrinkles, spots, eye shape, and eyebrow size, among others).
NOTE: Drawn details may indicate greater attention to the object of drawing.
- Psychological tests
- Screen for symptoms of anxiety and depression, attention-deficit/hyperactivity disorder, and social skills when conducting group studies. Use free or commercially available scales.
NOTE: This protocol suggests using the following: the Hospital Anxiety and Depression Scale44; the Social Skills Inventory45 (an inventory that evaluates the individual's social skills repertoire); and the Adult Self-Report Scale (ASRS-18) for the assessment of attention-deficit/hyperactivity disorder (ADHD) in adults46.
- Screen for symptoms of anxiety and depression, attention-deficit/hyperactivity disorder, and social skills when conducting group studies. Use free or commercially available scales.

Figure 3: Examples of individual drawing patterns. Please click here to view a larger version of this figure.
4. fNIRS setup and data acquisition
- Data acquisition hardware
- Ensure to use acquisition hardware for the fNIRS registrations. The recordings must be performed by a combination of systems that can be read in the same recording program, totaling 16 channels.
NOTE: Data acquisition was carried out using two continuous-wave systems (NIRSport, see Table of Materials) for the present study. Each piece of equipment has eight LED illumination sources emitting two wavelengths of near-infrared light (760 nm and 850 nm) and eight optical detectors (7.91 Hz).
- Ensure to use acquisition hardware for the fNIRS registrations. The recordings must be performed by a combination of systems that can be read in the same recording program, totaling 16 channels.
- fNIRS optode channel configuration
- Use the NIRSite tool to locate the optodes over the PFC regions (see Table of Materials). Configure the distribution of optodes on the caps in a way that the channels are positioned above the regions of interest on all the participants' heads.
- Divide the optodes among the four participants for the simultaneous acquisition of signals.
NOTE: The caps must have a configuration based on the international 10-20 system, and the anatomical areas of interest include the most anterior portion of the bilateral prefrontal cortex. For this protocol, optode placement was guided by the fNIRS Optodes' Location Decider (fOLD) toolbox47. The ICBM 152 head model (see Table of Materials) parcellation generated the montage. The recruitment of the prefrontal cortex region in social interaction tasks has been explained as a correlate of behavior control processes, including self-regulation48. Figure 4 represents the position of the sources and detectors.
- Preventing artifacts
- Remove distractors from the room where the game will take place.
- Advise the volunteers to move only as necessary.
- During the experiment, disconnect the NIRSport amplifier and the laptop from the electrical network.
- Turn any other equipment that works near the infrared spectrum off, such as air conditioning equipment. Turn off electrical devices present in the environment.
- Setting the fNIRS apparatus
- Previously, measure the brain perimeters of the four participants as follows: measure the distances between the nasion and the inion around the head to determine each participant's cap size. Always use a cap of a smaller size in relation to the perimeter of the head in order to give more stability to the optodes.
- On the day of the acquisition, instruct the participants to sit on the stool and then explain the expected process of placing the cap on the head.
- Fit the sources and detectors to the cap according to the predetermined settings. As a matter of organization, follow the pattern of using the optodes 1 to 4 on Subject 1, from 5 to 8 on Subject 2, from 9 to 12 on Subject 3, and from 13 to 16 on Subject 4.
- Put the caps on the participants' heads and position them so that the central midline (Cz) is at the top of the head. To check if Cz is at the central position, certify that it is located at half the distance between the nasion and inion.
- Also, measure the distance between the left and right ear (Crus of Helix) above the top of the head and Position Cz.
- Use overcaps to prevent ambient lights from interfering with the data acquisition.
- Connect the wires of the optodes to the amplifiers. As a matter of organization, follow the pattern of connecting optodes 1 to 8 to NIRSport 1 and optodes 9 to 16 to NIRSport2.
- Connect both NIRSport 1 and 2 to the computer via a USB cable.
- Data acquisition software
- After setting up the equipment, enable a software to acquire the fNIRS data. In this study, the NIRStar (see Table of Materials) software was used. On NIRStar, carry out the following steps:
- Click on Configure Hardware on the menu bar. Select the option Tandem Mode on the Hardware Specification tab so the hyperscanning can be performed.
- On the Configure Hardware tab, select a montage from among the predefined common montages or from the customized ones, and check the settings in Channel Setup and Topo Layout.
- Perform an automatic calibration by clicking Calibrate on the Display Panel. The signal quality indicator allows the verification of the integrity of the received data. Assess whether the quality of the data is enough to start the acquisition; that is, see if the channels are signaled as green or yellow.
NOTE: If the directed channels are represented in red or white, remove them from the cap, check that there is no hair preventing the light from reaching the head, and clean the optodes with a cloth or towel. Connect them again to the cap and repeat the calibration. - When ready to start the procedure, have a preview of how the signals are being received by clicking on Preview. Then, start recording the signals on Record.
- Open NIRStim, the blocks programming software (see Table of Materials), and start the presentation of the programmed blocks. The markers must be registered automatically, and their marking must be seen on the fNIRS data acquisition software.
- After the end of the procedure, stop recording by clicking on Stop, close the software, and verify if the file is saved in the chosen directory.
- After setting up the equipment, enable a software to acquire the fNIRS data. In this study, the NIRStar (see Table of Materials) software was used. On NIRStar, carry out the following steps:
- fNIRS data analysis
- Preprocess the signals using NIRSLAB software49 (see Table of Materials). Follow the steps below:
- Apply a band-pass temporal filter (0.01-0.2 Hz) to the raw intensity data to remove cardiac and respiratory frequencies, as well as very low-frequency oscillations.
- For signal quality control, determine exclusion criteria for each channel gain above eight and coefficient of variation above 7.5%.
- Compute the changes in HbO2 and HHb by applying the modified Beer-Lambert law with the whole time series as a baseline.
NOTE: In this study, HbO2 and HHb time series were segmented into blocks (social and non-social) and exported as text files for subsequent analysis in the R platform8 for statistical computing (see Table of Materials). - Analyze separately the social and control conditions. Construct a correlation matrix for each of the nine blocks of each condition so that its elements correspond to the correlation (Spearman) between each pair of subjects in the evaluated channel. For the statistical significance of the correlations between individuals across the task, use the t-test8 for a one-sample mean, considering a significance level of 5%.
- Preprocess the signals using NIRSLAB software49 (see Table of Materials). Follow the steps below:
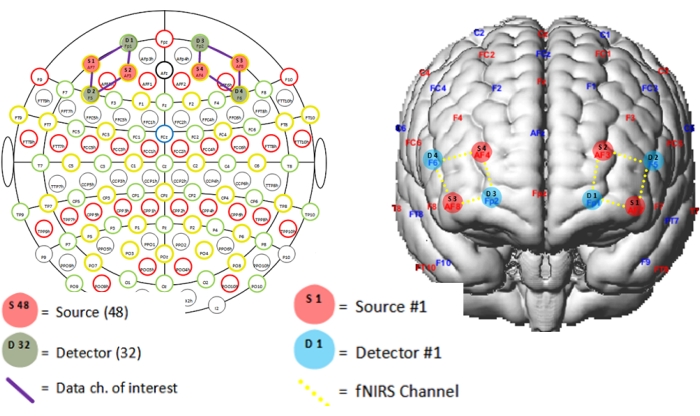
Figure 4: Distribution of optodes on the Subject 1 cap. The letters S and D represent the sources and detectors, respectively. S1 on AF7 coordinate of the 10-20 system; S2 on AF3; S3 on AF8; S4 on AF4; D1 on Fp1; D2 on F5; D3 on Fp2; and D4 on F6. The channels are placed in the following configuration: channel 1 between S1-D1; 2 between S1-D2; 3 between S2-D1; 4 between S2-D2; 5 between S3-D3; 6 between S3-D4; 7 between S4-D3; and 8 between S4-FD4. Please click here to view a larger version of this figure.
Access restricted. Please log in or start a trial to view this content.
Results
The protocol was applied to a quartet composed of young women (24-27 years old), all of them students on postgraduate programs (Hospital Israelita Albert Einstein, São Paulo, Brasil), with master's or doctorate level education. All participants were right-handed, and only one reported having previous drawing experience. No participants had a reported history of neurological disorders.
For the scales and psychological test results, two participants (2 and 4) showed high scores for anxiety (17 a...
Access restricted. Please log in or start a trial to view this content.
Discussion
This study aimed to create a protocol using hyperscanning on four brains concurrently under naturalistic conditions. The experimental paradigm used different drawing tasks and the correlation of multiple outcome measures, drawing metrics, behaviors, and brain signals. The critical steps within this protocol are the consideration of the challenges arising from its high complexity and the maintenance of its ecological and naturalistic conditions.
Video observation was key to this study. It ...
Access restricted. Please log in or start a trial to view this content.
Disclosures
Paulo Rodrigo Bazán has provided freelance scientific consulting to NIRx Medizintechnik GmbH and to Brain Support Corporation, which is a distributor of NIRx Medizintechnik GmbH. The other authors declare that there are no conflicts of interest with respect to the authorship or the publication of this article.
Acknowledgements
The authors thank Instituto do Cérebro (InCe-IIEP) and Hospital Israelita Albert Einstein (HIAE) for this study support. Special thanks to José Belém de Oliveira Neto for the English proofreading of this article.
Access restricted. Please log in or start a trial to view this content.
Materials
| Name | Company | Catalog Number | Comments |
|---|---|---|---|
| 2 NIRSport | NIRx Medizintechnik GmbH, Germany | Nirsport 88 | The equipment belong to InCe ( Instituto do Cérebro - Hospital Israelita Albert Einstein). two continuous-wave systems (NIRSport8x8, NIRx Medical Technologies, Glen Head, NY, USA) with eight LED illumination sources emitting two wavelengths of near-infrared light (760 and 850 nm) and eight optical detectors each. 7.91 Hz. Data were acquired with the NIRStar software version 15.2 (NIRx Medical Technologies, Glen Head, New York) at a sampling rate of 3.472222. |
| 4 fNIRS caps | NIRx Medizintechnik GmbH, Germany | The blackcaps used in the recordings had a configuration based on the international 10-20 | |
| Câmera 360° - Kodak Pix Pro SP360 | Kodak | Kodak PixPro: https://kodakpixpro.com/cameras/360-vr/sp360 | |
| Cameras de suporte - Iphone 8 | Apple | Iphone 8 | Supporting Camera |
| fOLD toolbox (fNIRS Optodes’ Location Decider) | Zimeo Morais, G.A., Balardin, J.B. & Sato, J.R. fNIRS Optodes’ Location Decider (fOLD): a toolbox for probe arrangement guided by brain regions-of-interest. Scientific Reports. 8, 3341 (2018). https://doi.org/10.1038/s41598-018-21716-z | Version 2.2 (https://github.com/nirx/fOLD-public) | Optodes placement was guided by the fOLD toolbox (fNIRS Optodes’ Location Decider, which allows placement of sources and detectors in the international 10–10 system to maximally cover anatomical regions of interest according to several parcellation atlases. The ICBM 152 head model parcellation was used to generate the montage, which was designed to provide coverage of the most anterior portion of the bilateral prefrontal cortex |
| Notebook Microsoft Surface | Microsoft | Notebook receiver of the fNIRS signals | |
| R platform for statistical computing | https://www.r-project.org | R version 4.2.0 | R is a free software environment for statistical computing and graphics. It compiles and runs on a wide variety of UNIX platforms, Windows and MacOS |
| REDCap | REDCap is supported in part by the National Institutes of Health (NIH/NCATS UL1 TR000445) | REDCap is a secure web application for building and managing online surveys and databases. | |
| software Mangold Interact | Mangold International GmbH, Ed. | interact 5.0 | Mangold: https://www.mangold-international.com/en/products/software/behavior-research-with-mangold-interact.html. Allows analysis of videos for behavioral outcomes and of autonomic monitoring for emotionally driven physiological changes (may require additional software, such as DataView). Allow the use of different camera types simultaneously and hundreds of variations of coding methods. |
| software NIRSite | NIRx Medizintechnik GmbH, Germany | NIRSite 2.0 | For creating the montage and help optode placement and location in the blackcaps. |
| software nirsLAB-2014 | NIRx Medizintechnik GmbH, Germany | nirsLAB 2014 | fNIRS Data Processing |
| software NIRStar | NIRx Medizintechnik GmbH, Germany | version 15.2 | for fNIRS data aquisition: NIRStar software version 15.2 at a sampling rate of 3.472222 |
| software NIRStim | NIRx Medizintechnik GmbH, Germany | For creation and organization of paradigm blocks |
References
- Feldman, R. The neurobiology of human attachments. Trends in Cognitive Sciences. 21 (2), 80-99 (2017).
- Hove, M. J., Risen, J. L. It's all in the timing: Interpersonal synchrony increases affiliation. Social Cognition. 27 (6), 949-960 (2009).
- Long, M., Verbeke, W., Ein-Dor, T., Vrtička, P. A functional neuro-anatomical model of human attachment (NAMA): Insights from first- and second-person social neuroscience. Cortex. 126, 281-321 (2020).
- Redcay, E., Schilbach, L. Using second-person neuroscience to elucidate the mechanisms of social interaction. Nature Reviews Neuroscience. 20 (8), 495-505 (2019).
- Babiloni, F., Astolfi, L. Social neuroscience and hyperscanning techniques: Past, present and future. Neuroscience and Biobehavioral Reviews. 44, 76-93 (2014).
- Balardin, J. B., et al. Imaging brain function with functional near-infrared spectroscopy in unconstrained environments. Frontiers in Human Neuroscience. 11, 1-7 (2017).
- Scholkmann, F., Holper, L., Wolf, U., Wolf, M. A new methodical approach in neuroscience: Assessing inter-personal brain coupling using functional near-infrared imaging (fNIRI) hyperscanning. Frontiers in Human Neuroscience. 7, 1-6 (2013).
- Brockington, G., et al. From the laboratory to the classroom: The potential of functional near-infrared spectroscopy in educational neuroscience. Frontiers in Psychology. 9, 1-7 (2018).
- Sonkusare, S., Breakspear, M., Guo, C. Naturalistic stimuli in neuroscience: Critically acclaimed. Trends in Cognitive Sciences. 23 (8), 699-714 (2019).
- Duan, L., et al. Cluster imaging of multi-brain networks (CIMBN): A general framework for hyperscanning and modeling a group of interacting brains. Frontiers in Neuroscience. 9, 1-8 (2015).
- Ikeda, S., et al. Steady beat sound facilitates both coordinated group walking and inter-subject neural synchrony. Frontiers in Human Neuroscience. 11 (147), 1-10 (2017).
- Liu, T., Duan, L., Dai, R., Pelowski, M., Zhu, C. Team-work, team-brain: Exploring synchrony and team interdependence in a nine-person drumming task via multiparticipant hyperscanning and inter-brain network topology with fNIRS. NeuroImage. 237, 118147(2021).
- Jiang, J., et al. Leader emergence through interpersonal neural synchronization. Proceedings of the National Academy of Sciences of the United States of America. 112 (14), 4274-4279 (2015).
- Nozawa, T., et al. Interpersonal frontopolar neural synchronization in group communication: An exploration toward fNIRS hyperscanning of natural interactions. Neuroimage. 133, 484-497 (2016).
- Dai, B., et al. Neural mechanisms for selectively tuning in to the target speaker in a naturalistic noisy situation. Nature Communications. 9 (1), 2405(2018).
- Lu, K., Qiao, X., Hao, N. Praising or keeping silent on partner's ideas: Leading brainstorming in particular ways. Neuropsychologia. 124, 19-30 (2019).
- Lu, K., Hao, N. When do we fall in neural synchrony with others. Social Cognitive and Affective Neuroscience. 14 (3), 253-261 (2019).
- Edwards, B. Drawing on the Right Side of the Brain: The Definitive, 4th Edition. , Penguin Publishing Group. London, UK. (2012).
- Hass-Cohen, N., Findlay, J. C. Art Therapy & The Neuroscience of Relationship, Creativity, &Resiliency. Skills and Practices. , W.W. Norton & Company. New York, NY. (2015).
- Maekawa, L. N., de Angelis, M. A. A percepção figura-fundo em paciente com traumatismo crânio-encefálico. Arte-Reabilitação. , Memnon Edições Científicas. São Paulo, Brazil. 57-68 (2011).
- Babiloni, C., et al. Simultaneous recording of electroencephalographic data in musicians playing in ensemble. Cortex. 47 (9), 1082-1090 (2011).
- Babiloni, C., et al. Brains "in concert": Frontal oscillatory alpha rhythms and empathy in professional musicians. NeuroImage. 60 (1), 105-116 (2012).
- Müller, V., Lindenberger, U. Cardiac and respiratory patterns synchronize between persons during choir singing. PLoS ONE. 6 (9), 24893(2011).
- Greco, A., et al. EEG Hyperconnectivity Study on Saxophone Quartet Playing in Ensemble. Annual International Conference of the IEEE Engineering in Medicine and Biology Society. 2018, 1015-1018 (2018).
- Osborne-Crowley, K. Social Cognition in the real world: Reconnecting the study of social cognition with social reality. Review of General Psychology. 24 (2), 144-158 (2020).
- Kantrowitz, A., Brew, A., Fava, M. Proceedings of an interdisciplinary symposium on drawing, cognition and education. , Teachers College Columbia University. New York, NY. 95-102 (2012).
- Petersen, C. S., Wainer, R. Terapias Cognitivo-Comportamentais para Crianças e Adolescentes. , Ciência e Arte. Artmed. Brazil. (2011).
- Sheng, L., Yang, G., Pan, Q., Xia, C., Zhao, L. Synthetic house-tree-person drawing test: A new method for screening anxiety in cancer patients. Journal of Oncology. 2019, 5062394(2019).
- Li, C. Y., Chen, T. J., Helfrich, C., Pan, A. W. The development of a scoring system for the kinetic house-tree-person drawing test. Hong Kong Journal of Occupational Therapy. 21 (2), 72-79 (2011).
- Ferreira Barros Klumpp, C., Vilar, M., Pereira, M., Siqueirade de Andrade, M. Estudos de fidedignidade para o desenho da família cinética. Revista Avaliação Psicológica. 19 (1), 48-55 (2020).
- Adams, E. Drawing to learn learning to draw. TEA: Thinking Expression Action. , https://www.nsead.org/files/f7246b7608216d52696dc3ed81256213.pdf (2013).
- Bernardo, P. P. A Prática da Arteterapia. Correlações entre temas e recursos. Vol 1. , Arteterapia. São Paulo, Brazil. (2008).
- Staback, D. DRAWN: Exploring Interaction Through Drawing as Collaborative Play. , Available from: gamelab.mit.edu/wp/wp-content/uploads/2016/08/Staback-Drawn-report.pdf (2016).
- Cheng, X., Li, X., Hu, Y. Synchronous brain activity during cooperative exchange depends on gender of partner: AfNIRS-based hyperscanning study. Human Brain Mapping. 36 (6), 2039-2048 (2015).
- Baker, J., et al. Sex differences in neural and behavioral signatures of cooperation revealed by fNIRS hyperscanning. Scientific Reports. 6, 1-11 (2016).
- Bowie, C. R., Harvey, P. D. Administration and interpretation of the Trail Making Test. Nature Protocols. 1 (5), 2277-2281 (2006).
- Valenzuela, M. J., Sachdev, P. Brain reserve and dementia: A systematic review. Psychological Medicine. 4 (36), 441-454 (2006).
- Johnson, D. K., Storandt, M., Morris, J. C., Galvin, J. E. Longitudinal study of the transition from healthy aging to Alzheimer disease. Archives of Neurology. 66 (10), 1254-1259 (2009).
- Risco, E., Richardson, D. C., Kingstone, A. The dual function of gaze. Current Directions in Psychological Science. 25 (1), 70-74 (2016).
- Capozzi, F., et al. Tracking the Leader: Gaze Behavior in Group Interactions. iScience. 16, 242-249 (2019).
- Cavallo, A., et al. When gaze opens the channel for communication: Integrative role of IFG and MPFC. NeuroImage. 119, 63-69 (2015).
- Kauffeld, S., Meyers, R. A. Complaint and solution-oriented circles: Interaction patterns in work group discussions. European Journal of Work and Organizational Psychology. 18 (3), 267-294 (2009).
- Gowen, E., Miall, R. C. Eye-hand interactions in tracing and drawing tasks. Human Movement Science. 25 (4-5), 568-585 (2006).
- Marcolino, J., Suzuki, F., Alli, L., Gozzani, J., Mathias, L. Medida da ansiedade e da depressão em pacientes no pré-operatório. Estudo comparativo. Revista Brasileira Anestesiologia. 57 (2), 157-166 (2007).
- del Prette, Z., del Prette, A. Inventario de Habilidades Sociais. del Prette, Z., del Prette, A. , Casa do Psicólogo. Brazil. (2009).
- Mattos, P., et al. Artigo Original: Adaptação transcultural para o português da escala Adult Self-Report Scale para avaliação do transtorno de déficit de atenção/hiperatividade (TDAH) em adultos. Revista de Psiquiatria Clinica. 33 (4), 188-194 (2006).
- Zimeo Morais, G. A., Balardin, J. B., Sato, J. R. fNIRS Optodes' Location Decider (fOLD): A toolbox for probe arrangement guided by brain regions-of-interest. Scientific Reports. 8 (1), 3341(2018).
- Davidson, R. J. What does the prefrontal cortex "do" in affect: Perspectives on frontal EEG asymmetry research. Biological Psychology. 67 (1-2), 219-233 (2004).
- Hessels, R. S. How does gaze to faces support face-to-face interaction? A review and perspective. Psychonomic Bulletin and Review. 27 (5), 856-881 (2020).
- Mangold, P. Discover the invisible through tool-supported scientific observation: A best practice guide to video-supported behavior observation. Mindful Evolution. Conference Proceedings. , Klinkhardt. Bad Heilbrunn, Germany. (2018).
- Kandel, E. R. The Age of Insight. The quest to understand the unconscious in art, mind and brain from Vienna 1900 to the present. , Random House Publishing Group. New York, NY. (2012).
- Miall, R. C., Nam, S. H., Tchalenko, J. The influence of stimulus format on drawing-A functional imaging study of decision making in portrait drawing. Neuroimage. 102, 608-619 (2014).
- Gombrich, E. H. Art and Illusion: A study in the psychology of pictorial representation. 6th ed. , Phaidon. New York, NY. (2002).
- Kirsch, W., Kunde, W. The size of attentional focus modulates the perception of object location. Vision Research. 179, 1-8 (2021).
- Deubel, H., Schneidert, W. X. Saccade target selection and object recognition: Evidence for a common attentional mechanism. Vision Research. 36 (12), 1827-1837 (1996).
- Tchalenko, J. Eye movements in drawing simple lines. Perception. 36 (8), 1152-1167 (2007).
- Perdreau, F., Cavanagh, P. The artist's advantage: Better integration of object information across eye movements. iPerceptions. 4 (6), 380-395 (2013).
- Quaresima, V., Bisconti, S., Ferrari, M. A brief review on the use of functional near-infrared spectroscopy (fNIRS) for language imaging studies in human newborns and adults. Brain and Language. 121 (2), 79-89 (2012).
- Holleman, G. A., Hessels, R. S., Kemner, C., Hooge, I. T. Implying social interaction and its influence on gaze behavior to the eyes. PLoS One. 15 (2), 0229203(2020).
- Dikker, S., et al. Brain-to-brain synchrony tracks real-world dynamic group interactions in the classroom. Current Biology. 27 (9), 1375-1380 (2017).
- Gangopadhyay, N., Schilbach, L. Seeing minds: A neurophilosophical investigation of the role of perception-action coupling in social perception. Social Neuroscience. 7 (4), 410-423 (2012).
Access restricted. Please log in or start a trial to view this content.
Reprints and Permissions
