This manuscript describes the establishment of an infectious model of pneumonia in mice and the respective characterization of injury resolution along with methods for growing bacteria and intratracheal instillation. A novel approach using high-dimensional flow cytometry to evaluate the immune landscape is also described.
Method Article
Experimental Model to Evaluate Resolution of Pneumonia
In This Article
Erratum Notice
Important: There has been an erratum issued for this article. View Erratum Notice
Summary
Abstract
Acute respiratory distress syndrome (ARDS) causes acute lung injury, characterized by rapid alveolar damage and severe hypoxemia. This, in turn, leads to high morbidity and mortality. Currently, there are no pre-clinical models that recapitulate the complexity of human ARDS. However, infectious models of pneumonia (PNA) can replicate the main pathophysiological features of ARDS. Here, we describe a model of PNA induced by the intratracheal instillation of live Streptococcus pneumoniae and Klebsiella pneumoniae in C57BL6 mice. In order to evaluate and characterize the model, after inducing injury, we carried out serial measurements of body weight and bronchoalveolar lavage (BAL) for measuring markers of lung injury. Additionally, we harvested lungs for cell count and differentials, BAL protein quantification, cytospin, bacterial colony-forming unit counts, and histology. Lastly, high dimensional flow cytometry was performed. We propose this model as a tool to understand the immune landscape during the early and late resolution phases of lung injury.
Introduction
Acute respiratory distress syndrome (ARDS) remains a common lethal and disabling syndrome that affects approximately 10% of intensive care unit (ICU) patients and up to 23% of individuals under mechanical ventilation, leading to a hospital mortality rate of 35%-46%1. Moreover, the recent COVID-19 pandemic has re-emphasized the importance of studying ARDS. COVID-19 positive cases have accounted for an increase in ARDS mortality, highlighting the limitation of pharmacological therapies2.
In humans, ARDS is characterized by the rapid onset of hypoxemia (PaO2/FiO2 < 300) and evidence of non-hydrostatic bilateral pulmonary edema due to excessive alveolar-capillary permeability and alveolitis3. Although ARDS has been traditionally described as a pattern of acute lung injury (ALI) secondary to a variety of insults, bacterial and viral pneumonia (PNA) remains among the most common causes. Three main pathophysiological stages, namely the exudative, proliferative, and fibrotic stages, have been described, while the two main cardinal features of ARDS are dysregulated inflammation and alveolocapillary disruption4. During these processes, alveolar injury is produced by the release of inflammatory cytokines (e.g., tumor necrosis factor [TNF-α], interleukin [IL-1β, IL-6, IL-8, etc.]), an influx of neutrophils and inflammatory macrophages, and the flooding of protein-rich fluid. Ultimately, these events lead to patchy and bilateral alveolar damage5,6,7,8.
Although significant progress in understanding early lung injury and inflammation has been made, the mechanisms underlying resolution of PNA are less known and should be the focus of future mechanistic investigations. The main objective of this method paper is to provide investigators with an injury-resolution model of infectious pneumonia that can replicate the main pathophysiological features of ARDS. We propose that this model will help to better understand the biological mechanisms underlying resolution of lung inflammation and repair, thus serving as a platform for rescue therapeutics.
The main physiopathology stages occurring during ARDS can be replicated in preclinical animal models of ALI, which should include a histological evidence of inflammatory response, tissue injury, physiological dysfunction, alveolitis, and alteration of the alveolar-capillary barrier9. A mouse model that induces PNA and ALI is advantageous due to its high reproducibility, fast breeding, and the availability of multiple tools to perform mechanistic and molecular studies. There is no single model that fully recapitulates all the features of human ARDS9.
Models of PNA in mice allow replication of the key pathophysiological mechanisms produced by infectious-ARDS in humans, such as the rapid onset, evidence of tissue injury in histology, alveolo-capillary barrier impairment, evidence of inflammatory response, and physiological dysfunction while producing modest mortality10 . Infectious models can be induced by local or systemic delivery of the pathogen, with intranasal, intratracheal, and intravenous administration being the most frequent routes of administration. The intratracheal route allows direct inoculation of the infectious agent into the lungs, decreasing aerosolization and optimizing the delivery11,12.
The methodology for a preclinical murine model of PNA by intratracheal instillation of either live Streptococcus pneumoniae (Spn) or Klebsiella pneumoniae (Kp) is described here. These models represent a good surrogate of ARDS produced by bacterial PNA, possessing several advantages, including: prevalent causes of human PNA-ARDS (community and hospital-acquired); high reproducibility; mortality and injury can be easily titrated (modeling different degrees of pulmonary inflammation) to exhibit a robust inflammatory response, leading to alveolitis and alveolocapillary dysfunction; the evaluation of early and late phases of lung injury and resolution; and the evaluation of therapeutic strategies at different stages of PNA-ARDS.
Protocol
All the animal protocols described in this study were approved by the Institutional Animal Care and Use Committee (ACUC) at the Johns Hopkins University, School of Medicine for the animal protocol MO21M160. In addition, the experiments were performed following the institutional, state, and federal regulations for animal research.
CAUTION: The replication of all the protocols described below requires to be performed in a Biosafety level 2 (BSL-2) cabinet, following all of the institutional BSL-2 guidelines under the biosafety cabinet.
1. Plating bacterial stocks from commercial loops
NOTE: This protocol can be used for growing bacterial stocks for Spn (ATCC 49619) and Kpn (ATCC 43816), starting with the culti-loops obtained from the provider (see Table of Materials for details).
- Warm a 5% sheep blood agar plate for 15 min at 37 °C in an incubator. A cell incubator can be used for this purpose.
- Under the hood, remove the sheath from the bacterial inoculating loop and spread it carefully, streaking into the agar plate, following a zig-zag pattern. Repeat this step using a separate plate as a duplicate. Up to five plates can be streaked with the same loop.
- Incubate the plates overnight at 37 °C for optimal bacteria growth. Passage the bacteria daily for 3 days. Warm the blood agar plates for 15 min at 37 °C, take between 15 to 20 colonies from the first agar plate using a disposable inoculating loop, and spread them into a new, prewarmed agar plate. Label the plate appropriately.
2. Bacteria growth and storage for future use
- After 3 days, pick up to 30 colonies from the blood agar plate with a streak loop, and place it directly into a 250 mL flask containing Todd Hewitt broth (TH broth). Incubate at 37 °C, shaking at 250 rpm, with 5% CO2 for approximately 4 h.
- Take aliquots every 15 min to measure the OD620nm until it reaches 0.3, which is equivalent to approximately 3 x 10⁸ colony forming units (CFU) per mL.
- Aliquot out 1 mL of the new bacteria stock immediately into 2 mL cryogenic vials. Flash freeze the freshly aliquoted vials in liquid nitrogen for 5 min. Store aliquots of bacteria in a -80 °C freezer (vials can be used for up to 6-8 months before they lose potency).
- After 7 days of freezing, the aliquots can be used for animal studies. Therefore, determine the new concentration of the bacteria.
3. Bacteria thawing for intratracheal instillation
- Warm a blood agar plate for 10 min at 37 °C in a shaker. Take one of the new stock vials from the freezer and thaw it down by gentle agitation in a 37 °C water bath for approximately 2 min. Avoid touching the O-ring or cap with the warm water.
- Plate on a blood agar plate to manually count the bacterial colonies. Perform a 1 x 10⁻⁶ dilution, and plate 200 µL from the last dilution in a prewarmed blood agar plate. Do this in duplicates.
- Incubate the plates overnight at 37 °C for optimal growth of the bacteria. The next day, apply the following formula to determine the new bacterial concentration: CFU/mL = (number of colonies x dilution factor) / volume of stock plated
4. Intratracheal instillation of live bacteria
NOTE: This protocol has been optimized to instill a volume of 50 µL intratracheally. Bacterial stocks can be stored for up to 6-9 months. To ensure the bacterial CFU in each vial, make sure to plate it before each experiment, calculate the bacterial stock CFU as described above, and use TH broth for subsequent dilutions.
CAUTION: Under the biosafety cabinet, perform a rodent survival procedure using sterile surgical instruments.
- Anesthetize the mouse by injecting intraperitoneally 100 mg/kg of ketamine and 2.5 mg/kg of acetylpromazine. Repeat for the number of mice being injected at a time.
NOTE: Mice can be exposed to isoflurane to facilitate animal handling. However, an experienced handler who is capable of injecting intraperitoneal anesthetics without causing significant animal distress can avoid isoflurane exposure. The number of mice to inject depends on the expertise of the surgeon. - After all the mice are under appropriate anesthesia, confirm anesthesia by tail pinch. Place the anesthetized mouse on a clean and sterilized surface, hang the animal by the incisors, and gently tape the forelimbs (Figure 1A).
NOTE: To ensure animal wellness, provide corneal lubrication in all the anesthetized animals. Carboxymethylcellulose eye drops can be used, applying one drop per eye. - Shave the neck region and disinfect the area with chlorhexidine and 70% alcohol. Using surgical scissors, make a 1 cm superficial midline neck incision to visualize the trachea (Figure 1B). One small incision should be enough, but if an abundance of fat tissue is seen, carefully dissect the adipose tissue vertically to visualize the trachea.
NOTE: Use sterile gloves and sterile instruments via the tips-only technique. The risk of infection is minimal if the procedure is performed under sterile conditions. - Using forceps, intubate each mouse. Pull the tongue outward gently and introduce a 20 G angio-catheter through the mouth, advancing the catheter into the trachea. Apply gentle pressure over the trachea to facilitate intubation.
NOTE: Because the trachea is anterior to the mouse body, slightly bend the tip of the catheter, as this will help get the angle to successfully intubate the mouse. The neck incision is performed mainly for visualization purposes; alternatively the operator can intubate the trachea blindly. - After intubation, connect the mouse to a respirator to confirm intubation. The regular ventilator parameters used in this procedure are 200 µL of stroke volume and 200 strokes per minute. Turn the ventilator rate up and/or down briefly for quick and easy confirmation.
- After confirming intubation, disconnect the mouse from the respirator and carefully instill 50 µL of the bacterial agent through the angio-catheter using a 200 µL pipet gel loading tip. For control mice, inject 50 µL of sterile TH broth.
- After instilling the bacterial agent, connect the mouse to the respirator again to help restart breathing. Leave the mouse on the respirator for 30-60 s. After injecting all the mice, monitor their breathing. If there's a slow breathing pattern, connect the mice to respirator again.
- Close the incision by adding one small drop of glue on the skin. Bring together the skin folds and apply gentle pressure until the glue dries.
- Place the mice on a heating pad for recovery and closely monitor them until they regain sufficient consciousness. Transfer the mice back in the cage once fully recovered. For post-operative pain/distress management, the mice can be treated with buprenorphine, with a dose of 0.05-0.1mg/kg subcutaneously (SC).
NOTE: Animals with weight loss greater than 20% or experiencing significant distress post-procedure such as lethargy, an inability to reach water or food, labored breathing, impaired response to external stimuli, or decreased mental alertness should be euthanized.
5. Bronchoalveolar lavage and lung harvest
- Euthanize the mouse by placing it in a closed container containing 5% isoflurane. Continue isoflurane exposure for 1 min after the mouse stops breathing. Perform thoracotomy to confirm euthanasia.
NOTE: Confirm euthanasia by visual and physical examination. The heart must have stopped beating and the mice not breathing. Mucous membranes should be white or pale. - Lay the mouse in a supine position on a clean surgical board and hang it by the incisors. Spray the mouse skin with 70% ethanol. Using surgical scissors, make a small superficial midline neck incision to visualize the trachea of the mouse.
- Cannulate the trachea with a 20 G catheter. Carefully, add 1 mL of calcium-free phosphate-buffered saline (PBS) intratracheally, using a 1 mL syringe. Allow full lung expansion, and then aspirate the fluid using the same syringe. Repeat this step for a total of 2 mL.
- Transfer the BAL into a 2 mL aliquot. Perform this step twice for a final volume of 2 mL. Do not lavage the lungs with more than 1 mL at a time, due to the high risk of alveolar space disruption.
- Open the thoracic cavity and expose the lung, heart, and trachea using scissors and forceps. Carefully dissect the diaphragm and remove the rib cage. Make sure not to pinch the lung tissue.
- Transect the abdominal aorta to allow exsanguination. Perfuse the lung tissue by making a small incision of approximately 2 mm in the right ventricle using scissors and inject 5 mL of cold PBS using a 20 G catheter. The PBS should perfuse the lung. If an adequate perfusion is performed, the lung tissue will turn white pale and the PBS will leave the intravascular compartment through the abdominal aorta.
- Carefully, extract the lungs and dissect them from the trachea to perform either histology or further processing to single cell suspension.
- If processing for histology, carefully insert a 20 G catheter to inflate the lungs up to 25 cm H2O with formalin solution (neutral buffered 10%). Once the lungs are insufflated, pass a 3.0 suture string about 5 cm long underneath the trachea, and tie it firmly twice to ensure the formalin stays in the lung tissue. Gently, dissect out the lung from the rest of the tissues and place it in a 15 mL conical tube containing 10 mL of formalin solution.
6. Bronchoalveolar lavage processing
- Centrifuge the BAL at 500 x g at 4 °C for 5 min. Remove the cell-free supernatant in a separate tube and store at -80 °C.
NOTE: Further analysis can be performed in the BAL supernatant, including protein quantification (e.g., BCA assay13) or measurement of specific biomarkers or cytokines (ELISA assays and multiple assays with platforms such as MSD and Luminex). - Lyse the red blood cells by adding 100 µL of lysing buffer for 1 min. Neutralize the lysing reaction by adding 1 mL of PBS. Centrifuge the BAL at 500 x g at 4 °C for 5 min and remove the supernatant.
- Resuspend the cells in PBS (100-300 µL; based on cell pellet size). Perform a cell count with 0.4% trypan blue stain by manual or automated cell counting. Use the remaining pellet for flow cytometry staining and/or cryopreserve (by resuspending in cryopreserving solution) in liquid nitrogen for further testing.
7. Lung processing for single cell suspension
- Gently dissect the lung from the rest of the tissues and place it in a 15 mL conical tube containing 5 mL of cold PBS. Remove the lung from PBS and dry it using a paper towel.
- Prepare a digestion cocktail by adding 1 mg of DNase and 5 mg of collagenase into 1 mL of low glucose Dulbecco's modified Eagle's medium (DMEM). Transfer the lung to a C-tube containing 1 mL of digestion cocktail.
- Transfer the C-tube to the tissue dissociator and follow the standardized protocol for processing lung tissue14.
- Add 10 mL of cold PBS into the C-tube and mix properly. Filter the single cell suspension using a 70 µm cell strainer on top of a 50 mL conical tube. Perform the filtration twice.
- Centrifuge the suspension at 500 x g at 4 °C for 5 min. Carefully decant the supernatant and add 1 mL of lysing buffer for 1 min at room temperature. Add 10 mL of cold PBS to stop the lysing reaction and remove supernatant.
- Centrifuge the suspension at 500 x g at 4 °C for 5 min. Carefully decant the supernatant and add 10 mL of cold PBS.
- Perform a cell count with trypan blue stain by manual or automated cell counting. Use a cell pellet for flow cytometry staining and/or cryopreserve in liquid nitrogen for further testing.
Results
The procedures described above allowed modeling the pathophysiological mechanisms underlying bacterial pneumonia-induced lung injury in mice. To begin to model, C57BL/6 wild-type (WT) mice were obtained from the Jackson Laboratory and bred at the institute's animal facility. Male WT C57BL/6 mice, 8 weeks old, underwent intratracheal inoculation of either TH broth (control), 3 x 10⁶ CFU of live Spn, or 200 CFU of live Kpn. After the infection, the mice were monitored for 6 and 10 days for Spn and Kpn, respectively. Although the infected groups displayed lower body weight compared to the uninfected control, the Spn group recovered their body weight toward baseline, while Kpn-infected mice displayed slow recovery after 6 days of infection (Figure 2A). During the duration of the study, no mice required undergoing euthanasia due to body weight over 20%, and there was no evidence of pain and distress.
We measured lung injury over different intervals. BAL protein concentration and the total cell count for both the BAL and lungs were remarkedly higher in the infected groups (Figure 2). Representative histological sections displaying the inflammatory process in both models were obtained at day 2, 4, and 6 post-inoculation (Figure 3), showing evidence of persistent alveolar inflammation in the Kpn-infected mice (Figure 4), even at day 10. Kpn-infected mice continued the injury by day 10 (Figure 2 and Figure 4), while Spn-infected mice resolved the lung inflammation by day 6 (Figure 2 and Figure 3).
Lung single cell suspensions were used to discriminate the immune landscape by high-dimensional flow cytometry at day 6 post-infection in the Spn model, using an 18-color panel in fluorescence activated cell sorting (FACS). Using t-distributed stochastic neighbor embedding (t-SNE), overall differences in the immune cell composition can be visualized, being remarkable for an increased number of granulocytes (CD45+, CD11b+, CD24+, MHC-II-), interstitial macrophages (CD45+, CD11b+, MHC-II-, CD24-), monocytes (CD45+, CD11b+, MHC-II-, CD24-, CD64-), B cells (CD45+, CD19+), and T cells (CD45+, CD3+), including natural killer cells (CD45+, CD3+, NK1.1+), as displayed in Figure 5. Gating strategies are shown in Figure 6.

Figure 1: Surgical procedure for intratracheal instillation of live bacteria. (A) Position of the mouse in the sterile surgical area, hanging by the incisors. (B) Incision area and trachea exposure. (C) Intubation process inserting the 20 G catheter. Figure created with Biorender.com. Please click here to view a larger version of this figure.
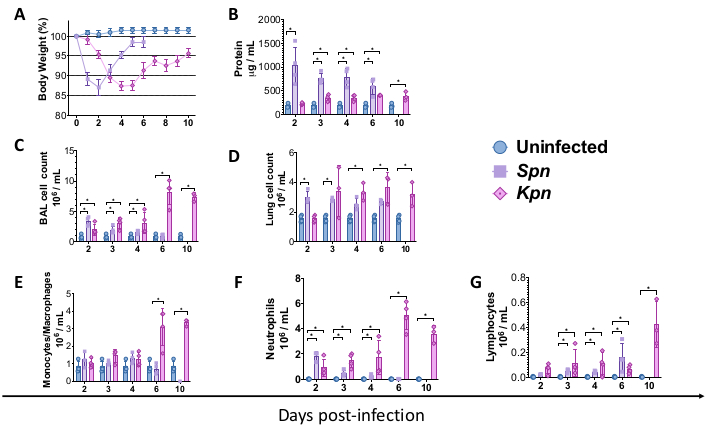
Figure 2: Acute lung injury (ALI) profiles after pneumonia models. (A) Body weight over time relative to baseline, control versus Kpn and Spn (n = 4, per group). (B) BAL total protein quantification by BCA assay (n = 4, per group). (C) BAL total cell counts in control (n = 3), Kpn (n = 4), and Spn (n = 3). (D) Lung total cell counts in control (n = 3), Kpn (n = 4), and Spn (n = 3). (E-G) BAL cell differential by manual histology count of the BAL cytospin in control (n = 3), Kpn (n = 4), and Spn (n = 3). Statistical tests were done by individual t-test, comparing the uninfected control versus the infected groups. *p < 0.05. Data is displayed using standard error (SE) for each plot. The y axis is days post-infection for all panels. Abbreviations: BAL = bronchoalveolar lavage; Spn = Streptococcus pneumoniae; Kpn = Klebsiella pneumoniae. Please click here to view a larger version of this figure.

Figure 3: Lung histopathologic findings during Spn infection. Hematoxylin and eosin (H&E) staining of histological sections of a representative BAL and lung section after the intratracheal infection of Spn and on days 2, 4, and 6. BAL magnification = 100x; lung magnification = 10x. Abbreviations: BAL = bronchoalveolar lavage; Spn = Streptococcus pneumoniae. Please click here to view a larger version of this figure.
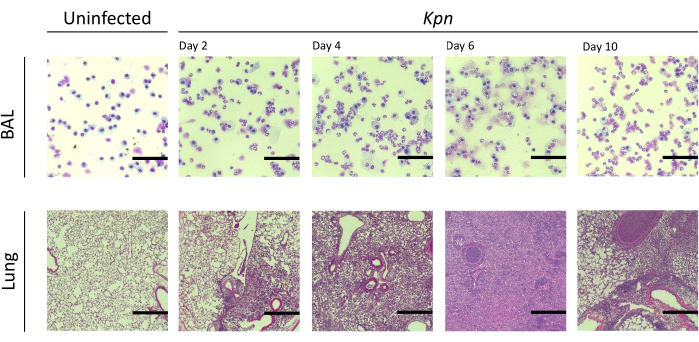
Figure 4: Lung histopathologic findings during Kpn infection. Hematoxylin and eosin (H&E) staining of histological sections of a representative BAL and lung section after the intratracheal infection of Kpn on days 2, 4, 6, and 10. Images show a high power magnification (scale bar = 50 µm). Abbreviations: BAL = bronchoalveolar lavage; Kpn = Klebsiella pneumoniae. Please click here to view a larger version of this figure.

Figure 5: Immune cell landscape by multicolor flow cytometry after 6 days of Spn infection. (A) T-distributed stochastic neighbor embedding (t-SNE) was used to visualize the immune cell populations (CD45+) of the lung comparing the uninfected control versus infected group. (B) Summary of the immune cell frequencies out of the total CD45+ cells in the lung. (C) Total cell count of each individual population. Statistical comparisons were done by t-tests between the control and infected. *p < 0.05, **p < 0.01, ***p < 0,001. Data is displayed using standard error (SE) for each plot. Abbreviations: BAL = bronchoalveolar lavage; Spn = Streptococcus pneumoniae. Please click here to view a larger version of this figure.
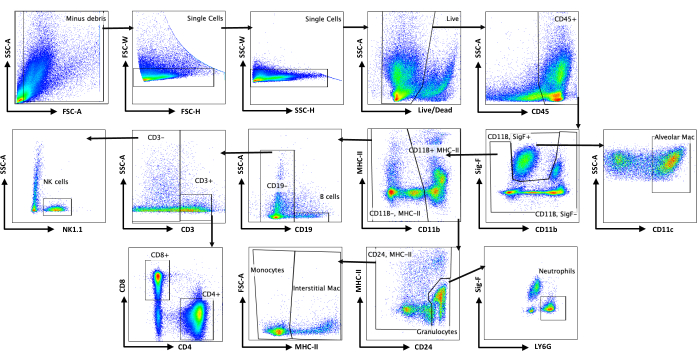
Figure 6: Gating strategies for identifying the immune cell subpopulation in the lungs at baseline and after pneumonia. BAL and Lung cell suspension underwent staining for multicolor flow cytometry. Debris was gated out first using SSC-A and FSC-A, and the single cells were gated by two strategies (SSC-W vs. SSC-H and FSC-W vs. FSC-H). Live cells were identified by using a live/dead discriminator versus SSC-A. Subsequent cell populations were identified by previously identified markers 15. Abbreviation: BAL = bronchoalveolar lavage. Please click here to view a larger version of this figure.
Discussion
Experimental murine models of PNA offer a platform to evaluate the cellular and molecular mechanisms underlying injury and resolution of ARDS. The pathophysiological components that can be evaluated include early inflammatory pathways, bacterial clearance, dynamic immune landscape changes, resolution of inflammation, fibroproliferation, and epithelial and vascular repair16. However, several aspects must be considered when planning to replicate this model of pneumonia-induced lung injury, including age, sex, mouse strain, intrinsic host factors (e.g., immunocompromised state), the specific pathogen and bacterial load used, and the experience of the staff performing the procedure.
PNA is among the leading causes of ARDS. We chose to use live Spn and Kpn, which are prevalent causes of community and hospital acquired PNA in humans, respectively17. We suggest optimizing bacterial models of PNA by titrating doses of live bacteria to achieve the desired mortality and injury resolution profile that best fits the investigator's hypothesis. We have optimized an intratracheal bacteria inoculation of 3 x 10⁶ CFU for Spn and 200 CFU for Kpn in mice, which caused alveolar inflammation, disruption of alveolocapillary barrier, and organ dysfunction (Figure 2). However, bacterial batches from different sources or even within duplicate loops can display different degrees of inflammation and injury, even when using the same strain and CFU.
Therefore, to replicate the results presented in this manuscript, researchers should start with the bacteria concentration described here; however, they may need to increase or decrease the dose to obtain a similar model profile. Hence, every new batch of bacteria utilized needs to be optimized for its potential injury resolution effect. We present a robust model of PNA with two different resolution outcomes, one self-resolving (Spn) and another a slowly/non-resolving (Kpn) which can serve as platforms for investigators to evaluate immunological mechanisms and test therapeutic interventions, particularly at or after peak infection (e.g., 2 days after infection).
Age, sex, strain, and genetic factors impact the kinetics of the injury resolution patterns16. For instance, sex renders accelerated resolution in females compared to males18; therefore, an increase in bacterial load leads to increased mortality and delayed resolution in males compared to females. Aging is another factor to consider when titrating the CFU of bacteria utilized. Aging mice displayed 100% mortality when we used the specified Spn dose (not shown here). Young mice are most frequently used in the pneumococcal PNA models (ranging from 6 to 14 weeks), while aged mice (19-26 months old) display an altered immune response and are used to investigate the role of aging in PNA11 . We had to decrease the CFU down to 300% to achieve survival in aging animals (not shown here). Male C57BL/6 mice (8-12 weeks old) were used in this study and were followed during 6 to 10 days post-infection. Significant differences in susceptibility can also be found between strains; inbred strains such BALB/C and C57BL6/J have different responses to infection11,19.
Direct inoculation of bacteria intratracheally allows a more precise delivery of the inoculum (up to 99%) into the lungs12, representing an alternative for less virulent serotypes and decreasing the aerosolization of bacteria11. However, it can be argued that it is an invasive procedure. Intubation can be challenging, requires systemic anesthesia, and can lead to tracheal trauma with subsequent airway edema and stridor. Mice can develop a vasovagal reflex that leads to apnea, for which it is required to have a small mouse ventilator to provide additional ventilator support when needed. The expertise of the surgeon performing the procedure is a critical component to guarantee successful intubation11. In our study, no mice needed to be euthanized due to the appropriate pain management and no greater than 20% loss of body weight. No signs of pain and distress such as lethargy, an inability to reach water or food, labored breathing, or decreased mental alertness were seen. Alternative methods of direct bacterial delivery to the lungs is oropharyngeal aspiration, although the resolution of lung injury appears to occur faster, and some bacteria can end in the stomach and gastrointestinal tract20.
Preclinical models of PNA enable investigators to evaluate the immune landscape. Bronchoalveolar and interstitial compartments can be assessed for dynamic changes in immune cells16. Moreover, cells can be cultured and stimulated ex vivo to determine their specific production of cytokines and chemokines. Here, we focus on exploring the immune cell landscape in the lung and BAL by using multicolor flow cytometry. Single cell RNA sequencing can also be performed to understand the cell specific transcriptomic signatures at different stages of injury resolution.
PNA-ARDS models generate systemic effects that can be detected early by measuring the body weight during the course of the disease10. Although we do not directly measure systemic effects of ARDS, organ dysfunction can also be assessed by blood measurement of chemistry profiles, and by harvesting different tissues such as spleen, kidney, and liver for histology. Systemic effects of pneumococcal PNA-ARDS have been previously described by other groups using the same bacteria strain21.
Here, a model of experimental PNA that resembles some of the key pathophysiological findings underlying human ARDS is described. Although there are no ideal models that completely recapitulate the complexity and heterogeneity of human ARDS9, these models are relevant and reproducible for studying the mechanisms of lung injury and repair, also serving as a platform for the identification of new potential pharmacological targets that focus on accelerating resolution of lung inflammation and promoting lung repair.
Disclosures
The authors have nothing to disclose.
Acknowledgements
This study was supported by NIH grant R01 HL131812 and R01HL163881.
Materials
| Name | Company | Catalog Number | Comments |
|---|---|---|---|
| 1-200 µL Round 0.5 mm Thick Gel-Loading Pipet Tips | Corning | 4853 | |
| 2 mL Cryogenic vials | Corning Incorporated | 431420 | 2 mL self standing, round bottom, red cap, polypropylene |
| 2 mL Eppendorf Snap-Cap Microcentrifuge Biopur Safe-Lock Tubes | Fisherscientific | 05-402-24C | Shape: Round, Length (Metric): 38mm, Diameter (Metric) Outer: 10mm, Capacity (Metric): 2mL |
| 70 µm Cell Strainer | Falcon | 352350 | White, Sterile, Individually Packaged |
| 96-well Clear Round Bottom | Falcon | 353077 | TC-treated Cell Culture Microplate, with Lid, Individually Wrapped, Sterile |
| Acepromizine Maleate Injection, USP 500 mg/50 mL (10mg/mL) | Phoenix | NDC 57319-604-04 | EACH mL CONTAINS: acepromazine maleate 10 mg, sodium citrate 0.36%, Citric acid 0.075%, benzyl alcohol 1% and water for injection. |
| Ammonium-Chloride-Potassium (ACK) Lysing Buffer | Quality Biological | 118-156-721 | 4 x 100mL |
| Anti-mouse I-A/I-E | Biolegend | 107628 | APC/Cyanine7 anti-mouse I-A/I-E [M5/114.15.2]; Isotype: Rat IgG2b |
| BCA Protein Assay Kit | Thermo Scientific | 23225 | |
| BD Trypticase Soy Agar | BD-Biosciences | 90001-276 | 5% Sheep Blood Prepared Media Stacker Plates, BD Diagnostics |
| Biotix Disposable Reagent Reservoirs | Biotix | 89511-194 | |
| Bovine Serum Albumin | Sigma-Aldrih | A4503 | |
| CD103 | Invitrogen | 509723 | Integrin alpha E) Armenian Hamster anti-Mouse, FITC, Clone: 2E7 |
| CD11b | Invitrogen | RM2817 | PE-Texas Red, Clone: M1/70.15, Invitrogen |
| CD11c | BD Biosciences | 565872 | Hamster anti-Mouse, APC-R700, Clone: N418, BD Horizon |
| CD19 | Biolegend | 152410 | APC anti-mouse CD19 [1D3/CD19]; Isotype: Rat IgG2a, κ |
| CD24 | BD Biosciences | 563450 | Rat anti-Mouse, Brilliant Violet 711, Clone: M1/69 |
| CD4 | BD Biosciences | 563790 | BUV395; Clone: GK1.5 |
| CD45 | Biolegend | 103157 | Brilliant Violet 750 anti-mouse CD45 [30-F11]; Isotype: Rat IgG2b, κ; |
| CD8a | BD Biosciences | 612759 | Rat anti-Murine, Brilliant Ultraviolet 737, Clone: 53-6.7 |
| Cell Counting Slides | Bio-rad | 1450017 | For TC20 Cell Counter |
| Cell strainer 70 µL Nylon | Falcon | 198718 | REF 352350 |
| Collagenase Type1 | Worthington Biochemical Corporation | LS004197 | |
| Culti-Loop Streptococcus pneumoniae | Thermo Scientific | R4609015 | ATCC 4961 |
| Deoxyribonuclease I from bovine pancreas | Sigma-Aldrih | DN25 | |
| Disposable inoculation loops/needles | Fisherbrand | 22-363-603 | Color blue; Volume 1 µL |
| DMEM (Dulbecco’s Modified Eagle’s Medium) | Corning | 10-014-CV | |
| Fc Block | BD Biosciences | 553142 | CD16/CD32 Rat anti-Mouse, Unlabeled, Clone: 2.4G2 |
| Formalin solution | Sigma-Aldrih | HT501640 | Formalin solution, neutral buffered, 10% |
| Gauze Sponges, Covidien | Curity | 2146- | |
| gentleMACS C Tubes | MACS Miltenyi Biotec | 130-093-237 | |
| gentleMACS Dissociator | MACS Miltenyi Biotec | 130-093-235 | SN: 4715 |
| Hema 3 Manual Staining System and Stat Pack | Thermo Scientific | 23123869 | |
| Isoflurane Liquid Inhalation | Henry Schein | 1182097 | |
| IV CATHETER JELCO 20GX1.25" | Hanna Pharmaceutical Supply Co., Inc | 405611 | |
| Ketamine HCl Injection | Henry Schein | 1049007 | Ketamine HCl Injection MDV 100mg/mL 10mL 10/Box |
| Klebsiella pneumoniae | ATCC | 43816 | subsp. pneumoniae (Schroeter) Trevisan |
| Loctite 409 | Electron Microscopy Sciences | 7257009 | |
| Ly-6C | Biolegend | 128036 | Brilliant Violet 605 anti-mouse Ly-6C [HK1.4]; Isotype: Rat IgG2c |
| Ly-6G | BD Biosciences | 740157 | Rat anti-Mouse, Brilliant Violet 510, Clone: 1A8, BD Optibuild |
| MiniVent Type 845 | Hugo Sachs Elektronik- Harvard Apparatus | 4694 | D-79232 March (Germany) |
| NK-1.1 | BD Biosciences | 553165 | Mouse anti-Mouse, PE, Clone: PK136, BD |
| Phase Hemacytometer | Hausser Scientific | 1475 | |
| Phosphate-Buffered Saline | Corning | 21-040-CV | 1X without calcium and magnesium, |
| Round Bottom | Sarstedt | 55.476.305 | |
| Round-Bottom Polystyrene Test Tubes | Falcon | 352235 | With Cell Strainer Snap Cap, 5mL |
| SealRite 1.5 mL Natural Microcentrifuge Tube | USA Scientific | 1615-5500 | Free of detectable Rnase, DNase, DNA and pyrogens. |
| Shandon EZ Single Cytofunnel | Epredia | A78710003 | |
| Siglec-F | BD Biosciences | 562681 | Anti-Mouse, Brilliant Violet 421, Clone: E50-2440 |
| Silk Black Braided 30"(75 cm) Sterile, nonabsorbable surgical suture U.S.P. | Ethicon | K-834 | 0 (3.5 metric) |
| Stainless-Steel Slide Clip | Epredia | 59910052 | |
| Sterile Single Use Vacuum Filter Units | Thermo Scientific | 1660045 | |
| Syringe sterile, single use, 1 mL | BD-Biosciences | 309628 | |
| TC20 Automatic Cell Counter | Bio-Rad | 508BR05740 | |
| TipOne 200 ul yellow pipet tip refill | USA Scientific | 1111-0706 | |
| TODD HEWITT BROTH | RPI | T47500 | |
| TPX Sample Chamber | Epredia | A78710018 | |
| TPX Single Sample Chamber, Caps and Filter Cards | Epredia | 5991022 | |
| Trypan Blue | Bio-rad | 1450022 | |
| U-100 Insulin Syringes | BD-Biosciences | 329461 | |
| Wet-Proof Multi-Heat Electric Heat Pad | Cullus | Model PR7791AB | 120 volst AC; 45 watts; Listed 562B/E26869 |
References
- Bellani, G., et al. Epidemiology, patterns of care, and mortality for patients with acute respiratory distress syndrome in intensive care units in 50 countries. JAMA. 315 (8), 788-800 (2016).
- Hariri, L., Hardin, C. C. Covid-19, angiogenesis, and ARDS endotypes. The New England Journal of Medicine. 383 (2), 182-183 (2020).
- Ferguson, N. D., et al. The Berlin definition of ARDS: an expanded rationale, justification, and supplementary material. Intensive Care Medicine. 38 (10), 1573-1582 (2012).
- Tomashefski Jr, J. F. Pulmonary pathology of the adult respiratory distress syndrome. Clinics in Chest Medicine. 11 (4), 593-619 (1990).
- Martin, T. R. Lung cytokines and ARDS: Roger S. Mitchell lecture. Chest. 116 (1 Suppl), 2S-8S (1999).
- Colletti, L. M., et al. Role of tumor necrosis factor-alpha in the pathophysiologic alterations after hepatic ischemia/reperfusion injury in the rat. The Journal of Clinical Investigation. 85 (6), 1936-1943 (1990).
- Donnelly, S. C., et al. The association between mortality rates and decreased concentrations of interleukin-10 and interleukin-1 receptor antagonist in the lung fluids of patients with the adult respiratory distress syndrome. Annals of Internal Medicine. 125 (3), 191-196 (1996).
- Miller, E. J., Cohen, A. B., Matthay, M. A. Increased interleukin-8 concentrations in the pulmonary edema fluid of patients with acute respiratory distress syndrome from sepsis. Critical Care Medicine. 24 (9), 1448-1454 (1996).
- Matute-Bello, G., et al. An official American Thoracic Society workshop report: features and measurements of experimental acute lung injury in animals. American Journal of Respiratory Cell and Molecular Biology. 44 (5), 725-738 (2011).
- Kulkarni, H. S., et al. Update on the features and measurements of experimental acute lung injury in animals: an official American Thoracic Society Workshop report. American Journal of Respiratory Cell and Molecular Biology. 66 (2), e1-e14 (2022).
- Borsa, N., Pasquale, M. D., Restrepo, M. I. Animal models of pneumococcal pneumonia. International Journal of Molecular Sciences. 20 (17), 4220(2019).
- Rubins, J. B., et al. Dual function of pneumolysin in the early pathogenesis of murine pneumococcal pneumonia. The Journal of Clinical Investigation. 95 (1), 142-150 (1995).
- Thermo Scientific, Pierce BCA Protein Assay Kit. , https://www.thermofisher.com/order/catalog/product/23225 Forthcoming.
- Jungblut, M., Oeltze, K., Zehnter, I., Hasselmann, D., Bosio, A. Standardized preparation of single-cell suspensions from mouse lung tissue using the gentleMACS Dissociator. Journal of Visualized Experiments. (29), e1266(2009).
- Tighe, R. M., et al. Improving the quality and reproducibility of flow cytometry in the lung. an official American Thoracic Society Workshop report. American Journal of Respiratory Cell and Molecular Biology. 61 (2), 150-161 (2019).
- Aeffner, F., Bolon, B., Davis, I. C. Mouse models of acute respiratory distress syndrome: a review of analytical approaches, pathologic features, and common measurements. Toxicologic Pathology. 43 (8), 1074-1092 (2015).
- Torres, A., et al. Pneumonia. Nature Reviews Disease Primers. 7 (1), 25(2021).
- Xiong, Y., et al. Estradiol resolves pneumonia via ERβ in regulatory T cells. JCI Insight. 6 (3), e133251(2021).
- D'Alessio, F. R., et al. Enhanced resolution of experimental ARDS through IL-4-mediated lung macrophage reprogramming. American Journal of Physiology. Lung Cellular and Molecular Physiology. 310 (8), L733-L746 (2016).
- D'Alessio, F. R. Mouse models of acute lung injury and ARDS. Methods in Molecular Biology. 1809, 341-350 (2018).
- Gotts, J. E., et al. Clinically relevant model of pneumococcal pneumonia, ARDS, and nonpulmonary organ dysfunction in mice. American Journal of Physiology. Lung Cellular and Molecular Physiology. 317 (5), L717-L736 (2019).
Reprints and Permissions
Erratum
Formal Correction: Erratum: Experimental Model to Evaluate Resolution of Pneumonia
Posted by JoVE Editors on 6/13/2023. Citeable Link.
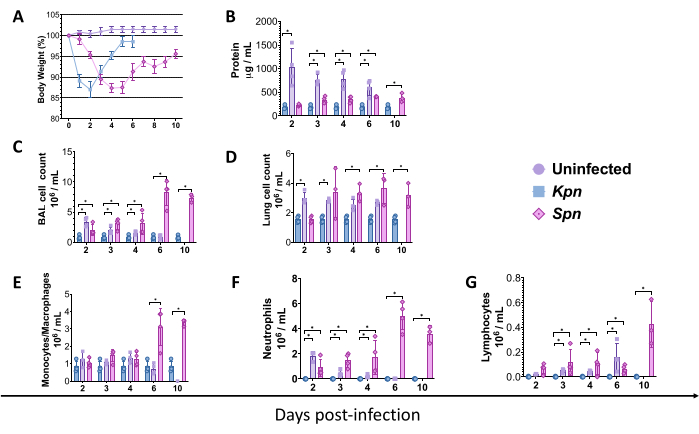
An erratum was issued for: Experimental Model to Evaluate Resolution of Pneumonia. A figure was updated.
Figure 2 was updated from:
to:
