Post-transcriptional modifications of RNA represent an understudied layer of translation regulation that has recently been linked to central nervous system plasticity. Here, sample preparation and liquid chromatography-tandem mass spectrometry approach is described for simultaneous characterization of numerous RNA modifications in single neurons.
Method Article
Characterizing RNA Modifications in Single Neurons Using Mass Spectrometry
In This Article
Summary
Abstract
Post-transcriptional modifications (PTMs) of RNA represent an understudied mechanism involved in the regulation of translation in the central nervous system (CNS). Recent evidence has linked specific neuronal RNA modifications to learning and memory paradigms. Unfortunately, conventional methods for the detection of these epitranscriptomic features are only capable of characterizing highly abundant RNA modifications in bulk tissues, precluding the assessment of unique PTM profiles that may exist for individual neurons within the activated behavioral circuits. In this protocol, an approach is described—single-neuron RNA modification analysis by mass spectrometry (SNRMA-MS)—to simultaneously detect and quantify numerous modified ribonucleosides in single neurons. The approach is validated using individual neurons of the marine mollusk, Aplysia californica, beginning with surgical isolation and enzymatic treatment of major CNS ganglia to expose neuron cell bodies, followed by manual single-neuron isolation using sharp needles and a micropipette. Next, mechanical and thermal treatment of the sample in a small volume of buffer is done to liberate RNA from an individual cell for subsequent RNA digestion. Modified nucleosides are then identified and quantified using an optimized liquid chromatography-mass spectrometry method. SNRMA-MS is employed to establish RNA modification patterns for single, identified neurons from A. californica that have known morphologies and functions. Examples of qualitative and quantitative SNRMA-MS are presented that highlight the heterogeneous distribution of RNA modifications across individual neurons in neuronal networks.
Introduction
Modifications in the canonical nucleosides of RNA have been increasingly recognized for their myriad roles in the regulation of protein translation. Over 150 unique RNA modifications have been reported to date that range in complexity from methylation, heteroatom addition, to conjugation with cellular metabolites1,2. This expanded RNA alphabet, also known as the epitranscriptome, is generated by enzymatic writers and is responsible for altering the stability3, folding4, and translation efficiency5,6 of cellular RNAs. Select RNA modifications may also be reversed via enzymatic erasers7,8, whereas others are appended to RNAs substoichiometrically9,10, rendering a complex landscape of modified and unmodified RNA sequences in biological systems.
The importance of RNA modifications in biological function is indicated by the unequal distribution of modifications across different organs and tissues, including subregions of the central nervous system (CNS)11. This chemical heterogeneity has been linked to CNS development12, stress response13, and activity-dependent plasticity14. The CNS subregions further comprise heterogeneous populations of cells in which individual cells exhibit distinct chemical profiles15,16,17,18. Even single cells of the same type may display unique transcriptomes, in part due to tissue microenvironments19 and stochastic gene expression20. However, while characterization of the single-cell transcriptome is somewhat routine, there are no analogous methods for establishing single-cell epitranscriptomes for multiple RNA modifications. New approaches that are capable of profiling the distribution of RNA modifications in individual cells are needed for comprehensive analysis of the cellular heterogeneity and regulatory influence of post-transcriptional modifications (PTMs) in the CNS and other biological systems.
Simultaneous measurement of numerous RNA modifications in bulk cells/tissues is readily accomplished using liquid chromatography-tandem mass spectrometry (LC-MS/MS) techniques. For LC-MS/MS analysis of modified ribonucleosides, RNA is extracted from cells (typically 103-106 cells), purified by precipitation and resuspension, and subsequently digested into nucleosides. The sample mixture consisting of canonical and modified nucleosides is then injected into the LC-MS system for analyte separation and detection, leading to determination of the full complement of RNA modifications in an organism21,22,23. LC-MS/MS was recently used to determine 26 RNA modifications in the CNS of the neurobiological model, Aplysia californica (A. californica). The abundances of some of these epitranscriptomic marks exhibited time- and region-dependent dynamics that correlated with behavioral changes in the animal24. However, it was only possible to detect RNA modifications in bulk samples containing >103 cells due to the limited sensitivity of the method. These larger samples likely concealed unique and functionally important RNA modification profiles of individual cells with population averages. Although careful control of sample preparation conditions has improved the detection limits for RNA modifications in small-volume samples25,26,27,28, there remains a need for analytical methods that can detect and quantify multiple modified ribonucleosides in single cells.
This protocol introduces single-neuron RNA modification analysis by mass spectrometry (SNRMA-MS), which permits the detection of over a dozen RNA modifications in single neurons from the CNS of A. californica29. The approach consists of surgical isolation of single, identified cells from major CNS ganglia followed by an optimized sample preparation workflow involving mechanical cell lysis, RNA denaturation, and enzymatic hydrolysis in an MS-compatible buffer. Identification and quantification of post-transcriptionally modified nucleosides is then accomplished using LC-MS/MS. SNRMA-MS fulfills an unmet need in the field of RNA modification analysis by facilitating the acquisition of post-transcriptional RNA modification profiles for single neurons and has potential for future application to other cell types.
Protocol
1. Preparation of materials and solutions
- Prepare artificial seawater (ASW) with 460 mM NaCl, 10 mM KCl, 10 mM CaCl2, 22 mM MgCl2, 26 mM MgSO4, and 10 mM HEPES in water obtained from a stringent purification system. Adjust pH to 7.8 using 1 M NaOH or HCl. Typically, prepare 1 L of ASW and store at 14 °C until use.
- Prepare an ASW-antibiotics solution with 10,000 U/mL of penicillin G, 10 µg/µL of streptomycin, and 10 µg/µL of gentamicin and store at -20 °C. Immediately before the experiment, thaw and dilute the frozen antibiotics stock solution 1:100 in 20-40 mL of ASW. The final concentration of antibiotics in the working ASW solution is 100 U/mL of penicillin G, 100 µg/mL of streptomycin, and 100 µg/mL of gentamicin.
- Prepare an RNA digestion buffer by combining 1 µL of 10 µg/µL bovine serum albumin, 0.5 µL of 0.5 µg/µL pentostatin, 0.495 µL of 2 U/µL alkaline phosphatase, 1 µL of 0.1 U phosphodiesterase I (in 10 mM MgCl2), and 0.38 µL of endonuclease from Serratia marcescens (25 U) per sample. If analyzing multiple samples, prepare a master mix in a separate tube containing the volume of each reagent multiplied by the number of samples to be analyzed, plus one more to account for incidental reagent loss from pipet transfer steps.
- Prepare several sharp needles (either glass or metal) for manual isolation of neurons. Make metal needles in house by electrochemical etching of tungsten wire as in30 or purchase them. Prepare glass needles from thick or standard wall borosilicate glass capillaries (1 mm outer diameter) using a micropipette puller. For the present method, keep the needle tip diameter between 1-5 µm, with a neck length of 100-150 µm.
NOTE: Fabrication of both metal and glass needles can be optimized to produce tools that suit the individual needs of the researcher and the specific biological model being investigated.
2. Isolation of single neuron
- Cool a 0.33 M MgCl2 solution to 14 °C. Using a 50 mL syringe, anesthetize A. californica (150-250 g) by injecting the MgCl2 solution into the body cavity of the animal. Best results are obtained with 1:3 ratio of solution volume (mL) to animal body mass (g). Wait approximately 3 min for the animal to become relaxed, ensuring it does not display body contractions in response to tactile stimulation.
- Place the animal ventral side (foot side) up in a dissecting tray. Dissect the animal using surgical scissors with one blunt tip positioned toward the animal, carefully making a longitudinal cut through the foot.
- Pin the rostral, caudal, and lateral sides of the animal body to expose the internal organs and CNS ganglia located in the body cavity. Isolate major CNS ganglia from the animal by surgically severing nerves and some connectives originating from the ganglia.
- Immerse the ganglia in a solution of protease type XIV from Streptomyces griseus (10 mg/mL in ASW-antibiotics solution) and incubate at 34 °C for 30 min or 1 h (for cerebral ganglion).
NOTE: The duration of incubation depends on the season, animal size and condition, as well as targeted neurons. Isolation of some neurons requires longer incubation than others and should be determined experimentally. - Rinse the ganglia 6x with ASW-antibiotics solution and transfer all ganglia into in a silicone polymer-coated dish filled with ASW-antibiotics solution using a polypropylene transfer pipet that has been cut to an opening of ~5 mm. Treat the pipet with 1 mg/mL of bovine serum albumin in ASW to minimize sticking of the ganglia to the pipet (optional). Keep ganglia submerged in ASW at all times.
NOTE: Enzymatic treatment reduces the mechanical stability of neurons and surrounding connective tissue and, as a result, neuronal membranes can be damaged due to exposure to air during ganglia transfer. - Pin down the ganglia and use micro scissors and fine forceps to remove ganglion sheaths. With sufficiently strong enzymatic treatment, use glass or metal needles for desheathing.
- Visually identify A. californica neurons of interest. In this work, the following cells were studied: R2 in the abdominal ganglion, LPl1 in the pleural ganglion, metacerebral cells (MCCs) in the cerebral ganglion, and B2 cells in the buccal ganglion. Take optical images of all neural and ganglionic preparations using a calibrated microscope at 20x total magnification to determine the sizes and volumes of each cell type.
- Using a pulled glass capillary or sharp tungsten needles, carefully isolate the identified cell from the bulk ganglion.
- Draw a small amount (1 µL) of ASW into a plastic micropipette, and then transfer the isolated cell into a PCR sample tube containing 4 µL of 0.365 M ammonium acetate (pH 9.2). For blank measurements, collect 5 µL aliquots of the ASW-antibiotics solution from the dish containing the ganglion and mix with digestion buffer (described below).
3. Cell lysis and RNA digestion for SNRMA-MS
- Lyse the isolated neurons by repeated aspiration and dispensing with a micropipette (~100 µm inner diameter) in 0.365 M ammonium acetate. Some smaller cells may not immediately rupture; to lyse them, apply pressure across the diameter of the cell with a pulled glass capillary.
- Use a thermal cycler to heat the samples with the following temperature program: 95 °C for 3 min, 10 °C for 3 min, hold at 10 °C. Remove the sample tube from the thermal cycler.
- Add 3.375 µL of RNA digestion buffer for each sample and mix the solution using a micropipette by withdrawing and dispensing the solution several times. Use a miniature benchtop centrifuge at 2700 x g for 30 s to spin down any liquid droplets clinging to the walls of the PCR tube.
- Incubate the samples in the thermal cycler at 37 °C for 3 h, followed by a hold at 10 °C (heated lid set to ON). Immediately after the sample has cooled to 10 °C, transfer 7 µL of the solution into an autosampler vial equipped with a 250 µL insert, taking care to avoid bubble formation in the autosampler tube.
4. Liquid chromatography-tandem mass spectrometry
NOTE: Analyze the single-neuron digests and authentic modified nucleoside standards using an LC-MS/MS system equipped with an electrospray ionization source and six-port diverter valve.
- To prepare the LC system for separation of canonical and modified nucleosides, equilibrate a C18 column (150 mm x 2.1 mm, 2.2 µm particle size, 120 Å pore diameter) with 99% mobile phase A (5 mM ammonium acetate, pH 5.6) and 1% mobile phase B (60/40 mobile phase A/acetonitrile (ACN)) at a flow rate of 0.2 mL/min for 12 min at 36 °C. Use LC-MS grade solvents for preparation of mobile phases.
- While the LC equilibrates, calibrate the mass spectrometer by introducing a 1 mM solution of sodium acetate in 50/50 ACN/water to the mass spectrometer via syringe pump with a flow rate of 5 µL/min. After calibration, reconnect the LC flow to the mass spectrometer.
- Program the following linear gradient parameters: 1% B for 0-5 min, 5% B at 9 min, 7% B at 11 min, 10% B at 13 min, 15% B at 32 min, 40% B at 38 min, 50% B at 43 min, 100% B at 50 min, 100% B at 60 min, 1% B at 61 min, and a 12 min re-equilibration at 1% B before the next injection.
- Operate the MS instrument in positive mode with the following parameters: capillary voltage set to 4,500 V, drying temperature 275 °C, N2 drying gas 5 L/min, and nebulizing gas 1 bar. Set the diverter valve to waste for the first 2 min of analysis and to source for the remainder of the run.
- Collect mass spectra over a m/z range of 110-600. Select ions for collision-induced dissociation at 35-40 eV over a 3 s cycle time using a preferred mass list constructed using the database2 and an isolation window of ± 0.5. Use active exclusion to exclude ions from fragmentation after three spectra.
- Set dynamic MS/MS spectra acquisition for ions with intensities above and below 50,000 counts at 4 Hz and 1 Hz, respectively, and a minimum threshold for ion selection at 1,990 counts.
- For quantitative SNRMA-MS, construct calibration curves using extracted ion chromatogram (EIC) peak areas obtained for modified nucleoside standards at a minimum of five concentrations to allow interpolation of unknown endogenous analyte concentrations.
NOTE: Neurons obtained from animals with body masses of 150-250 g typically requires calibration curves for modified nucleosides ranging from 0.02 pmol to 2 pmol, but these values may vary depending on the sensitivity of the instrument.
5. Data analysis
- Generate EICs for modified nucleosides (m/z from database values2). Verify the identities of putative modified nucleosides by comparing their MS2 spectra and LC retention characteristics to database values2. See Table 1 for a list of typical RNA modifications detected in single neurons from A. californica.
- Manually integrate peaks that correspond to modified and canonical nucleosides and record these values in a spreadsheet. Normalize the peak area for each modified nucleoside with the sum of the peak areas for canonical cytidine, uridine, and guanosine detected in the sample.
NOTE: Adenosine is not included in the normalization because of its role in the CNS as a dynamic neuromodulator31. - Construct a data matrix consisting of each single-neuron sample and the corresponding normalized peak areas for modified nucleosides that exhibited signal-to-noise ratios >10. Perform principal component analysis (PCA) and display the first two principal components in the score plot. Construct linear calibration curves from the EIC peak areas obtained from the serial dilution of nucleoside standards and calculate the concentrations of detected analytes.
Results
SNRMA-MS involves the manual isolation of identified neurons into small sample volumes for lysis, digestion, and LC-MS/MS analysis (Figure 1A). This workflow routinely detected over a dozen RNA modifications in single neurons from the CNS of A. californica (Figure 1B), representing a coverage of nearly half of the known epitranscriptome of this animal24 in a single cell. For example, subjecting the LPl1 neuron (~500 µm diameter) to SNRMA-MS resulted in the detection of 15 ± 1 RNA modifications (n = 3). Modified nucleosides were positively identified on the basis of three attributes: LC retention properties, exact mass, and MS2 fragmentation profiles compared to values provided in the database2. Table 1 shows a list of all the RNA modifications detected in the LPl1 neuron. The high-resolution quadrupole time-of-flight mass spectrometer used for these experiments enabled a mass accuracy of 4 ppm as well as detection of the characteristic MS2 fragment ion at m/z 164 for the modified nucleoside N6,6-dimethyladenosine (m66A, Figure 1B). Combined with the LC separation data, which agrees with findings deposited in the database (m66A elutes after N6-methyladenosine (m6A)), the SNRMA-MS approach demonstrated correct assignment of modified nucleoside identities.
The SNRMA-MS platform can be leveraged for establishing RNA modification profiles of single neurons and investigating their relationship to bulk tissues. R2 neurons are large (~500 µm in diameter) cholinergic cells that reside in the abdominal ganglion. SNRMA-MS was used to analyze RNA modifications in R2 neurons as well as the surrounding bulk abdominal ganglion (Figure 2A). Normalized peak areas for RNA modifications in each neuron/ganglion sample (n = 7) were used as inputs for PCA, revealing that R2 neurons exhibit distinct RNA modification profiles compared to the ganglia in which they reside (Figure 2B). This is evidenced by data points for R2 neurons and abdominal ganglia occupying different regions of the PCA score plot. Further support for unique modified nucleoside patterns was obtained from a separate cohort of animals (n = 7) in which pairwise comparisons were performed for 13 RNA modifications that were commonly detected in both the single neurons and bulk tissue (Figure 2C). Two modified nucleosides, pseudouridine (Ψ) and 2'-O-methylguanosine (Gm), were at significantly higher abundance in the abdominal ganglia compared to R2 neurons. When viewing a subset of the RNA modifications with R2 neuron-ganglion pairs indicated, all of the abdominal ganglia exhibited higher levels of Ψ and Gm, and all but one of the R2 neurons had higher abundances of 2'-O-methyladenosine (Am) than their corresponding ganglion (Figure 2D). Overall, the SNRMA-MS results reveal for the first time that RNA modification profiles of single cells can diverge from bulk cells in the same tissue.
Using SNRMA-MS to investigate the model animal A. californica provides a unique opportunity to characterize RNA modification profiles in identified, functionally distinct neurons. RNA modifications were evaluated by SNRMA-MS in four identified cells: R2 and LPl1 (homologous, cholinergic cells involved in defensive mucous release)32, MCCs (serotonergic modulatory neurons involved in feeding)33, and B2 cells (peptidergic neurons involved in gut motility)34. PCA of six RNA modifications in these identified neurons, either isolated immediately after enzymatic treatment or cultured in a ganglion preparation for 48 h, demonstrated the stability and dynamics of single cell epitranscriptomes. RNA modifications in functionally different cells formed unique clusters in the score plot while homologous R2/LPl1 neurons co-clustered (Figure 3A). The loading plot shows that differences were primarily driven by the abundance of positional isomers of methyladenosine, including 2'-O-methyladenosine (Am) and N1-methyladenosine (m1A) (Figure 3B). In the same analysis, a comparison of freshly isolated cells and cells cultured in situ (i.e., in their respective ganglia) for 48 h was performed. As shown in the PCA score plot, functionally different cells remained distinguishable by their RNA modification profiles.
Quantitative SNRMA-MS can be used for determining absolute amounts of select RNA modifications for which authentic standards are available. External calibration curves were generated for m1A, Ψ, 2'-O-methylcytidine (Cm), Am, and m6A, and the amount of each modified nucleoside in the MCC and R2/LPl1 cell pairs was determined by interpolation (Figure 4A-E). The intracellular quantities of m1A and Ψ in two pairs of symmetrical MCCs appeared to be similar, while larger differences in the amounts of these modifications were observed in three pairs of R2/LPl1 cells. In order to account for differences due to the physical size of the cells studied, RNA modification quantities were normalized by cell volumes calculated from optical measurement of cell diameters to yield intracellular concentrations of modified nucleosides. Significant differences in intracellular concentrations of Cm and Am were observed between MCCs and R2/LPl1 neurons. Overall, SNRMA-MS enables both qualitative and quantitative profiling of RNA modifications in single neurons.
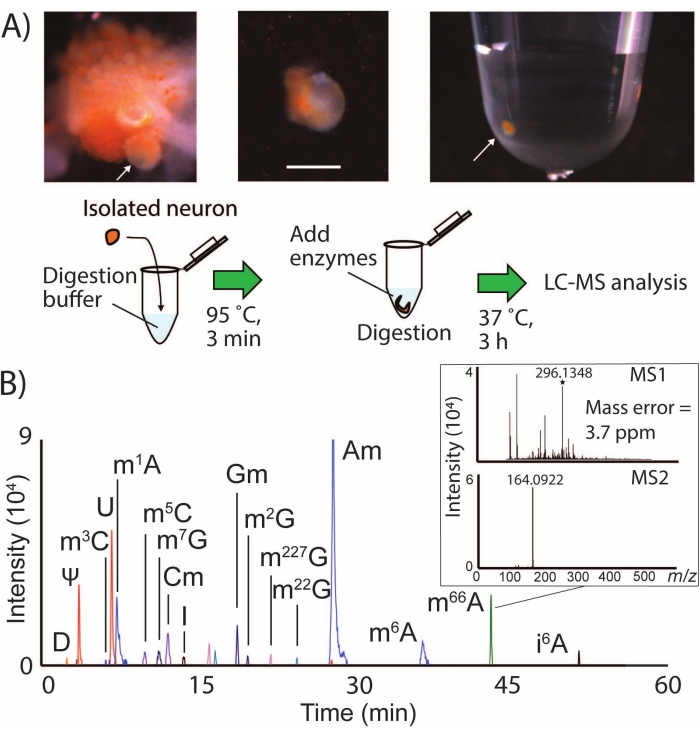
Figure 1: SNRMA-MS workflow and detection of multiple RNA modifications in single neurons by LC-MS/MS. (A) Photographs of desheathed buccal ganglion and single neuron isolation into a sample tube. Scale bar = 200 µm, arrows indicate identified B1 cell. A diagram of the sample preparation procedure for LC-MS/MS analysis is also shown. (B) Overlaid EICs for RNA modifications in a single LPl1 neuron, with inset showing MS1 and MS2 spectra for N6, N6-dimethyladenosine (m66A). See Table 1 for m/z values used to generate EICs for modified nucleosides. This figure has been modified from29. Please click here to view a larger version of this figure.
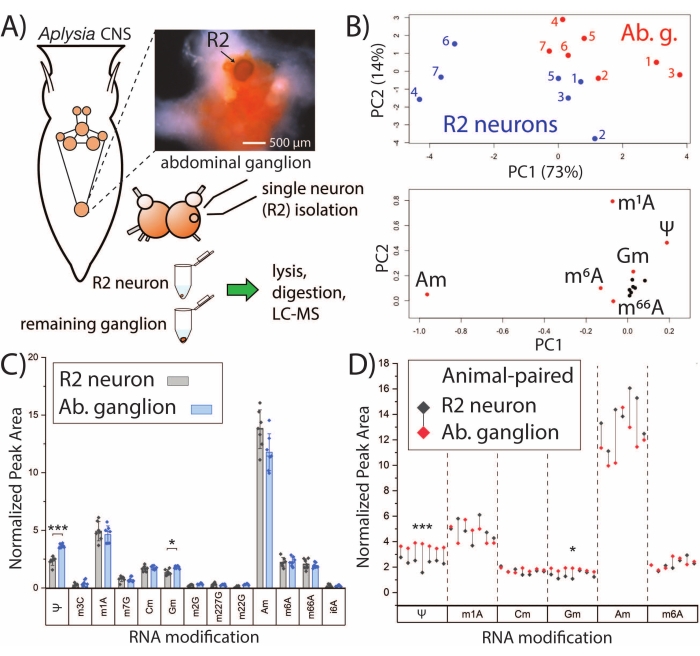
Figure 2: SNRMA-MS distinguishes RNA modification profiles of single neurons and bulk tissue. (A) Schematic of A. californica CNS and workflow for analyzing R2 neurons and the surrounding abdominal ganglion. The photograph shows the abdominal ganglion and R2 neuron (injected with Fast Green dye for visibility). (B) Relative peak areas from 13 RNA modifications were used to generate the PCA score (top) and loading (bottom) plots. (C) Pairwise comparison of RNA modifications in the abdominal ganglion and R2 neuron. Error bars represent ±1 standard deviation (SD), *p < 0.05, ***p < 5 x 10⁻⁴, paired t-test with Bonferroni−Holm correction. (D) Comparison of select RNA modifications from panel C in which R2-abdominal ganglion pairs for each animal are shown with droplines. This figure has been modified from29. Please click here to view a larger version of this figure.

Figure 3: Profiling RNA modifications in identified, functionally different neurons from the A. californica CNS. (A) PCA score plot for MCCs, and B2, R2, and LPl1 cells that were either freshly isolated or isolated following in situ culture for 48 h (denoted by cMCC, cB2, cR2, cLPl1), and (B) loading plots for six RNA modifications commonly detected in these cells. This figure has been modified from29. Please click here to view a larger version of this figure.
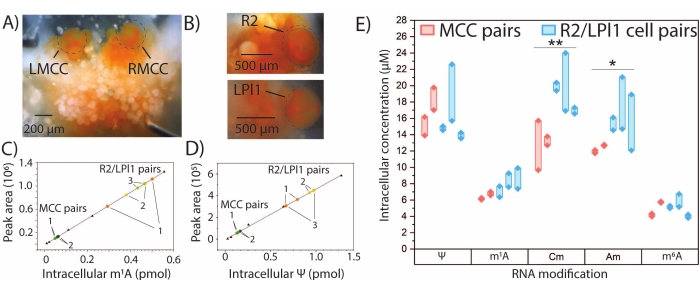
Figure 4: Quantitative SNRMA-MS in A. californica neurons. Quantitative SNRMA-MS provides absolute amounts and intracellular concentrations for several modified nucleosides in single, identified A. californica neurons. Photographs of (A) left and right MCCs (LMCC and RMCC, respectively) in the cerebral ganglion and (B) R2 in the abdominal ganglion and LPl1 in the pleural ganglion. Cells are circled to enhance visibility. Linear calibration plots for (C) m1A and (D) Ψ (triangles) used for interpolation of modified nucleoside quantities in single cells (colored dots). Cell pairs from each animal are labeled 1-3. (E) Intracellular concentrations of five modified nucleosides in MCC and R2/LPl1 cell pairs. Thick lines connect cell pairs. *p < 0.05, **p < 0.005, paired t-test with Bonferroni−Holm correction, n = 2 animals (four cells total) for MCCs and n = 3 animals (six cells total) for R2/LPl1. This figure has been modified from29. Please click here to view a larger version of this figure.
| RNA modification | Abbreviation | Elution order (C18) | m/z for EIC | m/z for MS2 |
| dihydrouridine | D | 1 | 247.09 | 115 |
| pseudouridine | Y | 2 | 245.08 | 209/179/155 |
| 3-methylcytidine | m3C | 3 | 258.11 | 126 |
| N1-methyladenosine | m1A | 4 | 282.12 | 150 |
| 5-methylcytidine | m5C | 5 | 258.11 | 126 |
| N7-methylguanosine | m7G | 6 | 298.12 | 166 |
| 2'-O-methylcytidine | Cm | 7 | 258.11 | 112 |
| inosine | I6A | 8 | 269.09 | 137 |
| 2'-O-methylguanosine | Gm | 9 | 298.12 | 152 |
| N2-methylguanosine | m2G | 10 | 298.12 | 166 |
| N2,N2,N7-trimethylguanosine | m227G | 11 | 326.15 | 194 |
| N2,N2,-dimethylguanosine | m22G | 12 | 312.13 | 180 |
| 2'-O-methyladenosine | Am | 13 | 282.12 | 136 |
| N6-methyladenosine | m6A | 14 | 282.12 | 150 |
| N6,N6-dimethyladenosine | m66A | 15 | 296.14 | 164 |
| N6-isopentenyladenosine | i6A | 16 | 336.17 | 204/136/148 |
Table 1: RNA modifications detected in single neurons from A. californica. Attributes for characterization of modified nucleosides are provided including LC retention order, m/z for generating EICs, and corresponding CID fragments.
Discussion
SNRMA-MS leverages an optimized sample preparation approach, resulting in a small, MS-compatible sample volume that can be delivered to the LC-MS platform. The initial enzymatic pre-treatment of CNS ganglia dictates both the ease with which they can be desheathed and the durability of single neurons during isolation. The cerebral ganglion often requires extended enzymatic treatment due to its relatively thick sheath compared to the buccal, pleural, and abdominal ganglia. Individual researchers performing the single neuron isolations may have differing preferences for how durable the sheath should be when using microscissors and fine forceps. However, it is important that the ganglia are not over-digested, as this may lead to a loss in their structural integrity, loss of positional information that is critical for identifying target cells, and/or cell lysis. Following isolation from the ganglion, it is important to ensure that a minimal volume of isolation medium is aspirated when transferring the neuron to the sample tube. The ASW medium contains a high concentration of salts that may interfere with digestive enzymes during RNA hydrolysis and will also dilute the sample.
During the mechanical lysis step, it is common for large neurons (>250 µm diameter) to rupture upon repeatedly passing through a micropipette. Smaller neurons may require additional attention to ensure cell lysis, which typically involves pressing a glass capillary on the cell. In this instance, it is possible that a partial volume of the sample buffer will be drawn into the capillary because of capillary forces. This volume can be delivered back into the sample tube by applying pressure to the end of the glass capillary to ensure that no sample is lost.
The best results are obtained by including a heating step prior to adding enzymes for RNA digestion. This is likely because heating at 95 °C denatures RNA secondary structures that may impede the activity of RNases35 and diminish the quantity of nucleosides released from RNA biopolymers. Control experiments using samples spiked with stable isotope-labeled methionine were previously performed to investigate whether heat-induced RNA modification artifacts were the cause of the increased peak areas observed for RNA modifications relative to a no-heat SNRMA-MS protocol29. No such labeling was observed, indicating that the improved signals for RNA modifications using the optimized SNRMA-MS method were due to superior digestion of RNA.
Conventional methods for isolating total RNA from cells involve liquid-liquid extraction (LLE) with phenol-chloroform and subsequent RNA precipitation, washing, and resuspension. These approaches have proven useful for reverse transcription polymerase chain reaction experiments where the expression of select genes can be readily monitored in identified A. californica neurons36,37. However, LLE methods cannot recover sufficient RNA for the detection of modified ribonucleosides by LC-MS, whereas the SNRMA-MS method described herein enables detection of numerous RNA modifications29. In order to assess modification profiles of specific RNA types (e.g., rRNA, tRNA, mRNA) in bulk tissue/cell samples, anion-exchange solid phase extraction24, hybridization probe-based enrichment38, and chromatographic fractionation39 approaches have been applied, but similar methods are not yet available for single-cell RNA purification. The development of RNA fractionation approaches that are capable of isolating specific RNA types from single cells would provide additional insight toward the function of RNA modifications.
SNRMA-MS revealed previously uncharacterized heterogeneity in the RNA modification landscape of single neurons in A. californica and it is conceivable that similarly distinct PTM profiles exist across mammalian cells. Because mammalian cells are relatively small compared to the large A. californica neurons analyzed in this protocol, improvements in the handling of small sample volumes are needed to facilitate lower detection limits. Though currently SNRMA-MS is limited to volumes of ~5 µL, it is expected that substantial improvements can be attained by incorporating microfluidic liquid handling devices into the workflow. Furthermore, the implementation of automated or semi-automated cell isolations would increase sample throughput and permit single-cell RNA modification analysis of larger cell populations. By interfacing with nanoflow LC separations27, the characterization of epitranscriptomic marks in even smaller cells will be achievable.
Disclosures
The authors declare no competing financial interests.
Acknowledgements
This work was funded by the National Institute on Drug Abuse under Award no. P30DA018310 and the National Human Genome Research Institute under Award no. RM1HG010023. K.D.C. acknowledges support from a Beckman Institute Postdoctoral Fellowship. The content is solely the responsibility of the authors and does not necessarily represent the official views of the funding agencies.
Materials
| Name | Company | Catalog Number | Comments |
|---|---|---|---|
| Animals | |||
| Aplysia californica | National Resource for Aplysia (Miami, FL) | 150–250 g (adult) | |
| Benchtop equipment | |||
| Glass capillary puller | Sutter | P-97 | |
| Milli-Q water purification system | Millipore | ||
| Minicentrifuge for PCR tubes | LW Scientific | ZS-1 | |
| Optical Microscope | Zeiss | Stemi 2000C | |
| Thermocycler | Techne | EW-93945-01 | |
| HPLC column and consumables | |||
| Acclaim RSLC 120 C18 column | Thermo Scientific | 71399 | |
| Autosampler vials | Thermo Scientific | C4011-13 | |
| LC and MS Instrumentation and Software | |||
| DataAnalysis 4.4 software | Bruker | ||
| Dionex Ultimate 3000 nanoLC | Thermo Scientific | Equipped with online degasser, autosampler, and thermostatted column compartment | |
| Impact HD UHR QqTOF mass spectrometer | Bruker | Equipped with ESI source | |
| RStudio | RStudio | ||
| Microdissection tools | |||
| Microscissors extra fine vannas 3.5” | Roboz | RS-5640 | |
| Tungsten needles | Roboz | RS-6065 | |
| Reagents/Materials | |||
| 4-(2-hydroxyethyl)-1-piperazineethane-sulfonic acid (HEPES) | Fisher Scientific | H3375 | |
| Alkaline phosphatase | Worthington Biochemical Corp. | LS004081 | |
| Ammonium acetate | Honeywell | 17836 | |
| Benzonase (endonuclease from S. marcescens) | EMD Millipore | 70746-4 | |
| Bovine serum albumin | Sigma-Aldrich | A2153 | |
| Calcium chloride | Sigma-Aldrich | C4901 | |
| Gentamycin sulfate | Fisher Scientific | G1264 | |
| Magnesium chloride | Sigma-Aldrich | M9272 | |
| Magnesium sulfate | Sigma-Aldrich | 208094 | |
| Nucleosides test mix | Sigma-Aldrich | 47310-U | |
| Penicillin G | Sigma-Aldrich | P7794 | |
| Pentostatin | Sigma-Aldrich | SML0508 | |
| Phosphodiesterase I | Worthington Biochemical Corp. | LS003926 | |
| Protease type XIV from Streptomyces griseus | Sigma-Aldrich | P5147 | |
| Sodium chloride | Sigma-Aldrich | S9888 | |
| Standard glass capillaries | A-M Systems | 626000 | 1 mm o.d., 0.5 mm i.d., 4 in |
| Streptomycin sulfate | Sigma-Aldrich | S9137 |
References
- Cantara, W. A., et al. The RNA modification database, RNAMDB: 2011 update. Nucleic Acids Research. 39, suppl_1 195-201 (2011).
- Boccaletto, P., et al. MODOMICS: a database of RNA modification pathways. 2017 update. Nucleic Acids Research. 46, 303-307 (2017).
- Kimura, S., Waldor, M. K. The RNA degradosome promotes tRNA quality control through clearance of hypomodified tRNA. Proceedings of the National Academy of Sciences of the United States of America. 116 (4), 1394-1403 (2019).
- Helm, M. Post-transcriptional nucleotide modification and alternative folding of RNA. Nucleic Acids Research. 34 (2), 721-733 (2006).
- Rezgui, V. A. N., et al. tRNA tKUUU, tQUUG, and tEUUC wobble position modifications fine-tune protein translation by promoting ribosome A-site binding. Proceedings of the National Academy of Sciences of the United States of America. 110 (30), 12289-12294 (2013).
- Shanmugam, R., et al. Cytosine methylation of tRNA-Asp by DNMT2 has a role in translation of proteins containing poly-Asp sequences. Cell Discovery. 1 (1), 1-10 (2015).
- Jia, G., et al. N 6-Methyladenosine in nuclear RNA is a major substrate of the obesity-associated FTO. Nature Chemical Biology. 7 (12), 885-887 (2011).
- Li, X., et al. Transcriptome-wide mapping reveals reversible and dynamic N 1 -methyladenosine methylome. Nature Chemical Biology. 12 (5), 311-316 (2016).
- Krogh, N., et al. Profiling of 2′-O-Me in human rRNA reveals a subset of fractionally modified positions and provides evidence for ribosome heterogeneity. Nucleic Acids Research. 44 (16), 7884-7895 (2016).
- Babaian, A., et al. Loss of m1acp3Ψ Ribosomal RNA Modification Is a Major Feature of Cancer. Cell Reports. 31 (5), 107611(2020).
- Chang, M., et al. Region-specific RNA m6A methylation represents a new layer of control in the gene regulatory network in the mouse brain. Open Biology. 7 (9), 170166(2017).
- Wang, C. -X., et al. METTL3-mediated m6A modification is required for cerebellar development. PLOS Biology. 16 (6), 2004880(2018).
- Engel, M., et al. The role of m6A/m-RNA methylation in stress response regulation. Neuron. 99 (2), 389-403 (2018).
- Widagdo, J., et al. Experience-dependent accumulation of N6-Methyladenosine in the prefrontal cortex is associated with memory processes in mice. Journal of Neuroscience. 36 (25), 6771-6777 (2016).
- Eberwine, J., et al. Analysis of gene expression in single live neurons. Proceedings of the National Academy of Sciences of the United States of America. 89 (7), 3010-3014 (1992).
- Cong, Y., et al. Ultrasensitive single-cell proteomics workflow identifies >1000 protein groups per mammalian cell. Chemical Science. 12 (3), 1001-1006 (2021).
- Rubakhin, S. S., Romanova, E. V., Nemes, P., Sweedler, J. V. Profiling metabolites and peptides in single cells. Nature Methods. 8 (4), 20-29 (2011).
- Nemes, P., Knolhoff, A. M., Rubakhin, S. S., Sweedler, J. V. Metabolic differentiation of neuronal phenotypes by single-cell capillary electrophoresis-electrospray ionization-mass spectrometry. Analytical Chemistry. 83 (17), 6810-6817 (2011).
- Lovatt, D., et al. Transcriptome in vivo analysis (TIVA) of spatially defined single cells in live tissue. Nature Methods. 11 (2), 190-196 (2014).
- Kærn, M., Elston, T. C., Blake, W. J., Collins, J. J. Stochasticity in gene expression: from theories to phenotypes. Nature Reviews Genetics. 6 (6), 451-464 (2005).
- Chan, C. T. Y., et al. A quantitative systems approach reveals dynamic control of tRNA modifications during cellular stress. PLOS Genetics. 6 (12), 1001247(2010).
- Sun, C., Jora, M., Solivio, B., Limbach, P. A., Addepalli, B. The effects of ultraviolet radiation on nucleoside modifications in RNA. ACS Chemical Biology. 13 (3), 567-572 (2018).
- Heiss, M., Hagelskamp, F., Marchand, V., Motorin, Y., Kellner, S. Cell culture NAIL-MS allows insight into human tRNA and rRNA modification dynamics in vivo. Nature Communications. 12 (1), 389(2021).
- Clark, K. D., Lee, C., Gillette, R., Sweedler, J. V. Characterization of neuronal RNA modifications during non-associative learning in aplysia reveals key roles for tRNAs in behavioral sensitization. ACS Central Science. 7 (7), 1183-1190 (2021).
- Basanta-Sanchez, M., Temple, S., Ansari, S. A., D'Amico, A., Agris, P. F. Attomole quantification and global profile of RNA modifications: Epitranscriptome of human neural stem cells. Nucleic Acids Research. 44 (3), 26(2016).
- Huang, W., et al. Determination of DNA and RNA methylation in circulating tumor cells by mass spectrometry. Analytical Chemistry. 88 (2), 1378-1384 (2016).
- Sarin, L. P., et al. Nano LC-MS using capillary columns enables accurate quantification of modified ribonucleosides at low femtomol levels. RNA. 24 (10), 1403-1417 (2018).
- Clark, K. D., Philip, M. C., Tan, Y., Sweedler, J. V. Biphasic liquid microjunction extraction for profiling neuronal RNA modifications by liquid chromatography-tandem mass spectrometry. Analytical Chemistry. 92 (18), 12647-12655 (2020).
- Clark, K. D., Rubakhin, S. S., Sweedler, J. V. Single-neuron RNA modification analysis by mass spectrometry: Characterizing RNA modification patterns and dynamics with single-cell resolution. Analytical Chemistry. 93 (43), 14537-14544 (2021).
- Guise, O. L., Ahner, J. W., Jung, M. -C., Goughnour, P. C., Yates, J. T. Reproducible electrochemical etching of tungsten probe tips. Nano Letters. 2 (3), 191-193 (2002).
- Peng, W., Wu, Z., Song, K., Zhang, S., Li, Y., Xu, M. Regulation of sleep homeostasis mediator adenosine by basal forebrain glutamatergic neurons. Science. 369 (6508), (2020).
- Rayport, S. G., Ambron, R. T., Babiarz, J. Identified cholinergic neurons R2 and LPl1 control mucus release in Aplysia. Journal of Neurophysiology. 49 (4), 864-876 (1983).
- Rosen, S. C., Weiss, K. R., Goldstein, R. S., Kupfermann, I. The role of a modulatory neuron in feeding and satiation in Aplysia: effects of lesioning of the serotonergic metacerebral cells. Journal of Neuroscience. 9 (5), 1562-1578 (1989).
- Lloyd, P. E., Kupfermann, I., Weiss, K. R. Central peptidergic neurons regulate gut motility in Aplysia. Journal of Neurophysiology. 59 (5), 1613-1626 (1988).
- Crain, P. F. Preparation and enzymatic hydrolysis of DNA and RNA for mass spectrometry. Methods in Enzymology. 193, 782-790 (1990).
- Kadakkuzha, B. M., et al. Age-associated bidirectional modulation of gene expression in single identified R15 neuron of Aplysia. BMC Genomics. 14 (1), 880(2013).
- Akhmedov, K., Kadakkuzha, B. M., Puthanveettil, S. V. Aplysia ganglia preparation for electrophysiological and molecular analyses of single neurons. Journal of Visualized Experiments: JoVE. (83), e51075(2014).
- Tardu, M., Jones, J. D., Kennedy, R. T., Lin, Q., Koutmou, K. S. Identification and quantification of modified nucleosides in saccharomyces cerevisiae mRNAs. ACS Chemical Biology. 14 (7), 1403-1409 (2019).
- Heiss, M., Reichle, V. F., Kellner, S. Observing the fate of tRNA and its modifications by nucleic acid isotope labeling mass spectrometry: NAIL-MS. RNA Biology. 14 (9), 1260-1268 (2017).
Reprints and Permissions
