This protocol describes long-term organotypic cultures of adult human cortex combined with ex vivo intracortical transplantation of induced pluripotent stem cell-derived cortical progenitors, which present a novel methodology to further test stem cell-based therapies for human neurodegenerative disorders.
Method Article
Organotypic Cultures of Adult Human Cortex as an Ex vivo Model for Human Stem Cell Transplantation and Validation
In This Article
Summary
Abstract
Neurodegenerative disorders are common and heterogeneous in terms of their symptoms and cellular affectation, making their study complicated due to the lack of proper animal models that fully mimic human diseases and the poor availability of post-mortem human brain tissue. Adult human nervous tissue culture offers the possibility to study different aspects of neurological disorders. Molecular, cellular, and biochemical mechanisms could be easily addressed in this system, as well as testing and validating drugs or different treatments, such as cell-based therapies. This method combines long-term organotypic cultures of the adult human cortex, obtained from epileptic patients undergoing resective surgery, and ex vivo intracortical transplantation of induced pluripotent stem cell-derived cortical progenitors. This method will allow the study of cell survival, neuronal differentiation, the formation of synaptic inputs and outputs, and the electrophysiological properties of human-derived cells after transplantation into intact adult human cortical tissue. This approach is an important step prior to the development of a 3D human disease modeling platform that will bring basic research closer to the clinical translation of stem cell-based therapies for patients with different neurological disorders and allow the development of new tools for reconstructing damaged neural circuits.
Introduction
Neurodegenerative disorders, such as Parkinson's disease, Alzheimer's disease, or ischemic stroke, are a group of diseases that share the common feature of neuronal malfunction or death. They are heterogeneous in terms of the brain area and neuronal population affected. Unfortunately, treatments for these diseases are scarce or of limited efficacy due to the lack of animal models that mimic what occurs in the human brain1,2. Stem cell therapy is one of the most promising strategies for brain regeneration3. The generation of neuronal progenitors from stem cells from different sources has been greatly developed in recent years4,5. Recent publications have shown that human induced pluripotent stem (iPS) cell-derived long-term self-renewing neuroepithelial-like stem (lt-NES) cells, following a cortical differentiation protocol and after intracortical transplantation in a rat model with ischemic stroke affecting the somatosensory cortex, generate mature cortical neurons. In addition, the graft-derived neurons received afferent and efferent synaptic connections from the host neurons, showing their integration into the rat neuronal network6,7. The graft-derived axons were myelinated and found in different areas of the rat brain, including the peri-infarct area, corpus callosum, and contralateral somatosensory cortex. Most importantly, iPS cell-derived transplantation reversed motor deficits in stroke animals7.
Even if animal models help to study transplant survival, neuronal integration, and the effect of the grafted cells on motor and cognitive functions, information about interaction between human cells (graft-host) is missing in this system8,9. For this reason, a combined method of long-term human brain organotypic culture with the ex vivo transplantation of human iPS cell-derived neuronal progenitors is described here. Human brain organotypic cultures obtained from neurosurgical resections are physiologically relevant 3D models of the brain that allow researchers to increase their understanding of the human central nervous system circuitry and the most accurate way of testing treatments for human brain disorders. However, not enough research has been done in this context, and in most cases, human hippocampal brain organotypic cultures have been used10,11. The cerebral cortex is affected by several neurodegenerative disorders, such as ischemic stroke12 or Alzheimer's disease13, so it is important to have a human cortical 3D system that allows us to expand our knowledge and to test and validate different therapeutic strategies. Several studies in the last few years have used cultures from adult human cortical (hACtx) tissue to model human brain diseases14,15,16,17,18,19; however, limited information is available in the context of stem cell therapy. Two studies have already demonstrated the feasibility of the system described here. In 2018, human embryonic stem cells programmed with different transcription factors and transplanted into hACtx tissue were shown to give rise to mature cortical neurons that could integrate into adult human cortical networks20. In 2020, the transplantation of lt-NES cells into the human organotypic system revealed their capacity to differentiate into mature, layer-specific cortical neurons with the electrophysiological properties of functional neurons. The grafted neurons established both afferent and efferent synaptic contacts with the human cortical neurons in the adult brain slices, as corroborated by rabies virus retrograde monosynaptic tracing, whole-cell patch-clamp recordings, and immuno-electron microscopy21.
Protocol
This protocol follows the guidelines approved by the Regional Ethical Committee, Lund, Sweden (ethical permit number 2021-07006-01). Healthy neocortical tissue was obtained from patients undergoing elective surgery for temporal lobe epilepsy. Informed consent was obtained from all patients.
NOTE: All the tissues obtained were processed regardless of their size. However, tissues smaller than 1-1.5 mm3 in size will be technically challenging to handle and section with a vibratome.
1. Tissue collection, maintenance, cutting, and plating
- Preparations on the day before tissue slicing
- Prepare 2 L of cutting solution (Table 1) in a volumetric flask. Dissolve all the ingredients except MgCl2 and CaCl2 in ~1,800 mL of deionized water and bubble with carbogen gas for 15 min. Then add appropriate amounts of 1 M MgCl2 and CaCl2 solutions and continue bubbling for another 15 min. Finally, fill the flask to the 2 L mark; check the pH and osmolarity and adjust if needed. Freeze 2 x 350 mL of the prepared solution and store the rest at 4 °C.
NOTE: The pH and osmolarity are typically 7.3-7.4 and 295-300 mOsm, respectively. - Prepare 100 mL of rinsing solution (Table 2). Dissolve 476 mg of HEPES and 200.6 mg of glucose in 100 mL of HBSS supplemented with 5 mL of penicillin/streptomycin. This can be stored at 4 °C for up to 10 days.
- Prepare human adult cortical (hACtx) culture medium (hACtx medium) (Table 3) and filter it in the cell culture lab under a ventilated hood. The medium comprises neuronal medium without phenol red (see the Table of Materials), B27 supplement, L-glutamine (see the Table of Materials), and gentamicin. Store at 4 °C for up to 2 weeks.
- Prepare 2 L of cutting solution (Table 1) in a volumetric flask. Dissolve all the ingredients except MgCl2 and CaCl2 in ~1,800 mL of deionized water and bubble with carbogen gas for 15 min. Then add appropriate amounts of 1 M MgCl2 and CaCl2 solutions and continue bubbling for another 15 min. Finally, fill the flask to the 2 L mark; check the pH and osmolarity and adjust if needed. Freeze 2 x 350 mL of the prepared solution and store the rest at 4 °C.
- Preparations on the day of the operation before the arrival of the tissue samples
- Check the availability of the needed equipment and lab space, and thoroughly clean all the surgical tools and the vibratome (see the Table of Materials), as well as the benchtop space, with distilled water (without detergent), followed by 70% ethanol. Let the ethanol dry for at least 30 min before using the tools and equipment.
- Crush the frozen cutting solution and bubble the "soup'' of ice and liquid with carbogen gas for 30 min. Then, tightly close one of the containers with the crushed solution ''soup'' and place it in the icebox. This will be used to collect the tissue from the operation room.
- Calibrate the vibratome and set the cutting parameters: 0.05 mm/s speed and 1.7 mm vibration. Place the cutting chamber on a vibratome stage and start the cooler connected to it so that the chamber is at a constant temperature of −3 °C.
- Prepare the slice collection chamber with inserts to place the tissue slices and cutting solution, bubbling it constantly with carbogen gas at room temperature (RT).
- In the cell culture lab and under a ventilated hood, place the culture inserts in a 6-well plate using forceps. Add 5 mL of hACtx medium on the bottom of the insert until it contacts the membrane, avoiding the formation of bubbles, and add 2 mL on the top of the insert. Equilibrate in the incubator at 37 °C and 5% CO2 for at least 2 h before transferring the tissue slices into the inserts.
- Tissue collection and slicing procedures
- Immediately after resection, collect the tissue from the patient in the operation room, if possible, directly into a container with frozen, bubbled, and crushed cutting solution. Transfer the closed container on ice immediately to the cutting area of the lab.
- Inspect the tissue and locate the best surface to glue (see step 1.3.3) it to the cutting stage of the vibratome, considering the orientation of the cortical layers. If needed, cut the uneven surface with a scalpel so that it is easy to place the tissue on the stage for optimal slice orientation.
- Glue the tissue to the stage with tissue adhesive (see the Table of Materials), place it in the slicing chamber, and immediately fill the chamber with cold bubbled cutting solution. Continue the bubbling during the whole cutting procedure.
- Cut coronal or sagittal slices, depending on the tissue-to-blade orientation, at a thickness of 300 µm to contain all the cortical layers and, if possible, the white matter. Place the slices in the collection chamber with bubbling cutting solution at RT.
NOTE: Cut from the white matter side toward the surface of the cortex. Do not remove the meninges, as this may damage the tissue. The cutting blade usually slices through them easily. - Once all the tissue has been cut, transfer the slices into a sterile Petri dish with rinsing solution at RT and transport them to the cell culture lab. This step is necessary to remove excess sucrose from the slices before transferring them to the culture plate.
NOTE: To transfer the slices (in this and the following steps), use an inverted glass pipette, break off the thinner part, and place a rubber teat for suction.
- Culture and maintenance of hACtx tissue slices
- Individually place the tissue slices on top of the already wet and submerged inserts. After 24 h, change the medium to further remove any remaining sucrose or other residual substances from the cutting procedures.
- Replace the culture medium with fresh medium every 7 days. After 2 weeks, use hACtx medium without gentamicin. The culture can be maintained for up to 2 months.
NOTE: Equilibrate the hACtx medium in the incubator at 37 °C and 5% CO2 for at least 2 h before the medium change. Fresh medium should be prepared every 2 weeks. Check the slices every 2-3 days and, if some of the medium has evaporated, add more to the top of the insert.
| Cutting solution | Stock concentration | Final concentration [mM] | Per 1 L |
| Sucrose | Powder | 200 | 68.46 g |
| NaHCO3 | Powder | 21 | 1.76 g |
| KCl | Powder | 3 | 0.22 g |
| NaH2PO4 | Powder | 1.25 | 0.17 g |
| Glucose | Powder | 10 | 1.80 g |
| MgSO4 | 1 M | 2 | 2 mL |
| CaCl2 | 1 M | 1.6 | 1.6 mL |
| MgCl2 | 2 M | 2 | 1 mL |
Table 1: Composition of cutting solution. MgCl2 and CaCl2 are used as preprepared 1 M solutions in deionized water.
| Rinsing solution | Stock concentration | Final concentration | Per 100 mL |
| HBSS | 1x | 95 mL | |
| PenStrep | 10,000 U/mL | 500 U/mL | 5 mL |
| HEPES | Powder | 4.76 g/L | 476 mg |
| Glucose | Powder | 2 g/L | 200.6 mg |
Table 2: Composition of rinsing solution.
| hACtx medium | Stock concentration | Final concentration | Per 100 mL | |
| Neuronal medium without Phenol red | 97.4 mL | see Table of Materials | ||
| B27 | 50x | 1:50 | 2 mL | |
| L-Glutamine | 100x | 1:200 | 500 µL | see Table of Materials |
| Gentamicin | 50 mg/mL | 1:1000 | 100 µL |
Table 3: Composition of hACtx medium.
2. Proliferation and differentiation of lt-NES cells
NOTE: Lt-NES cells are generated as previously described21,22 and transduced with a lentiviral vector carrying green fluorescent protein (GFP) under a constitutive promoter (GFP-lt-NES cells). Vials containing 3 x 10⁶ cells are stored at −150 °C until use.
- Preparation of the stock solutions and media
- Dilute 100 µg of basic fibroblast growth factor (bFGF) in 10 mL of PBS-0.1% BSA to have a stock concentration of 10 µg/mL. Prepare 100 µL aliquots.
- Dilute 100 µg of epidermal growth factor (EGF) in 10 mL of PBS-0.1% BSA to have a stock concentration of 10 µg/mL. Prepare 100 µL aliquots.
- Aliquot 50x B27 supplement in a volume of 100 µL per aliquot.
- Dilute 10 mg of poly-L-ornithine in 100 mL of deionized water to have a stock concentration of 100 µg/mL. Make 1 mL aliquots.
- Prepare 30 µL aliquots of 1.20 mg/mL mouse laminin.
- Dilute 10 mL of trypsin-EDTA (0.25%) in 90 mL of PBS to a stock concentration of 0.025%. Prepare 1 mL aliquots.
- Dilute 0.025 g of trypsin inhibitor in 50 mL of PBS to a stock concentration of 0.5 mg/mL. Prepare 1 mL aliquots.
- Dilute 10 µg of Wnt3a (Wingless-type MMTV integration site family member 3A) in 1 mL of PBS-0.1% BSA to have a stock concentration of 10 µg/mL. Prepare BMP4 (bone morphogenetic protein 4) in the same way. Aliquot in a volume of 100 µL.
- Dilute 1 mg of cyclopamine in 2.5 mL of DMSO to a final concentration of 400 µg/mL, and make 100 µL aliquots.
- Prepare basic medium (Table 4) and differentiation-defined medium (DDM, Table 5), and store at 4 °C for up to 2 weeks.
- Coating of culture dishes
- To pre-coat the dishes to culture the GFP-It-NES cells during proliferation or differentiation, dilute poly-L-ornithine 1:100 in deionized water and add 5 mL of the solution to a T25 flask. Incubate overnight at RT.
- Wash the poly-L-ornithine coated plates 1x with deionized water and 1x with PBS.
- For GFP-It-NES cells in proliferation, dilute mouse laminin at 1:500 in PBS and incubate for at least 2 h at 37 °C. For GFP-It-NES cells in differentiation, dilute mouse laminin at 1:100 in PBS and incubate for at least 2 h at 37 °C.
- Proliferation of the GFP-lt-NES cells
- Warm 5 mL (for washing) and 5 mL (for seeding) of basic medium in two different 15 mL tubes.
- Rapidly thaw one vial of GFP-lt-NES cells at 37 °C, transfer them to the washing tube, and centrifuge at 300 x g for 5 min.
- Aspirate the medium carefully without touching the pellet, and resuspend the cells in 1 mL of pre-warmed basic medium. Transfer the cell suspension to the seeding tube containing basic medium supplemented with proliferation factors: EGF (10 ng/mL), bFGF (10 ng/mL), and B27 (10 ng/mL). Seed the cells on a poly-L-ornithine/laminin-coated T25 flask.
- Feed the cells with proliferation factors every day. Replace the medium if it turns yellow. Passage the cells every third or fourth day (1 day after they reach 100% confluency).
- Splitting the GFP-lt-NES cells for proliferation and differentiation
- Pre-warm 5 mL of basic medium per flask (to collect the cells), plus the total volume needed to reseed them.
NOTE: The passage is done at a 1:3 dilution to keep the cells in proliferation, requiring 15 mL of basic medium, and a 1:6 dilution to start differentiation, requiring 30 mL of basic medium. - Remove the medium from the cell culture flask by aspiration, and add 500 µL of pre-warmed 0.025% trypsin. Incubate for 5-10 min at RT. The detachment of the cells can be confirmed under a standard light microscope at 10x magnification.
- Add an equal volume of trypsin inhibitor (0.5 mg/mL final concentration) followed by 5 mL of warm basic medium. Detach and collect the cells by gently pipetting up and down. Transfer the cells to a 15 mL tube and centrifuge for 5 min at 300 x g.
- To keep the cells in proliferation, replate at a 1:3 dilution in fresh basic medium supplemented with proliferation factors, and repeat step 2.3.4.
- Pre-warm 5 mL of basic medium per flask (to collect the cells), plus the total volume needed to reseed them.
- Cortical differentiation of the GFP-lt-NES cells
- On day 0, resuspend the cells (to be used for differentiation) in 30 mL of basic medium supplemented with proliferation factors, and plate them in six differentiation-coated T25 flasks (split 1:6).
- On day 1, change half of the medium to DDM, and add proliferation factors at half of their concentration.
- On day 2, change the medium completely to DDM supplemented with differentiation factors: BMP4 (10 ng/mL), Wnt3a (10 ng/mL), and cyclopamine (400 ng/mL).
- On day 4, add the differentiation factors alone. Replace the medium if it turns yellow.
- On day 6, change the medium to DDM supplemented with BMP4 and Wnt3a. The cyclopamine is removed at this step.
- On day 7, detach the cells as stated in step 2.4.2 and step 2.4.3.
| Basic Medium | Stock concentration | Final concentration | Per 100 mL |
| DMEM/F12 with L-Glutamine | 1x | 98.7 mL | |
| N-2 supplement | 100x | 1:100 | 1 mL |
| Glucose | 45% | 3.5 mL/L | 350 µL |
Table 4: Composition of proliferation medium of lt-NES cells (basic medium).
| DDM medium | Stock concentration | Final concentration | Per 100 mL |
| DMEM/F12 with L-Glutamine | 96 mL | ||
| N2 | 100 x | 1:100 | 1 mL |
| NEAA | 100 x | 1:100 | 1 mL |
| Sodium Pyruvate | 100 mM | 1:100 | 1 mL |
| BSA V Fraction | 7.5% | 6.6 mL/L | 660 µL |
| 2-mercaptoethanol | 50 nM | 7 µL/L | 0.7 µL |
| Glucose | 45% | 3.2 mL/L | 320 µL |
Table 5: Composition of differentiation-defined medium (DDM) of lt-NES cells.
3. Transplantation of the GFP-lt-NES cells into organotypic hACtx slices
NOTE: The hACtx tissue should be cultured for 1 week prior to cell transplantation. To facilitate the transplantation procedure, it is necessary to remove 2 mL of the hACtx medium from the top of the insert to prevent the tissue from floating.
- Resuspend the cortically primed GFP-lt-NES cells (from step 2.5.6) in cold pure basement membrane matrix (see the Table of Materials) at a concentration of 1 x 10⁵ cells/µL and transfer the solution to a smaller sterile tube.
NOTE: During the transplantation procedure, all the materials (pipette tips, tubes, capillary, etc.) should be pre-cooled to avoid gel solidification. Thaw the basement membrane matrix gel on ice for 30 min before its use. - Collect the cell suspension into a cold glass capillary connected to a rubber teat for suction. Inject the cell suspension as small drops (approx. 1 µL each) by stabbing the semi-dry tissue slice at various sites.
- Incubate at 37 °C for 30 min for the gel to solidify. Transfer the plate from the incubator back to the hood, and carefully add 2 mL of hACtx medium to the top of the insert to completely submerge the tissue.
- Replace the culture medium with fresh hACtx medium once per week.
4. Validation
- Staining of the hACtx slices
- At the desired time point, take out the slices from the cell culture lab, and remove them from the insert by immersing it in a Petri dish with PBS. Then, transfer the slices to staining vials using an inverted glass pipette (see the NOTE in step 1.3.5), and fix them with 4% paraformaldehyde (PFA) overnight at 4 °C.
- Rinse 3x with KPBS for 15 min each time, and incubate overnight at 4 °C with permeabilization solution (0.02% BSA and 1% Triton X-100 in KPBS).
- The next day, add blocking solution (KPBS with 0.2% Triton X-100, 1% BSA, sodium azide [1:10,000], and 10% normal donkey serum), and incubate overnight at 4 °C.
- After blocking, add the primary antibodies (see Table 6 for the dilutions) diluted in the blocking solution, and incubate for 48 h at 4 °C.
- Wash 3x with blocking solution without adding serum for 15 min each. Add the secondary antibodies diluted in blocking solution (see Table 6 for the dilutions), and incubate for 48 h at 4 °C.
- Wash 3x with blocking solution without serum, and incubate for 2 h at RT in Hoechst stain diluted in permeabilization solution (1:1,000).
- Wash 3x with KPBS, mount the slices on glass slides using a paintbrush, and let them dry. Finally, rinse the slides with deionized water, remove excess water, add the mounting medium, and cover with a glass coverslip. Keep the slides for at least 24 h at RT, and store them at 4 °C until imaging.
NOTE: For antibodies labeling nuclear epitopes, perform antigen retrieval prior to permeabilization (step 4.1.2) with sodium citrate (10 mM, pH 6.0) for 2 h at 65 °C.
- Whole-cell patch-clamp
- On the day of recording, prepare 1 L of human artificial cerebrospinal fluid (haCSF), modified to better match the human brain environment (Table 7). Similar to the cutting solution, make approximately 900 mL of the solution with all the ingredients except CaCl2 dissolved in deionized water, and bubble it with carbogen for 15 min before adding the appropriate volume of 1 M CaCl2 solution. Fill up the volumetric flask to the 1 L mark, and continue bubbling at RT for an additional 15 min before starting the recording and throughout the experiment.
- Transfer the tissue slices from the culture plate to the recording chamber on the stage of an upright microscope that is constantly perfused with bubbled haCSF at a perfusion rate of 2 mL/min and warmed to 34 °C using a bath temperature controller.
- Pull glass capillaries with a pipette puller to an average resistance of 3-5 MΩ, and backfill the capillaries with K-gluconate-based internal solution (Table 8) with a freshly added 2-4 mg of biocytin for the post-hoc identification of the recorded cells. The pH and osmolarity of this internal solution are 7.2-7.3 and 285-295 mOsm, respectively.
- In the case of host cell recording, get a rough overview of the slice with a 4x objective, and find a healthy-looking cell to patch with a 40x objective. Then, proceed with the standard whole-cell patch clamp.
- In the case of grafted cell recording, identify the tissue area with the grafted cells using a 4x objective and an epifluorescence filter in the blue range (460 nm) by GFP reporter expression in the graft. Then, zoom in to the located area with a 40x objective, and find a grafted cell expressing GFP for a standard whole-cell patch clamp.
- Check the resting membrane potential (RMP) immediately after breaking into the cell, and make sure that the quality of the recording is good. Record all the parameters of interest (e.g., membrane resistance [Ri], AP parameters, sodium and potassium currents, and synaptic activity) in the whole-cell voltage or current-clamp configuration.
- After collecting all the necessary data, carefully retract the recording pipette without further damaging the cell so that it can be identified with post-hoc immunostaining.
- Transfer the slice to the 4% PFA solution for further fixation and staining, as described in step 4.1. Streptavidin is used to immunolabel the cells filled with biocytin during the recordings.
| ANTIBODIES | Dilution | Notes |
| Primary | ||
| Chicken anti-GFP | 1:1000 | |
| Chicken anti-MAP2 | 1:1000 | |
| Goat anti-AiF1 | 1:100 | |
| Mouse anti-MBP | 1:1000 | Antigen retrieval needed |
| Mouse anti-SC123 | 1:2000 | |
| Rabbit anti-NeuN | 1:1000 | |
| Rabbit anti-Olig2 | 1:500 | |
| Rabbit anti-Tmem119 | 1:200 | |
| Secondary | ||
| 488-conjugated AffinityPure Donkey anti-mouse IgG | 1:500 | |
| 488-conjugated AffinityPure Donkey anti-rabbit IgG | 1:500 | |
| 488-conjugated AffinityPure Donkey anti-chicken IgG | 1:500 | |
| Cy3-conjugated AffinityPure Donkey anti-chicken IgG | 1:500 | |
| Cy3-conjugated AffinityPure Donkey anti-goat IgG | 1:500 | |
| Cy3-conjugated AffinityPure Donkey anti-mouse IgG | 1:500 | |
| Alexa fluor 647-conjugated Streptavidin | 1:500 |
Table 6: List of primary and secondary antibodies for immunohistochemistry.
| haCSF | Stock concentration | Final concentration [mM] | Per 1 L |
| NaCl | Powder | 129 | 7.54 g |
| NaHCO3 | Powder | 21 | 1.76 g |
| Glucose | Powder | 10 | 1.80 g |
| KCl | Powder | 3 | 0.22 g |
| NaH2PO4 | Powder | 1.25 | 0.17 g |
| MgSO4 | 1 M | 2 | 2 mL |
| CaCl2 | 1 M | 1.6 | 1.6 mL |
Table 7: Composition of artificial cerebrospinal fluid (haCSF).
| K-Gluconate internal solution | Stock concentration | Final concentration [mM] | Per 100 mL |
| K-gluconate | Powder | 122.5 | 2.87 g |
| KCl | Powder | 12.5 | 93.18 mg |
| NaCl | Powder | 8 | 46.76 mg |
| HEPES | Powder | 10 | 238.32 mg |
| MgATP | Powder | 2 | 101.4 mg |
| Na3GTP | Powder | 0.3 | 17.0 mg |
| Note: Adjust pH with KOH/HCl | |||
Table 8: Composition of K-gluconate-based internal solution.
Results
Following the described protocol, hACtx tissue from a patient with temporal lobe epilepsy was collected and processed, as explained above. A few slices were fixed after 24 h in culture to study the starting point of the host tissue. The analysis of different neural cell populations such as neurons (expressing NeuN and Map2, Figure 1A), oligodendrocytes (Olig2 and MBP, Figure 1B), and astrocytes (human-specific GFAP, also named STEM123, Figure 1C) showed optimal preservation of the tissue.
The next step was to study how the culture conditions affect the neuronal viability in human tissue. For this purpose, the staining of NeuN and Map2 was performed after 2 weeks of culture. At the studied timepoint, the expression of both these neuronal markers was still present in the tissue (Figure 2A). Additionally, electrophysiological recordings were performed to assess the functionality. The recordings using whole-cell patch clamp showed that the neurons had sustained RMP (−70 mV on average) and membrane input resistance (Ri) (300 MΩ on average), comparable to neurons from acute preparations21,23. Overall, the cells were slightly less active than in fresh tissue, although the majority of the cells were still able to fire at least one (Figure 2B-E), if not multiple, action potentials (APs, Figure 2F-I), and fast inward sodium and slow outward potassium currents were present upon step current injections in voltage-clamp mode (Figure 2C-E,G-I). Taken together, these recordings indicated that the neurons in organotypic cultures were relatively healthy and exhibited typical neurophysiological intrinsic properties.
Furthermore, the effect of culture on microglia activation was assessed by Tmem119 and Iba1 staining in 24 h (Figure 3A) and 2 week cultured (Figure 3B) tissue. As expected, some changes in microglial appearance were observed. After 2 weeks in culture, they became less ramified and acquired a more activated morphology compared to acute tissue.
After characterizing the host tissue, the transplantation of the lt-NES cell-derived progenitors was performed as follows. The GFP-lt-NES cells were differentiated for 7 days and grafted into 1 week cultured hACtx tissue (Figure 4A). An overview of the transplantation was observed using immunohistochemistry with GFP (Figure 4B,C). The results were compared with those of previous transplantations in tissue that was poorly preserved due to there being a longer time window between resection and plating. The images show that, in the optimal system, 4 weeks after ex vivo transplantation, the grafted GFP-lt-NES cells exhibited extended neurites and extensive and complex arborizations throughout the whole organotypic culture (Figure 4B). The poorly preserved tissue did not allow for successful transplantation due to the poor host connectivity. Barely any grafted cell survived; moreover, debris and unspecific labeling of antibodies on dead cells were broadly observed throughout the human slice (Figure 4C).
Regarding the electrophysiological properties of the grafted cells, it was found that, in the case of successful transplantation, the cells became not only morphologically but also functionally active mature neurons with repetitive and often spontaneous APs, fast inward sodium and slow outward potassium currents, and a certain level of synaptic activity, indicating functional integration of the graft with the host tissue 4 weeks post grafting (Figure 4D-H).
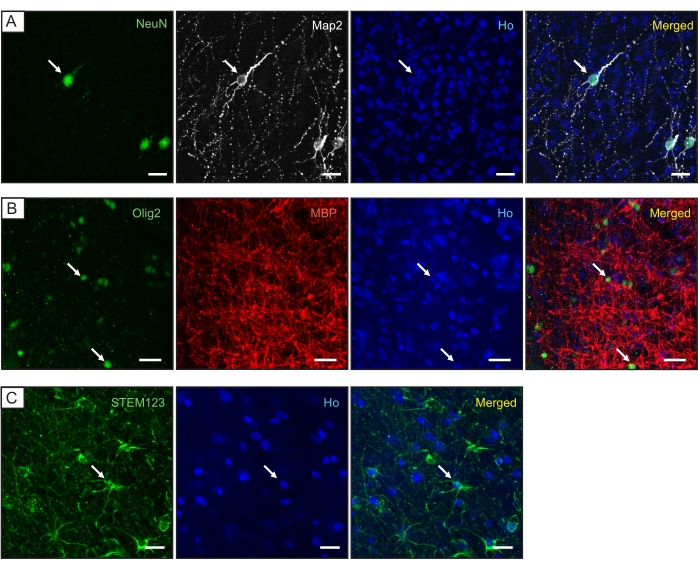
Figure 1: Characterization of the different cell populations in the hACtx tissue after 24 h in culture. Representative confocal images of hACtx tissue showing the presence of (A) neurons (expressing NeuN and Map2), (B) oligodendrocytes (Olig2 and MBP), and (C) astrocytes (human-specific GFAP [STEM123]). Nuclear staining (Ho: Hoechst, blue) is included in the individual and merged panels. Scale bar = 20 µm. The white arrows indicate colocalization. Please click here to view a larger version of this figure.
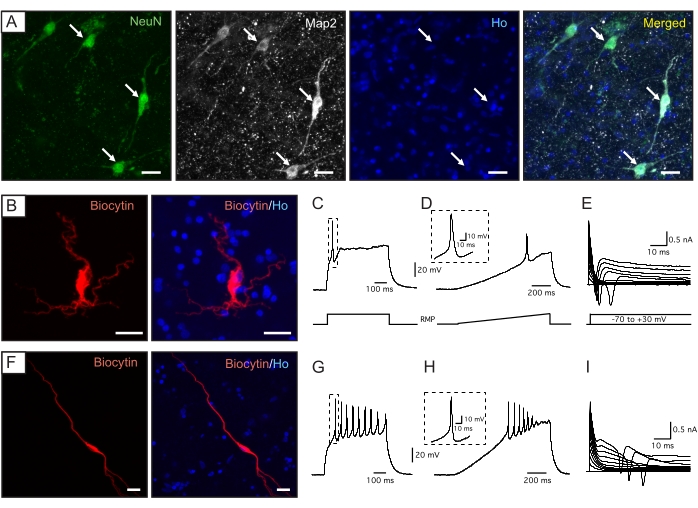
Figure 2: Characterization and electrophysiological properties of hACtx neurons after 2 weeks in organotypic culture. (A) Representative confocal images of hACtx tissue showing NeuN and Map2 expression. (B-I) Examples of the cortical neurons recorded in 2-week-old hACtx tissue. (B,F) Biocytin labeling of the recorded neuron (red), together with nuclear staining (Ho: Hoechst, blue), included in a merged panel. Scale bars = 20 µm. Whole-cell patch-clamp recording traces showing examples of a cell with (C-E) single, or (G-I) multiple APs. APs were induced either by (C,G) a 250 pA step, or (D,H) a 0 to 300 pA ramped current injection at RMP. The insets indicate a magnified view of one of the APs in each case. (E,I) Inward sodium and outward potassium currents were observed in both cell examples at the voltage depolarization steps applied from −70 mV in 10 mV increments in voltage-clamp mode. Please click here to view a larger version of this figure.
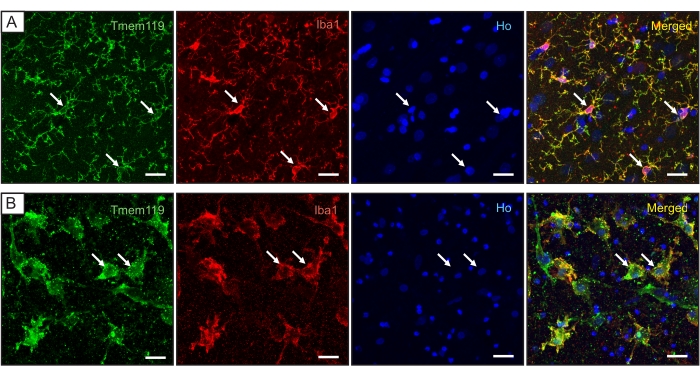
Figure 3: Characterization of the microglia population in the hACtx tissue. Confocal images of the hACtx tissue showing the expression of Iba1 and Tmem119 after (A) 24 h and (B) 2 weeks in culture. Nuclear staining (Ho: Hoechst, blue) is included in the individual and merged panels. Scale bar = 20 µm. The white arrows indicate colocalization. Please click here to view a larger version of this figure.
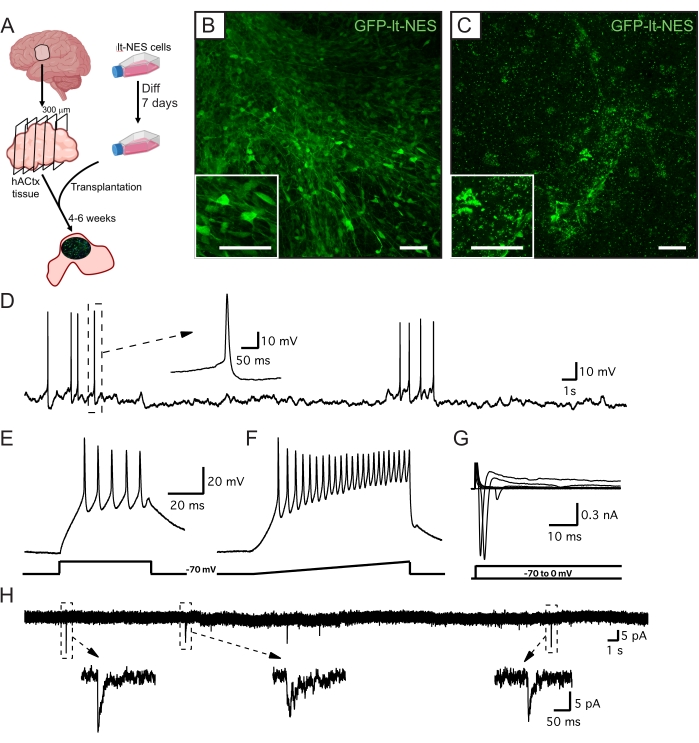
Figure 4: Overview and electrophysiological properties of lt-NES cell-derived neurons 4 weeks after the ex vivo transplantation of GFP-lt-NES cells. (A) Experimental design. Diff = differentiation. (B,C) Representative confocal pictures of grafted GFP-lt-NES cells in (B) well-preserved and (C) poorly preserved hACtx tissue. Scale bars = 50 µm. (D) Example trace of a graft-derived neuron spontaneously firing APs. The inset indicates a magnified view of one of the APs. Repetitive APs could be induced by a (E) step (50 pA) or (F) ramped (0 to 300 pA) injection of depolarizing current from the potential of −70 mV. (G) Inward sodium and outward potassium currents were induced by 10 mV depolarizing steps in voltage-clamp mode from a holding potential of -70 mV. (H) In voltage-clamp mode, spontaneous postsynaptic currents (sPSCs) could be observed in the graft-derived neurons at a holding potential of −70 mV. The insets indicate a magnified view of some of the sPSCs. Please click here to view a larger version of this figure.
Discussion
Obtaining hACtx slices of high enough quality is the most critical step in this protocol. Cortical tissue is obtained from epileptic patients undergoing resective surgery24. The quality of the resected tissue, as well as the exposure time of the tissue between resection and culture, is critical; the faster the tissue is transferred from the surgery room to the laboratory and cut, the more optimal the organotypic culture will be. Ideally, the tissue should be cut and transferred to the cell culture lab within the first few hours after collection. The oxygenation of the tissue during this process also improves the quality of the slices. In this regard, the bigger the tissue sample, the lower the concentration of oxygen reaching the core and, thus, the lower the viability if the tissue is not cut in time. If the quality of the host tissue is not optimal, the validation of stem cell therapies will not be possible.
When the cortical tissue is transferred from the human brain to a plate, some limitations must be taken into account. During the cutting process, a large number of axons are dissected, inducing neuronal damage that will lead to inflammatory processes such as microglia activation25. For this reason, even if the tissue is considered healthy when located in the human brain, the cell behavior in culture could be different due to the partial damage suffered during the resection and preparation of the organotypic sections26,27. Changes in the microglia population could be monitored using different techniques, including the measurement of the released cytokine levels or the assessment of morphological changes28. Importantly, although microglia activation was observed at 2 weeks in culture as a result of the change in environment from a whole organ to ex vivo culture conditions, the neurons were still viable at this timepoint, as shown by the neuronal staining and the analysis of their electrophysiological properties. Thicker tissue slices are better preserved; however, the penetration of nutrients to the inner part of the slice is affected, resulting in partial tissue death. For this reason, 300 µm is the optimal thickness for organotypic culture.
Organotypic cultures of hACtx tissue have clear advantages compared to other 3D culture methods such as organoids or spheroids. The source is a fully developed human brain, meaning that the cellular and matrix environment, as well as the maturation status of the different cell populations, are the same as those generally found in the adult human brain25,29,30. Organoids are more similar to fetal tissues, which is optimal for some research fields such as the modeling of developmental disorders31 but not, for example, for the study of neurodegenerative diseases, which affect mainly the adult population and have a late onset32,33. Most importantly, the organotypic culture of human tissue is, to date, the only human system that allows the validation of cell therapies.
Most of the knowledge about stem cell transplantation for neuronal replacement in neurodegenerative disorders is derived from in vivo animal modeling. Even though these systems are extremely valuable for assessing the modulatory effect of transplanted cells in the damaged host circuitry, unfortunately, therapies tested in this setup normally fail when translated to the clinic due to the clear differences between rodents and humans34. For this reason, the organotypic culture of hACtx tissue is an excellent strategy for modeling human neurodegenerative diseases that affect the cortex due to the possibility to study the interactions between human neural populations and the preservation of the human brain structure25.
In summary, this combined methodology of long-term organotypic cultures of the adult human cortex and ex vivo intracortical transplantation of induced pluripotent stem cell-derived cortical progenitors is a promising strategy for the validation of stem cell-based therapies, which can facilitate the clinical translation of neuronal replacement strategies for stimulating functional recovery in the damaged brain.
Disclosures
The authors declare no conflicts of interest.
Acknowledgements
This work is supported by grants from the Swedish Research Council, the Swedish Brain Foundation, the Swedish Stroke Foundation, Region Skåne, The Thorsten and Elsa Segerfalk Foundation, and the Swedish Government Initiative for Strategic Research Areas (StemTherapy).
Materials
| Name | Company | Catalog Number | Comments |
|---|---|---|---|
| Tissue Cutting and electrophysiology | |||
| Adenosine 5'-triphosphate magnesium salt | Sigma | A9187 | |
| Bath temperature controller | Luigs & Neumann | TC0511354 | |
| Calcium Chloride dihydrate | Merck | 102382 | |
| Carbogen gas | Air Liquide | NA | |
| Cooler | Julaba FL 300 | 9661012.03 | |
| D-(+)Glucose | Sigma-Aldrich | G7021 | |
| Double Patch-Clamp amplifier | HEKA electronic | EPC10 | |
| Guanosine 5'-Triphosphate disodium salt | Millipore | 371701 | |
| HEPES | AppliChem | A1069 | |
| Magnesium Chloride hexahydrate | Sigma-Aldrich | M2670 | |
| Magnesium Sulfate heptahydrate | Sigma-Aldrich | 230391 | |
| Patchmaster | HEKA electronic | Patchmaster 2x91 | |
| Pipette Puller | Sutter | P-2000 | |
| Plastic Petri dish | Any suitable | ||
| Potassium chloride | Merck | 104936 | |
| Potassium D-gluconate | ThermoFisher | B25135 | |
| Rubber teat + glass pipette | Any suitable | ||
| Sodium Bicarbonate | Sigma-Aldrich | S5761 | |
| Sodium Chloride | Sigma-Aldrich | S7653 | |
| Sodium dihydrogen phosphate monohydrate | Merck | 106346 | |
| Sucrose | Sigma-Aldrich | S7903 | |
| Tissue adhesive: Acryl super glue | Loctite | 2062278 | |
| Upright microscope | Olympus | BX51WI | |
| Vibratome | Leica | VT1200 S | |
| RINSING SOLUTION | |||
| D-(+)Glucose | Sigma-Aldrich | G7021 | |
| HBSS (without Ca, Mg, or PhenolRed) | ThermoFisher Scientific | 14175095 | |
| HEPES | AppliChem | A1069 | |
| Penicillin-Streptomycin (10,000 U/mL) | ThermoFisher Scientific | 15-140-122 | |
| MANTAINANCE AND CULTURE OF HUMAN NEOCORTICAL TISSUE | |||
| 6-well plate | ThermoFisher Scientific | 140675 | |
| Alvetex scaffold 6 well insert | Reinnervate Ltd | AVP004-96 | |
| B27 Supplement (50x) | ThermoFisher Scientific | 17504001 | |
| BrainPhys without Phenol Red | StemCell technologies | #05791 | Referenced as neuronal medium in the text |
| Filter units 250 mL or 500 mL | Corning Sigma | CLS431096/97 | |
| Forceps | Any suitable | ||
| Gentamicin (50 mg/mL) | ThermoFisher Scientific | 15750037 | |
| Glutamax Supplement (100x) | ThermoFisher Scientific | 35050061 | Referenced as L-glutamine in the text |
| Rubber teat + Glass pipette | Any suitable | ||
| GENERATION OF lt-NES cells | |||
| 2-Mercaptoethanol 50 mM | ThermoFisher Scientific | 31350010 | |
| Animal Free Recombinant EGF | Peprotech | AF-100-15 | |
| B27 Suplemment (50x) | Thermo Fisher Scientific | 17504001 | |
| bFGF | Peprotech | AF-100-18B | |
| Bovine Albumin Fraction V (7.5% solution) | ThermoFisher Scientific | 15260037 | |
| Cyclopamine, V. calcifornicum | Calbiochem | # 239803 | |
| D (+) Glucose solution (45%) | Sigma | G8769 | |
| Dimethyl sulfoxide (DMSO) | Sigma Aldrich | D2438-10mL | |
| DMEM/F12 | ThermoFisher Scientific | 11320074 | |
| Dulbecco's Phosphate Buffer Saline (DPBS) | Thermo Fisher Scientific | 14190-144 | Without calcium and magnesium |
| Laminin Mouse Protein, Natural | Thermo Fisher Scientific | 23017015 | |
| MEM Non-essential aminoacids solutions (100x) | ThermoFisher Scientific | 11140050 | |
| N-2 Supplement (100 x) | ThermoFisher Scientific | 17502001 | |
| Poly-L-Ornithine | Merk | P3655 | |
| Recombinant Human BMP-4 Protein | R&D Systems | 314-BP-010 | |
| Recombinant Human Wnt-3a Protein | R&D Systems | 5036-WN | |
| Sodium Pyruvate (100 mM) | ThermoFisher Scientific | 11360070 | |
| Soybean Trypsin Inhibitor, powder | Thermo Fisher Scientific | 17075029 | |
| Sterile deionized water | MilliQ | MilliQ filter system | |
| Trypsin EDTA (0.25%) | Sigma | T4049-500ML | |
| EQUIPMENT FOR CELL CULTURE | |||
| Adjustable volume pipettes 10, 100, 200, 1000 µL | Eppendorf | Various | |
| Basement membrane matrix ESC-qualified (Matrigel) | Corning | CLS354277-1EA | |
| Centrifuge | Hettich Centrifugen | Rotina 420R | 5% CO2, 37 °C |
| Incubator | ThermoForma Steri-Cult CO2 | HEPA Class100 | |
| Stem cell cutting tool 0.190-0.210 mm | Vitrolife | 14601 | |
| Sterile tubes | Sarstedt | Various | |
| Sterile Disposable Glass Pasteur Pipettes 150 mm | VWR | 612-1701 | |
| Sterile pipette tips 0.1-1000 µL | Biotix VWR | Various | |
| Sterile Serological Pipettes 5, 10, 25, 50 mL | Costar | Various | |
| T25 flasks Nunc | ThermoFisher Scientific | 156367 | |
| IMMUNOHISTOCHEMISTRY | |||
| 488-conjugated AffinityPure Donkey anti-mouse IgG | Jackson ImmunoReserach | 715-545-151 | |
| 488-conjugated AffinityPure Donkey anti-rabbit IgG | Jackson ImmunoReserach | 711-545-152 | |
| 488-conjugated AffinityPure Donkey anti-chicken IgG | Jackson ImmunoReserach | 703-545-155 | |
| Alexa fluor 647-conjugated Streptavidin | Jackson ImmunoReserach | 016-600-084 | |
| Bovine Serum Albumin | Jackson ImmunoReserach | 001-000-162 | |
| Chicken anti-GFP | Merk Millipore | AB16901 | |
| Chicken anti-MAP2 | Abcam | ab5392 | |
| Cy3-conjugated AffinityPure Donkey anti-chicken IgG | Jackson ImmunoReserach | 703-165-155 | |
| Cy3-conjugated AffinityPure Donkey anti-goat IgG | Jackson ImmunoReserach | 705-165-147 | |
| Cy3-conjugated AffinityPure Donkey anti-mouse IgG | Jackson ImmunoReserach | 715-165-151 | |
| Diazabicyclooctane (DABCO) | Sigma Aldrich | D27802 | Mounting media |
| Goat anti-AIF1 (C-terminal) | Biorad | AHP2024 | |
| Hoechst 33342 | Molecular Probes | Nuclear staining | |
| Mouse anti-MBP | BioLegend | 808402 | |
| Mouse anti-SC123 | Stem Cells Inc | AB-123-U-050 | |
| Normal Donkey Serum | Merk Millipore | S30-100 | |
| Paint brush | Any suitable | ||
| Paraformaldehyde (PFA) | Sigma Aldrich | 150127 | |
| Potassium Phospate Buffer Saline, KPBS (1x) | |||
| Distilled water | |||
| Potassium dihydrogen Phospate (KH2PO4) | Merk Millipore | 104873 | |
| Potassium phospate dibasic (K2HPO4) | Sigma Aldrich | P3786 | |
| Sodium chloride (NaCl) | Sigma Aldrich | S3014 | |
| Rabbit anti-NeuN | Abcam | ab104225 | |
| Rabbit anti-Olig2 | Abcam | ab109186 | |
| Rabbit anti-TMEM119 | Abcam | ab185333 | |
| Sodium azide | Sigma Aldrich | S2002-5G | |
| Sodium citrate | |||
| Distilled water | |||
| Tri-Sodium Citrate | Sigma Aldrich | S1804-500G | |
| Tween-20 | Sigma Aldrich | P1379 | |
| Triton X-100 | ThermoFisher Scientific | 327371000 | |
| EQUIPMENT FOR IMMUNOHISTOCHEMISTRY | |||
| Confocal microscope | Zeiss | LSM 780 | |
| Microscope Slides 76 mm x 26 mm | VWR | 630-1985 | |
| Microscope Coverslips 24 mm x 60 mm | Marienfeld | 107242 | |
| Microscope Software | Zeiss | ZEN Black edition | |
| Rubber teat + Glass pipette | Any suitable |
References
- Kuriakose, D., Xiao, Z. Pathophysiology and treatment of stroke: Present status and future perspectives. International Journal of Molecular Sciences. 21 (20), 7609(2020).
- Armstrong, M. J., Okun, M. S. Diagnosis and treatment of Parkinson disease: A review. The Journal of the American Medical Association. 323 (6), 548-560 (2020).
- Lindvall, O., Kokaia, Z., Martinez-Derrano, A. Stem cell therapy for human neurodegenerative disorders-How to make it work. Nature Medicine. 10, 42-50 (2004).
- Reubinoff, B. E., et al. Neural progenitors from human embryonic stem cells. Nature Biotechnology. 19 (12), 1134-1140 (2001).
- Chandrasekaran, A., et al. Comparison of 2D and 3D neural induction methods for the generation of neural progenitor cells from human induced pluripotent stem cells. Stem Cell Research. 25, 139-151 (2017).
- Tornero, D., et al. Synaptic inputs from stroke-injured brain to grafted human stem cell-derived neurons activated by sensory stimuli. Brain. 140 (3), 692-706 (2017).
- Palma-Tortosa, S., et al. Activity in grafted human iPS cell-derived cortical neurons integrated in stroke-injured rat brain regulates motor behavior. Proceedings of the National Academy of Sciencesof the United States of America. 117 (16), 9094-9100 (2020).
- Robinson, N. B., et al. The current state of animal models in research: A review. International Journal of Surgery. 72, 9-13 (2019).
- Akhtar, A. The flaws and human harms of animal experimentation. Cambridge Quarterly Healthcare Ethics. 24 (4), 407-419 (2015).
- Gonzalez-Ramos, A., et al. Human stem cell-derived GABAergic neurons functionally integrate into human neuronal networks. Scientific Reports. 11, 22050(2021).
- Noraberg, J., et al. Organotypic hippocampal slice cultures for studies of brain damage, neuroprotection and neurorepair. Current Drug Targets. CNS & Neurological Disorders. 4 (4), 435-452 (2005).
- Delavaran, H., et al. Proximity of brain infarcts to regions of endogenous neurogenesis and involvement of striatum in ischaemic stroke. European Journal of Neurology. 20 (3), 473-479 (2013).
- Sabuncu, M. R., et al. The dynamics of cortical and hippocampal atrophy in Alzheimer disease. Archives of Neurology. 68 (8), 1040-1048 (2011).
- Eugene, E., et al. An organotypic brain slice preparation from adult patients with temporal lobe epilepsy. The Journal of Neuroscience Methods. 235, 234-244 (2014).
- Mendes, N. D., et al. Free-floating adult human brain-derived slice cultures as a model to study the neuronal impact of Alzheimer's disease-associated Aβ oligomers. The Journal of Neuroscience Methods. 307, 203-209 (2018).
- Kalmbach, B. E., et al. Signature morpho-electric, transcriptomic, and dendritic properties of human layer 5 neocortical pyramidal neurons. Neuron. 109 (18), 2914-2927 (2021).
- Barth, M., et al. Microglial inclusions and neurofilament light chain release follow neuronal alpha-synuclein lesions in long-term brain slice cultures. Molecular Neurodegeneration. 16 (1), 54(2021).
- Almeida, G. M., et al. Neural infection by oropouche virus in adult human brain slices induces an inflammatory and toxic response. Frontiers in Neuroscience. 15, 674576(2021).
- Schwarz, N., et al. Human cerebrospinal fluid promotes long-term neuronal viability and network function in human neocortical organotypic brain slice cultures. Scientific Reports. 7, 12249(2017).
- Miskinyte, G., et al. Direct conversion of human fibroblasts to functional excitatory cortical neurons integrating into human neural networks. Stem Cell Research & Therapy. 8 (1), 207(2017).
- Gronning Hansen, M., et al. Grafted human pluripotent stem cell-derived cortical neurons integrate into adult human cortical neural circuitry. Stem Cells Translational Medicine. 9 (11), 1365-1377 (2020).
- Falk, A., et al. Capture of neuroepithelial-like stem cells from pluripotent stem cells provides a versatile system for in vitro production of human neurons. PLoS One. 7 (1), 29597(2012).
- Avaliani, N., et al. Optogenetics reveal delayed afferent synaptogenesis on grafted human-induced pluripotent stem cell-derived neural progenitors. Stem Cells. 32 (12), 3088-3098 (2014).
- Engel, J., et al. Practice parameter: temporal lobe and localized neocortical resections for epilepsy. Epilepsia. 44 (6), 741-751 (2003).
- Qi, X. R., et al. Human brain slice culture: A useful tool to study brain disorders and potential therapeutic compounds. Neuroscience Bulletin. 35 (2), 244-252 (2019).
- Verwer, R. W., et al. Injury response of resected human brain tissue in vitro. Brain Pathology. 25 (4), 454-468 (2015).
- Verwer, R. W., et al. Altered loyalties of neuronal markers in cultured slices of resected human brain tissue. Brain Pathology. 26 (4), 523-532 (2016).
- Xu, L., Wang, J., Ding, Y., Wang, L., Zhu, Y. J. Current knowledge of microglia in traumatic spinal cord injury. Frontiers in Neurology. 12, 796704(2021).
- Jones, R. S., da Silva, A. B., Whittaker, R. G., Woodhall, G. L., Cunningham, M. O. Human brain slices for epilepsy research: Pitfalls, solutions and future challenges. Journal of Neuroscience Methods. 260, 221-232 (2016).
- Schwarz, N., et al. Long-term adult human brain slice cultures as a model system to study human CNS circuitry and disease. Elife. 8, 48417(2019).
- Lancaster, M. A., Knoblich, J. A. Organogenesis in a dish: Modeling development and disease using organoid technologies. Science. 345 (6194), 1247125(2014).
- Wang, Z., et al. Organoid technology for brain and therapeutics research. CNS Neuroscience & Therapeutics. 23 (10), 771-778 (2017).
- Wang, H. Modeling neurological diseases with human brain organoids. Frontiers in Synaptic Neuroscience. 10, 15(2018).
- Palma-Tortosa, S., Coll-San Martin, B., Kokaia, Z., Tornero, D. Neuronal replacement in stem cell therapy for stroke: Filling the gap. Frontiers in Cell and Developmental Biology. 9, 662636(2021).
Reprints and Permissions
