Salmonella invades and replicates inside intestinal epithelial cells both in Salmonella-specific vacuoles and free in the cytosol (hyper-replication). A high-throughput fluorescence microscopy-based protocol is described here to quantify the intracellular phenotypes of Salmonella by two complementary image analyses through ImageJ, reaching single-cell resolution and scoring.
Method Article
Automated Analysis of Intracellular Phenotypes of Salmonella Using ImageJ
In This Article
Summary
Abstract
Salmonella is an enteric pathogen able to invade the intestinal epithelium and replicate in enterocytes, both inside Salmonella-specific vacuoles and free in the cytosol (cytosolic hyper-replication). These different phenotypes of intracellular replication drive to different pathways of pathogenesis, i.e., cytosolic hyper-replication induces inflammatory cell death and extrusion into the gut lumen, while vacuolar replication leads to trans-epithelium penetration and systemic spread. Significant effort was made to create microscopy tools to study the behavior of Salmonella inside invaded cells, such as the pCHAR-Duo fluorescence reporter plasmid that allows discrimination between vacuolar and cytosolic bacteria by differential expression of mCherry and GFP. However, intracellular phenotypes are often manually scored, a time-consuming procedure that limits analysis to a small number of samples and cells. To overcome these limitations, two complementary and automated image analyses were developed using ImageJ, a freely available image analysis software. In the high-throughput protocol, epithelial cells were infected with Salmonella carrying pCHAR-Duo using 96-well plates. Imaging was performed using an automated fluorescence microscope. Then, two image analysis methods were applied to measure the intracellular behavior of Salmonella at different detail levels. The first method measures the overall intracellular bacterial load and the extent of cytosolic hyper-replication. It is fast and allows the scoring of a high number of cells and samples, making it suitable for high-throughput assays such as screening experiments. The second method performs single-cell analysis to determine the percentage of infected cells, the mean vacuolar load of Salmonella, and the cytosolic hyper-replication rate giving greater details about Salmonella behavior inside epithelial cells. The protocols can be performed by specifically designed ImageJ scripts to automatically run batch analyses of the major steps of Salmonella-enterocyte interaction.
Introduction
Salmonella is the most frequently reported bacterial agent causing outbreaks of foodborne disease in the European Union1. The primary pathological manifestation of Salmonella infection is enteritis, which is the result of the pathogen behavior in the gut following ingestion and the consequent local inflammatory response2. However, Salmonella can also disseminate to extra-intestinal sites and cause systemic infection, especially in immunocompromised individuals. The type of interaction between Salmonella and the intestinal epithelium conditions the outcome of the infection. Once in the gut lumen, Salmonella invades and replicates inside intestinal epithelial cells. At the intracellular level, Salmonella can present two different replication phenotypes, the cytosolic hyper-replication and the intravacuolar slow replication within Salmonella-containing vacuoles (SCVs). The cytosolic hyper-replication induces inflammatory host cell death and Salmonella extrusion into the gut lumen3; the vacuolar replication leads to a trans-epithelium penetration and systemic spread4. Therefore, the extent of invasion and vacuolar vs. cytosolic replication influences the course of infection.
The genus Salmonella is very diverse, including thousands of serotypes with different host-ranges and abilities to cause disease. For example, S. Typhimurium is defined as a generalist serovar, because it infects multiple unrelated hosts, and represents one of the major causes of human salmonellosis. Differently, S. Derby is considered a swine-adapted serovar, as it is mostly isolated from the swine, but it is also reported in the top five of the serovars responsible for human infection1. However, knowledge about the bacterial behavior inside the epithelial cells is essentially limited to the study of a few reference strains, as S. Typhimurium SL1344, that do not represent the vast natural diversity of Salmonella pathogenicity. Characterizing the interaction of different strains of Salmonella with epithelial cells would contribute to understanding their different pathogenicity. For this reason, a high-throughput fluorescence microscopy-based protocol was developed to analyze the intracellular behavior of a large number of strains in a fast and largely automated way. In this protocol, infection of epithelial cells was performed in 96-well imaging plates and image acquisition was made using an automated fluorescence microscope. The pCHAR-Duo plasmid was used to observe the invasion and replication phenotypes of Salmonella inside epithelial cells through fluorescent microscopy5. This plasmid carries the gene encoding the red fluorescent reporter mCherry, constitutively expressed by all the transformed bacterial cells, and the gene encoding the green fluorescent reporter GFP, whose expression is activated by glucose-6-phosphate present exclusively in the cytosol of eukaryotic cells and absent in SCVs. Therefore, the plasmid allows discrimination between vacuolar and cytosolic bacteria by differential expression of mCherry and GFP reporters.
The vacuolar and cytosolic bacteria on microscopy images are commonly quantified by manual scoring6, but this is a time-consuming method that limits analysis to a small number of samples. Therefore, two complementary and automated image analyses were developed-area analysis and single-cell analysis-using ImageJ7, a freely available image analysis software. The area analysis measures the overall intracellular bacterial load and the extent of cytosolic hyper-replication by using data of areas occupied by epithelial cells, red and green Salmonellae in each acquired microscopy image. This method can be applied to images acquired at low magnification; therefore, it allows to score a high number of epithelial cells with few images, shortening the acquisition time. The single-cell analysis uses cell segmentation to determine the percentage of infected cells, the mean vacuolar load, and the percentage of infected cells undergoing cytosolic hyper-replication with single-cell resolution.
In this protocol, all steps of the image analysis are described in detail to be performed manually, but the same analysis can be automated by our specifically designed ImageJ scripts. These scripts also allow to run batch analyses to automatically analyze multiple images and thus speed up the execution of the method.
Protocol
1. Infection of epithelial cells with Salmonella carrying pCHAR-Duo reporter plasmid
NOTE: A multichannel pipette is recommended.
- Coat 96-well imaging plates with black walls and flat glass bottom with collagen right before use.
- Dilute glacial acetic acid (17. 4 M) in sterile demineralized water under a chemical hood to obtain a 20 mM acetic acid solution. Under sterile conditions, filter the solution through a syringe filter with 0.2 µm pore size. Leave the solution in a 0-4 °C rack for 5 min.
- Dilute 3 mg/mL collagen stock to 50 µg/mL in pre-cooled 20 mM acetic acid solution. Mix by inverting 10 times, and then dispense 30 µL of collagen solution per well (5 µg of collagen/cm2), keeping the solution in a 0-4 °C rack to avoid collagen gelling.
- Ensure that the well bottoms are completely covered with collagen, and then leave the plate under laminar flow for 1 h at room temperature (RT).
- Gently remove the solution and perform three washes with 30 µL of phosphate-buffered saline (PBS). Use a multichannel 100 µL or 50 µL pipette to avoid collagen detachment.
- Culture INT407 epithelial cells in collagen-coated imaging plates 20-24 h prior to infection.
- Routinely culture INT407 cells in 25 cm2 flasks in Minimum Essential Medium with 10% of fetal bovine serum (FBS), hereafter defined Culture Medium (CM), supplemented with penicillin 100 U/mL and streptomycin 100 µg/mL (Pen/Strep).
- Wash twice INT407 flasks with 5 mL of PBS, and then detach the cells with 1 mL of trypsin-EDTA solution for 3-5 min at 37 °C in humidified 5% CO2 atmosphere 20-24 h prior to infection. Count the cells and prepare a 3 x 10⁵ cells/mL suspension in the CM.
- Dispense 100 µL of cell suspension/well in collagen-coated imaging plates to obtain 100% confluence. Incubate at 37 °C in humidified 5% CO2 atmosphere for 1 h to facilitate cell adhesion. Then, add 100 µL of CM and incubate at 37 °C in humidified 5% CO2 atmosphere for 20-24 h until the infection (step 1.4).
NOTE: In order to image intracellular bacteria, Salmonella strains are transformed with the pCHAR-Duo reporter plasmid that was kindly provided by Dr. Olivia Steele-Mortimer. The tested strains here were selected to represent the phenotype diversity covered by the protocol and validate the image analyses in section 4. See the representative results for more details about the strains used in this study.
- Prepare stationary-phase cultures of Salmonella strains carrying the pCHAR-Duo reporter plasmid.
- Sample the Salmonella glycerol stock with the tip of a 10 µL pipette and inoculate it into 1 mL of Luria Bertani broth (10 g tryptone, 5 g yeast extract, and 10 g sodium chloride per liter) supplemented with ampicillin 100 µg/mL.
- Incubate the inoculum statically at 37 °C for 20 h prior to infection to reach the stationary phase of growth, corresponding to ~1 x 10⁹ Colony Forming Units (CFU)/mL8.
- Infect INT407 epithelial cells with Salmonella.
NOTE: Infections are performed in triplicates.- Gently wash INT407 cells with 200 µL of PBS/well.
- Prepare Salmonella inoculum by diluting bacteria overnight culture in CM to obtain the desired number of CFUs per epithelial cell, defined as the multiplicity of infection (MOI). Here MOI 100 was used.
- Inoculate 200 µL/well, and then cover the plate with a breathable sealing membrane and incubate at 37 °C in humidified 5% CO2 atmosphere for 1 h. Inoculation is considered as time zero of the infection.
- Remove the inoculum and gently wash with 200 µL of PBS/well, and then add 200 µL of CM with gentamicin 100 µg/mL per well. Cover the plate with a breathable sealing membrane, and then incubate at 37 °C in humidified 5% CO2 atmosphere for 1 h.
- Remove the CM with gentamicin 100 µg/mL and gently wash with 200 µL of PBS/well. Add 200 µL of CM with gentamicin 10 µg/mL per well, cover the plate with a breathable sealing membrane, and then incubate at 37 °C in humidified 5% CO2 atmosphere for 8 h.
2. Sample fixation and epithelial cell staining
NOTE: Maintain the samples protected from direct light exposure. Volumes are indicated for wells of a 96-well plate. Volume optimization is required for different cell culture plates or supports.
- At 8 h post-infection, remove CM and gently wash three times with 200 µL/well of PBS. Remove PBS by inverting the plate on absorbent paper; avoid aspirating.
- Fix the infected monolayers with 100 µL/well of paraformaldehyde (PFA) 4% in PBS for 20 min at RT. Remove PFA 4% and wash three times with 200 µL/well of PBS. The plate can be stored for a maximum of 16-24 h at 4 °C. Proceed with the next step.
- Stain epithelial cells.
NOTE: DAPI (4′,6-diamidino-2-phenylindole) DNA stain (step 2.3.1) is used for the area analysis to stain nuclei only, and High Content Screening (HCS) stain (step 2.3.2) is used for the single-cell analysis to stain the whole epithelial cell. Other cellular stains can be used, but optimization of image acquisition and analysis is required.- Area analysis: dispense 100 µL/well of DAPI (300 nM solution in PBS) and incubate 5 min at RT protected from light.
- Single-cell analysis: permeabilize with 100 µL/well of triton 0.1x in PBS for 15 min at RT. Wash three times with PBS and dispense 100 µL/well of HCS stain diluted 1:2000 in PBS. Incubate for 30 min at RT protected from light.
- Remove the staining solution and wash three times with 200 µL/well of PBS. Add 50 µL/well of PBS for automated image acquisition.
3. Image acquisition with an automated fluorescence microscope
NOTE: Here, low magnification (10x/0.3 NA, 1 µm/pixel objective) in step 3.1.1 for the area analysis and high magnification (40x/0.75 NA, 0.255 µm/pixel objective) in step 3.1.2 for the single-cell analysis are used in acquisition protocol. Other magnifications can be used, but optimization of image acquisition and analysis is required. If allowed by the available microscope, acquire images as Tile Regions (TRs), a "mosaic" of contiguous fields called tiles, to record large sample areas. Set the autofocus at the center of a TR instead of setting one for each tile, to reduce sample exposure during the autofocus procedure.
- Use software autofocus in the cell staining channel (blue channel for HCS stain and DAPI nuclear stain) as the reference z-position. Acquire images in cell staining channel (465 nm, cells or nuclei) and in pCHAR-Duo reporter channels mCherry (610 nm, intracellular Salmonellae) and GFP (509 nm, cytosolic hyper-replicating Salmonellae).
- Area analysis: Image ≥104 cells/technical replicate (i.e., at least three TRs of four tiles/well corresponding to a technical replicate are recommended) at 10x magnification.
NOTE: A single z-plane is sufficient to image both cells containing vacuolar and cells containing cytosolic hyper-replicating Salmonellae at 10x magnification. - Single-cell analysis: Image ≥1,000 cells/technical replicate (i.e., at least two TRs of 16 tiles/well corresponding to a technical replicate are recommended) at 40x magnification. Multiple z-planes are required to image both cells containing vacuolar and cells containing cytosolic hyper-replicating Salmonellae. Define the optimal z-stack (3.85 µm z-stack with 0.55 µm interval to obtain eight z-planes is indicated to image INT407 cells infected with cytosolic hyper-replicating Salmonellae at 40x). Each z-plane is hereafter identified as n/8, with n between 1 (corresponding to the bottom z-plane) and 8 (corresponding to the top z-plane).
- Area analysis: Image ≥104 cells/technical replicate (i.e., at least three TRs of four tiles/well corresponding to a technical replicate are recommended) at 10x magnification.
- The output of each acquisition is a file named Acquisition.czi that includes images of all fields, channels, and z-planes. If TRs were acquired, fuse the tiles together to get an overall image of each TR by using a single Acquisition.czi file as input for the Stitching method.
4. Image analysis using ImageJ
NOTE: Step 4.1 and step 4.2 are specifically designed for the experiment and acquisition described above. Other experimental settings could require optimization of analysis. The analysis of a single Acquisition.czi file is described. For the batch analysis, find the single-cell analysis script and area analysis script as supplemental files (Supplemental File 1 and Supplemental File 2). Labels used in the scripts and ImageJ commands are in bold in the sections below.
- Area analysis
- Open the Acquisition.czi file in ImageJ, named as AcquisitionTitle in the script: File > Open > AcquisitionTitle.czi. A window showing all the channels will open. The channels are indicated as c:1-3/3 depending on the acquisition order. Here, c:1/3 corresponds to blue (DAPI), c:2/3 to mCherry (intracellular Salmonellae), and c:3/3 to GFP (cytosolic hyper-replicating Salmonellae).
- Reduce random noise to prepare images for area measurement in steps 4.1.6 and 4.1.7.
- Duplicate the AcquisitionTitle window using Image > Duplicate > OK to obtain the AcquisitionTitle1 window.
- Apply Gaussian blur to AcquisitionTitle1 through Process > Filter > Gaussian Blur. Leave the default Sigma value as 2, and click on OK. A Process Stack? window will open, click on Yes to process all the channels.
- Subtract the gaussian-filtered AcquisitionTitle1 from the original file AcquisitionTitle by Process > Image Calculator: select AcquisitionTitle as Image1, choose the operation Subtract in the dropdown list, and then select AcquisitionTitle1 as Image2. Click on OK. A Process Stack? window will open. Click on Yes to process all three images (channels) to obtain the ResultsOfAcquisitionTitle window.
- Split channels through Image > Color > Split Channels. Each channel image is now shown in a separate window, automatically named by ImageJ as C-ResultsOfAcquisitionTitle. Here C1-ResultsOfAcquisitionTitle corresponds to DAPI, C2-ResultsOfAcquisitionTitle to mCherry (intracellular Salmonellae), and C3-ResultsOfAcquisitionTitle to GFP (cytosolic hyper-replicating Salmonellae).
- Process the C1-ResultsOfAcquisitionTitle image to measure the area occupied by epithelial cell nuclei.
- Navigate to Process > Smooth to homogenize the nucleolus that appears as holes inside the nuclei area.
- Threshold the C1-ResultsOfAcquisitionTitle image to exclude the background using Image > Adjust > Threshold: check Dark Background and select Red in the dropdown list. Set the Triangle auto-threshold, and then use the upper slider to set the minimum threshold value when the nuclei appear red, and the background appears black (Threshold = 100, applied in this protocol).
NOTE: The auto-thresholds described in steps 4.1.4.2, 4.1.7, 4.2.3.6.1, and 4.2.4.3 are suggested as a guide for the user to define the best fitting threshold for nuclei/epithelial cells and bacteria manually, respectively. The value of the auto-threshold will be overridden in the script by the defined manual threshold. The defined manual threshold will be applied to the entire batch analysis.
- Choose the measurements of interest by using Analyze > Set Measurement: Check Limit to Threshold to limit the measurement to thresholded pixels. Check Area, corresponding to the total area occupied by thresholded pixels (i.e., nuclei in C1-ResultsOfAcquisitionTitle, intracellular Salmonellae in C2-ResultsOfAcquisitionTitle, cytosolic hyper-replicating Salmonellae in C3- ResultsOfAcquisitionTitle). Check Display Label to record the acquisition title and channel for every image in the result table.
- Measure the area occupied by the nuclei using Analyze > Measure. Measurements are recorded into the result table that automatically opens.
- Process C2-ResultsOfAcquisitionTitle and C3-ResultsOfAcquisitionTitle to measure the area occupied by overall intracellular Salmonellae and cytosolic hyper-replicating Salmonellae, respectively. Follow steps 4.1.4-4.1.6 with some modifications: skip the smoothing step in step 4.1.4.1 and use the Otsu auto-threshold instead of the Triangle in step 4.1.4.2 as a guide to set the minimum threshold value (upper slider) when Salmonellae appear red and the background appears black (Threshold = 200 suggested).
- Save the Result table using File > Save As > All Files.
- Open the Result table in a spreadsheet in order to calculate area ratios for each analyzed AcquisitionTitle file:
- Calculate the infection ratio: divide the area occupied by total intracellular Salmonellae (here red channel, C2-) by the area occupied by epithelial cell nuclei (here DAPI, C1-).
- Calculate the hyper-replication ratio: divide the area occupied by cytosolic hyper-replicating Salmonellae (green channel, C3-) by the area occupied by total intracellular Salmonellae (red channel, C2-).
- Single-cell analysis
- Open Acquisition.czi file in ImageJ, named as AcquisitionTitle in the script: File Menu > Open > Acquisition.czi. A window showing the images of all channels and all z-planes will open.
- Split the channels by Image > Color > Split Channels. The channels are now shown in separated windows, automatically named by ImageJ as C-AcquisitionTitle. Here, the C1-AcquisitionTitle window corresponds to epithelial cells (blue), the C2-AcquisitionTitle window to intracellular Salmonellae (mCherry), and the C3-AcquisitionTitle window to cytosolic hyper-replicating Salmonellae channel (GFP). Each C-AcquisitionTitle window includes all the z-planes acquired.
- Process the C1-AcquisitionTitle window, corresponding to epithelial cells, to segment cells.
- Choose the z-plane image to use for cell segmentation. Select the C1-AcquisitionTitle window and use Image > Duplicate: write the number of the chosen z-plane (i.e., 1 to select z 1/8), write C1Zplane in the Title box, uncheck Duplicate Stack, and then click on OK to duplicate the selected z-plane image only. A window called C1Zplane showing the selected z-plane image will open.
- Process the obtained C1Zplane image to enhance the image contrast. Open Process > Enhance Contrast: adjust the saturated pixels (i.e., here 1% is used) and check Normalize. Then, click on OK to apply the contrast enhancement technique to obtain a contrast-normalized C1Zplane image.
- Process the contrast-normalized C1Zplane image to segment the epithelial cells. Use Process > Find Maxima to open the FindMaxima menu: first, flag the Preview Point Selection to set Noise Tolerance in order to attribute only one maxima point to every single epithelial cell. Flag Exclude Edge Maxima. Select output type Segmented Particles and click on OK to obtain C1ZplaneSegmented, a new binary mask-like image showing each segmented particle per maxima point marked.
NOTE: The Find Maxima ImageJ algorithm is used to segment cells. Maxima points (pixel intensity peaks) are detected across the image, potentially corresponding to cells. A noise threshold (noise tolerance) is set, and the contiguous area around maxima points is analyzed to create a binary mask-like image defining each segmented particle per maxima point, hence each cell. - Process C1ZplaneSegmented image to create a mask of segmented cells. Use Analyze > Analyze Particles: select the option Show Masks and Exclude on Edges. Adjust the area range of segmented particles to include in the mask, corresponding to the Size parameter, in order to exclude wrongly segmented objects such as cell clusters and cell fractions. To score the area of erroneously segmented objects, use the Wand tracing tool in the toolbar: select particle with the Wand, and then open Analyze > Measure to measure the area of erroneous objects. Set the Size interval (suggested range 250-1700 pixel2) and click on OK to obtain the MaskofC1ZplaneSegmented binary mask.
- By default, the MaskOfC1ZplaneSegmented binary mask has an inverting LUT. Use LUT > Invert LUT in the toolbar.
- Process the MaskOfC1ZplaneSegmented binary mask to correct cell segmentation:
- Threshold contrast-normalized C1Zplane image obtained in step 4.2.3.2. Use Image > Adjust > Threshold: check Dark Background. Set the Default auto-threshold setting. Choose the Red option and adjust the minimum cutoff value (upper bar) until cells appear completely red, leaving dark background (Threshold = 8,000 applied in this protocol). Then, click on Apply to convert the contrast-normalized C1Zplane image into a binary image with cells in white and the background in black.
- Correct cell segmentation in MaskOfC1ZplaneSegmented binary mask. Use Process > Image Calculator: select MaskOfC1ZplaneSegmented as Image1, choose the operation AND in the dropdown list, and then select the thresholded contrast-normalized C1Zplane as Image2. Click on OK. The output image is automatically named by ImageJ as Results of Mask of C1Zplane Segmented.
- Process Results of Mask of C1Zplane Segmented to label every single-segmented cell as a Region of Interest (ROI). Use Analyze > Analyze Particles. Adjust Size as in step 4.2.3.4, and then select the option Show Nothing. Check Add to Manager to add all the particles (segmented cells) to the ROI Manager tool. Also, check Exclude on Edges. Click on OK. The ROI Manager Menu will show a list of all particles (segmented cells), defined as ROIs, uniquely labeled with their respective y and x coordinates.
- Save ROIs data as ROI-cells-AcquisitionTitle.zip through the ROI Manager Menu by clicking on More > Save. ROI-cells-AcquisitionTitle.zip will be opened in step 4.2.4.6 for the single cell analysis.
- Process the C2-AcquisitionTitle window (here red channel), corresponding to intracellular Salmonellae, to measure the number of infected cells and the intracellular vacuolar load.
- Subtract the green channel (C3-) from the red channel (C2-) to remove out-of-focus pixels of the cytosolic hyper-replicating Salmonellae.
- Use Process > Image Calculator. Select C2-Acquisitiontitle as Image1, choose the operation Subtract in the dropdown list, and then select C3-Acquisitiontitle as Image2. Check Create New Window and click on OK.
- Apply subtraction to the whole z-stack by clicking on Yes in the Process Stack? window. The output window is named ResultsOfC2AcquisitionTitle in the script.
- Process ResultsOfC2AcquisitionTitle to reduce random noise.
- Duplicate the ResultsOfC2AcquisitionTitle window by clicking on Image Menu > Duplicate. Check Duplicate Stack and press OK to obtain the ResultsOfC2AcquisitionTitle1 window.
- Apply Gaussian Blur to the ResultsOfC2AcquisitionTitle1 window through Process > Filter > Gaussian Blur. Leave Sigma value as 2 or customize it (i.e., here Sigma: 4 was used). Click on OK and apply Gaussian Blur to the whole z-stack by clicking on Yes in the Process Stack? window.
- Subtract the Gaussian filtered ResultsOfC2AcquisitionTitle1 to ResultsOfC2AcquisitionTitle by clicking on Process > Image Calculator. Select ResultsOfC2AcquisitionTitle as Image1, choose the Operation Subtract in the dropdown list, and then select ResultsOfC2AcquisitionTitle1 as Image2. Click on OK. Apply subtraction to the whole z-stack by clicking on Yes in the Process Stack? window to obtain a window automatically named by ImageJ as Results of Results of C2-AcquisitionTitle.
- Process the Results of Results of C2-AcquisitionTitle to separate Salmonellae from the background. Use Image > Adjust > Threshold: check Dark background and set Otsu auto-threshold. Adjust the minimum cutoff value (upper bar) until Salmonellae appear completely red, leaving dark background (Threshold = 100 applied in this protocol). Click on Apply and the Convert to Binary window will open: check Black background, and then click on OK. The full z-stack is now converted into binary images.
- Select the middle-Z-plane, corresponding to the vacuolar Salmonellae focus plane, in the results of Results of C2-AcquisitionTitle binary window from step 4.2.4.3: Image > Stacks > Set Slice and write the number of the z-plane of choice (e.g., here z: 4/8 is used). Click on OK.
- Set the measurements to record for each ROI (cell). Use Analyze > Set Measurement: check Area, corresponding to the total area of each ROI. Check Area Fraction and Limit to Threshold to record only the Area fraction occupied by thresholded pixels (intracellular Salmonellae) for each ROI. Check on Display Label to label every single ROI with the image title, channel, z-plane, and x-y coordinates in the result table.
- Process the chosen z-plane of intracellular Salmonellae to record labels, Area, and %Area occupied by Salmonellae for every single cell (ROI): open the ROI-cells-AcquisitionTitle.zip file, saved in step 4.2.3.8, by File > Open and click on Measure in the ROI Manager Menu. The output is a table reporting the selected measurements.
- Save the result table using File > Save As in the results window.
- Open ResultTable in a spreadsheet: label Area and %Area occupied by intracellular Salmonellae are indicated for each ROI, corresponding to a contoured cell uniquely identified with x and y coordinates.
- Measure the number of infected cells corresponding to ROIs showing a %Area > 0 occupied by thresholded pixels, corresponding to Salmonellae (i.e., here a %Area > 0.2% is considered to identify infected cells). Then, calculate the percentage of infected cells on the total cells.
- Measure the vacuolar load of Salmonella/cell by calculating the mean %Area occupied by vacuolar Salmonellae for all the infected cells.
- Subtract the green channel (C3-) from the red channel (C2-) to remove out-of-focus pixels of the cytosolic hyper-replicating Salmonellae.
- Process green channel (C3-AcquisitionTitle) to measure the number of cells showing cytosolic hyper-replicating Salmonellae. Follow from steps 4.2.4.2 to 4.2.4.9, but with some modifications.
- Work on the upper z-planes (here z:7/8), since cells showing cytosolic hyper-replicating Salmonellae protrude from the monolayer; therefore, they are in focus on a different plane compared to cells without hyper-replicating Salmonellae.
- Measure the number of cells containing cytosolic hyper-replicating Salmonellae (green) by scoring cells (ROIs) showing high %Area occupied by Salmonellae (e.g., a %Area > 20% is considered to identify cells containing cytosolic hyper-replicating Salmonellae). Then, calculate the percentage of cells containing cytosolic hyper replicating-Salmonellae on the total of infected cells scored in step 4.2.4.9.
Results
Infection of epithelial cells with Salmonella strains
This protocol was developed to analyze the cellular invasion and the cytosolic replication (Figure 1A) vs vacuolar load (Figure 1B) of Salmonella inside epithelial cells. The protocol was validated by using the three following Salmonella strains, S. Typhimurium SL1344 reference strain (S. Tm), S. Derby ER1175 wildtype (S. Derby wt) and the isogenic mutant of S. Derby ER1175 without sipA gene (S. Derby ΔsipA). S. Derby ER1175 strain was isolated from swine and belongs to the IZSLER surveillance collection of Salmonella isolates. The strains were selected in order to represent the phenotype diversity covered by the protocol. In particular, these strains were chosen because their behavior inside epithelial cells was already known to differ in terms of invasion or replication9; therefore, they were valuable controls to test whether the protocol allowed to quantitatively distinguish differences in intracellular Salmonella phenotypes. In particular, S. Tm and S. Derby wt were included because we had previously demonstrated that S. Tm has higher invasion and intracellular replication efficiency than S. Derby wt9 while S. Derby ΔsipA was added as a hyper-replication impaired strain since the virulence effector SipA plays a crucial role in the onset of hyper-replication10,11. It was previously reported for S. Tm that cytosolic replication starts 4 h post-invasion, and then the cytosolic population rapidly hyper-replicates to fill the epithelial cell by 8 h11,12. Consistently, 8 h long infection was suitable to observe and quantify the cytosolic hyper-replication phenotype also in S. Derby wt and S. Derby ΔsipA.
Area analysis
The area analysis in step 4.1 provides a measurement of the overall colonization of epithelial cells by Salmonella (infection ratio), together with a measurement of the hyper-replication (hyper-replication ratio). In the area analysis workflow described in Figure 2, the random noise is reduced, and then channels are split and processed independently. A threshold is set for each channel in order to exclude the background from the area measurement. Then, the area occupied by thresholded pixels is measured for each channel. The output of area analysis is a table reporting, for each acquisition file, the extension of the areas occupied by epithelial cell nuclei (blue channel), intracellular mCherry-expressing Salmonellae (red channel), and cytosolic hyper-replicating Salmonellae that express GFP (green channel) along with mCherry. The infection ratio is calculated by dividing the area occupied by mCherry-expressing Salmonellae by the area occupied by host cell nuclei. The results of the tested strains showed that S. Tm displays a significantly higher infection ratio compared to both S. Derby strains, as expected (Figure 3A). Therefore, these results demonstrate the efficacy of area analysis in detecting differences in the ability of Salmonella strains to colonize epithelial cells. Salmonella hyper-replication ratio is measured by dividing the area occupied by GFP-expressing Salmonellae by the area occupied by intracellular mCherry-expressing Salmonellae. Consistently with the role of SipA in determining hyper-replication, a significantly reduced hyper-replication ratio for S. Derby ΔsipA strain was measured compared to S. Derby wt, (Figure 3B). No hyper-replication difference was observed between S. Tm and S. Derby wt. Overall, area analysis effectively revealed different hyper-replication levels among the assayed strains.
Single-cell analysis
The single-cell analysis allows quantifying Salmonella invasion and vacuolar load vs. cytosolic replication inside epithelial cells with single-cell resolution. As described in step 4.2, for each acquisition file, blue, red, and green channels were processed independently (Figure 4). Specifically, the blue channel, corresponding to epithelial cells, was processed in step 4.2.3 to obtain cell segmentation. Then, segmented cells were added to the Region of Interest (ROI) Manager to obtain a list of ROIs, corresponding to all segmented cells uniquely labeled with y-x coordinates. In order to remove out-of-focus pixels of GFP- expressing hyper-replicating Salmonellae, the pixels of the green channel were subtracted from those of the red channel. The output table of single cell analysis reports, for each ROI, the area and the percentage of the ROI's area occupied by Salmonellae expressing the mCherry constitutive reporter only or the GFP cytosol-responsive reporter. The percentage of the cell's area occupied by mCherry-only expressing Salmonellae was processed in step 4.2.4 to calculate the percentage of infected cells and the mean vacuolar load (Figure 5A). Analysis of the vacuolar load showed that the S. Derby strains generate a mean vacuolar load significantly lower than S. Tm (Figure 5B). Conversely, only a slight and not significant reduction of the percentage of infected cells was observed in S. Derby strains compared to S. Tm (Figure 5A). The percentage of the cell's area occupied by GFP-expressing Salmonellae was processed in step 4.2.5 to obtain the hyper-replication rate. No difference was observed between S. Tm and S. Derby wt, while S. Derby ΔsipA displayed a significant decrease of hyper-replication, consistent with the result of the area analysis (Figure 5C) and the role of SipA in inducing hyper-replication.
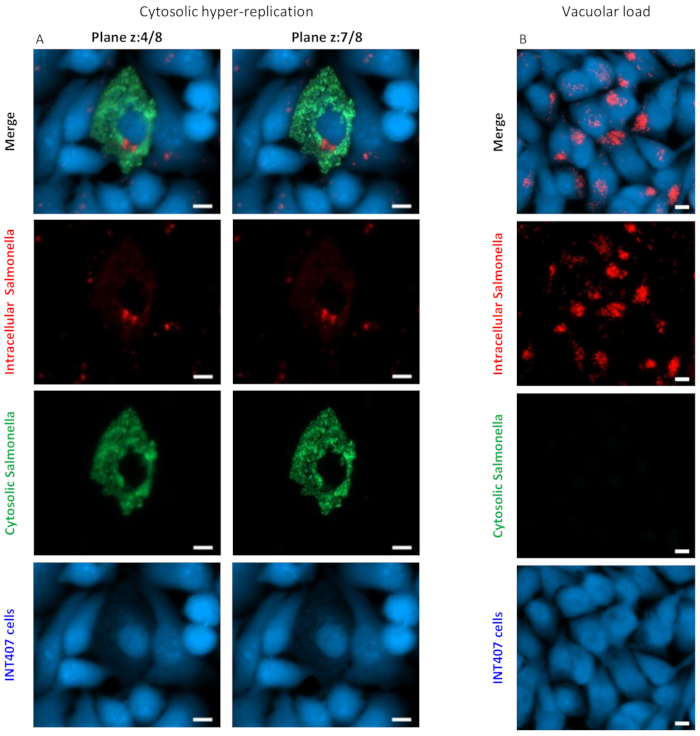
Figure 1: Salmonella cytosolic hyper-replication and vacuolar load. Representative images of (A) the Salmonella hyper-replication and (B) the vacuolar load acquired at high magnification (40x) are shown. Panel B shows the different focus planes of cells containing hyper-replicating Salmonellae (z:7/8), compared to non-hyper-replicating Salmonellae (z:4/8). White scale bars are 10 µm. Please click here to view a larger version of this figure.

Figure 2: Workflow of the area analysis. The workflow of the area analysis is shown for a representative low magnification (10x) acquisition of INT407 cells infected for 8 h with Salmonella carrying the pCHAR-Duo plasmid (MOI 100). First, the random noise is reduced, and then the channels are split into C1, C2, and C3 and processed independently. A threshold is set for each channel in order to exclude the background from the area of measurement. Then, the area occupied by the thresholded pixels only-corresponding to cell nuclei in C1, all intracellular Salmonellae in C2, and cytosolic Salmonellae in C3-is measured for each channel. The images analyzed here are the results of four tiles acquired at 10x magnification fused together by stitching. White scale bars are 100 µm. Please click here to view a larger version of this figure.
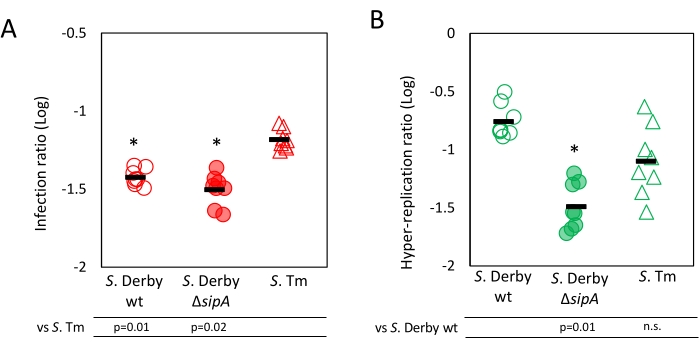
Figure 3: Results of the area analysis. The results of the area analysis are shown. (A) Infection ratio is calculated by dividing the area occupied by mCherry-expressing Salmonellae (C2 channel), representing all the intracellular bacteria, by the area occupied by host cell nuclei (C1 channel). (B) Hyper-replication ratio was measured by dividing the area occupied by GFP-expressing Salmonellae (C3 channel), representing cytosolic hyper-replicating bacteria only, by the area occupied by all intracellular mCherry-expressing Salmonellae. Each dot represents a replicate. The analysis was conducted on three biological replicates, each tested in triplicate. The black lines indicate the mean values. The significance was calculated using a two-tailed t-test, and p values are reported. Please click here to view a larger version of this figure.
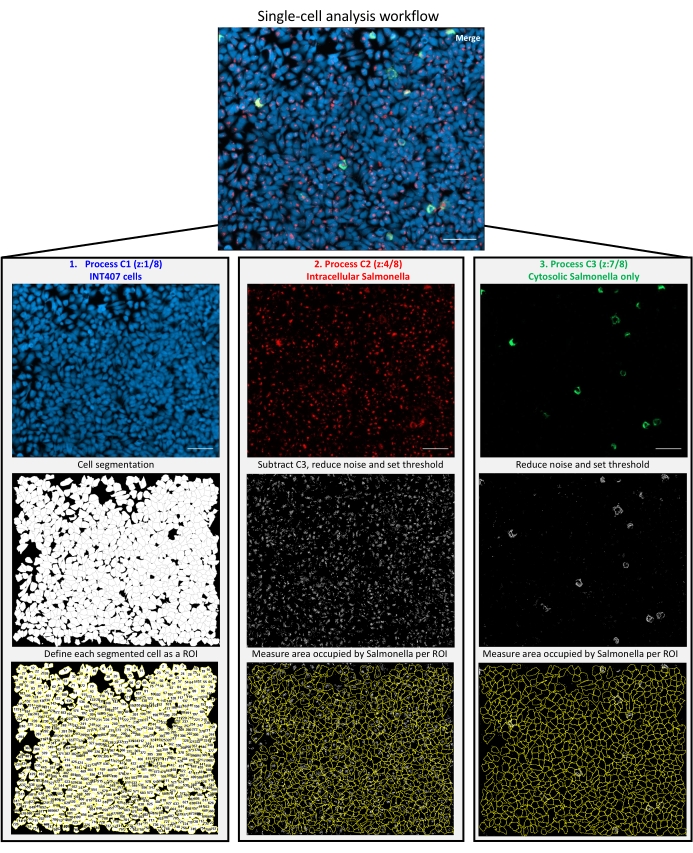
Figure 4: Workflow of the single-cell analysis. The workflow of the single-cell analysis is shown for a representative high magnification acquisition (40x) of INT407 cells infected for 8 h with Salmonella carrying the pCHAR-Duo plasmid (MOI 100). First, channels are split into C1, C2, and C3 and processed independently. Blue channel (C1), corresponding to epithelial cells, is processed to obtain cell segmentation, and then each segmented cell is defined as a Region of Interest (ROI) uniquely labeled with y-x coordinates. The red channel (C2) is processed by subtracting the green channel (C3) to remove out-of-focus cytosolic hyper-replicating Salmonellae, leaving all vacuolar Salmonellae expressing mCherry only, and then random noise was reduced, and the threshold is set to exclude the background from measurements. Finally, the area occupied by vacuolar Salmonellae for each ROI is measured. The green channel (C3), corresponding to total cytosolic GFP-expressing Salmonellae, is processed similarly. The images analyzed here are the results of 16 tiles fused together by stitching. White scale bars are 100 µm. Please click here to view a larger version of this figure.
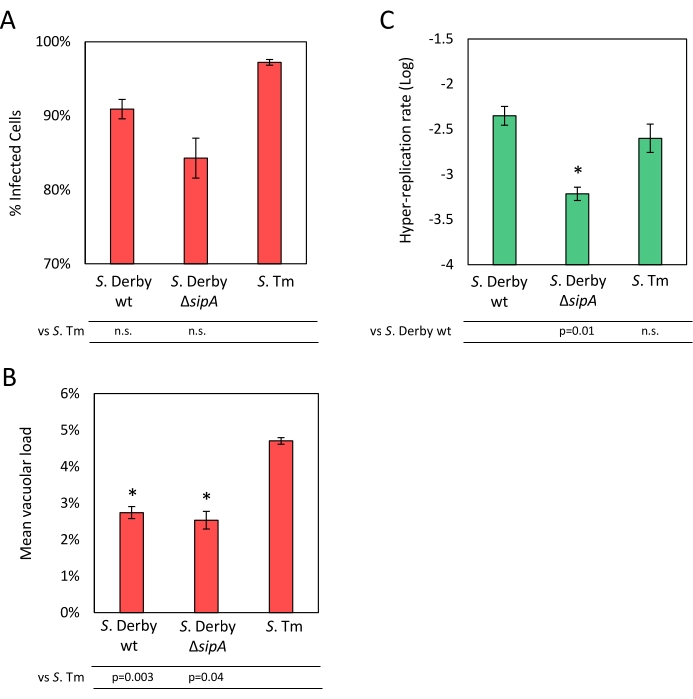
Figure 5: Results of the single-cell analysis. The results of the single-cell analysis are shown. (A) The percentage of infected cells is obtained by dividing the number of cells with a percentage of area occupied by mCherry-only expressing Salmonellae> 0.2 by the total number of cells. (B) The mean vacuolar load was obtained by calculating the mean percent area occupied by mCherry-only expressing Salmonellae in the infected cells. (C) The hyper-replication rate was calculated by dividing the number of cells with a percentage of area occupied by GFP-expressing Salmonellae≥20% by the total number of infected cells. Data from three to four biological replicates tested in triplicate are reported. The bars indicate the standard error of measurement. The significance was calculated using a two-tailed t-test, and p values are reported. Please click here to view a larger version of this figure.
Supplemental File 1: Area analysis script. Please click here to download this File.
Supplemental File 2: Single-cell analysis script. Please click here to download this File.
Discussion
The way Salmonella colonizes intestinal epithelial cells, influences the infection outcome. Upon invasion, the cytosolic hyper-replication induces inflammation of the gut3, whereas vacuolar replication can lead to systemic spread4. Salmonella strains can vary in their ability to invade and replicate inside intestinal epithelial cells9. Indeed, Salmonella is an extremely diverse genus comprising more than 2,500 serovars, which have different abilities to cause disease. In addition, Salmonella is the most frequently reported cause of foodborne outbreaks in the European Union, indicating a large spread in the human population1. Therefore, the availability of reliable, high-throughput methods for the quantification of the intracellular phenotypes of Salmonella is of great importance to evaluate differences in virulence among large numbers of Salmonella strains and ultimately allow an accurate and strain-specific risk assessment of this pathogen.
The protocol described here measures the behavior of Salmonella inside epithelial cells in a fast and automated way. The infection of epithelial cells is performed in 96-well imaging microplates and an automated fluorescence microscope is used for image acquisition, making the protocol suitable for high-throughput applications. This protocol takes advantage of the pCHAR-Duo plasmid, which allows distinguishing vacuolar from cytosolic Salmonellae through the differential expression of two fluorescent reporters5. The intracellular phenotypes of Salmonella are often analyzed by manual scoring, a time-consuming procedure that is unsuitable for the analysis of large numbers of strains and cell cultures per strain and prone to operator's errors and inter-operator variation. To overcome these limitations, two complementary and automated image analyses were developed, the area analysis and the single-cell analysis. ImageJ, a freely available software, was used to develop the two analyses. In order to accelerate the protocol execution, ImageJ scripts for batch analysis of multiple acquisition files with no operator intervention are provided as supplemental files.
The area analysis was designed to quantify, in a few steps, the overall colonization of epithelial cells (infection ratio) and the hyper-replication level (hyper-replication ratio) through the measurement of the areas specifically occupied by the nuclei of epithelial cells and by Salmonellae expressing either mCherry or mCherry together with GFP. The area analysis is applied to images acquired at low magnification, where both vacuolar and hyper-replicating Salmonellae are in focus in the same z-plane, and a large number of epithelial cells is displayed per microscopic field, reducing the size and number of acquisition files. The area analysis allows for an automated, fast, and computationally-light analysis of large number of samples, making it suitable for high-throughput assays such as screening experiments.
The single-cell analysis was designed to quantify Salmonella phenotypes inside epithelial cells with single-cell resolution, obtained through cell segmentation and measurement of the cellular area and the percentage of area occupied by vacuolar and cytosolic hyper-replicating Salmonellae. The overall colonization of epithelial cells characterized through the area analysis is here broken down into three quantitative parameters, the percentage of infected cells, the mean vacuolar load, and the hyper-replication rate, allowing to evaluate and quantify the contribution of each phenotype to the overall colonization, therefore, complementing the results of area analysis. The greater details offered by the single-cell analysis come at the cost of slower image acquisition and analysis. In fact, in order to achieve single-cell resolution, image acquisition is performed at high magnification. This implies that multiple z-planes are needed to observe both vacuolar and cytosolic Salmonellae in focus and that the acquisition of a large number of fields per sample is needed to score a high number of epithelial cells, thus extending acquisition time in comparison with area analysis. Furthermore, the analysis of several large acquisition files is computationally demanding, thus requiring a suitable workstation (a 6-core, 32 GB RAM workstation was used). Therefore, single-cell analysis can be used as a stand-alone in limited throughput conditions or as a second-level method coupled to the area analysis to gain a deeper understanding of the Salmonella phenotypes inside epithelial cells.
The two complementary analyses were validated by using S. Tm, S. Derby wt, and S. Derby ΔsipA, chosen because their behavior inside epithelial cells was already known to differ in terms of invasion or replication9,10. The results of the area and single-cell analyses show that the protocol allowed to quantitatively distinguish differences in intracellular Salmonella phenotypes in accordance with the characteristics of the tested strains. Furthermore, these results demonstrate that the single-cell analysis allows for quantification of the contribution of each intracellular phenotype (invasion, vacuolar load and cytosolic replication) to the overall colonization scored using the area analysis.
This protocol was applied here to study in vitro pathogenicity of different strains of Salmonella, but it can have other applications such as the study of random mutants to identify genes involved in the invasion and/or replication inside epithelial cells. In addition, the protocol can be adapted to analyze the behavior of Salmonella inside other cell lines than INT407 cells. It can also be used as the starting point to develop similar methods for studying cell-pathogen interaction of other intracellular microorganisms.
Disclosures
The authors declare that they have no competing interests.
Acknowledgements
The authors would like to thank Dr. Olivia Steele-Mortimer for sharing pCHAR-Duo plasmid. This work was funded by the Italian Ministry of Health, grants PRC2019014 and PRC2021004.
Materials
| Name | Company | Catalog Number | Comments |
|---|---|---|---|
| 96-well imaging microplate | Eppendorf | 30741030 | Cell culture and infection |
| Ampicillin | Sigma-Aldrich | 59349 | Bacteria culture |
| Axio observer inverted microscope | ZEISS | Automated fluorescence microscope | |
| Axiocam 305 Mono | ZEISS | Microscope Camera | |
| Breathable sealing membrane | Sigma-Aldrich | Z380059 | Infection assay |
| Colibrì 5/7 | ZEISS | Led light source | |
| Collagen I rat tail | Life Technologies | A1048301 | Collagen coating |
| DAPI | Invitrogen | D3571 | Cell staining |
| Fetal bovine serum | Gibco | 10099-141 | Cell culture and infection |
| Gentamicin | Sigma-Aldrich | G12664 | Infection assay |
| Glacial acetic acid | Carlo Erba | 401391 | Collagen coating |
| HCS CellMask Blue | Invitrogen | H32720 | Cell staining |
| ImageJ | National Institutes of Health and the Laboratory for Optical and Computational Instrumentation (LOCI, University of Wisconsin) | Image processing software | |
| Minimum Essential Eagle's Medium | Sigma-Aldrich | M5650-500ML | Cell culture and infection |
| Paraformaldehyde 4% | Invitrogen | FB002 | Cell fixation |
| Potassium chloride | PanReac AppliChem | 131494.1211 | PBS preparation |
| Potassium phosphate monobasic | Sigma-Aldrich | 60220 | PBS preparation |
| Sodium Chloride | PanReac AppliChem | 131659.1214 | Bacteria culture and PBS preparation |
| Sodium phosphate Dibasic | Sigma-Aldrich | 71640 | PBS preparation |
| Tissue Culture Flask 25 cm2 plug seal screw cap | Euroclone | ET7025 | Cell culture |
| Triton X-100 | Biorad | 1610407 | Cell staining |
| Trypsin-EDTA (0.25%) | Gibco | 25200056 | Cell culture and infection |
| Tryptone | Oxoid | LP0042B | Bacteria culture |
| Yeast extract | Biolife | 4122202 | Bacteria culture |
References
- European Food Safety Authority & European Centre for Disease Prevention and Control. The European Union One Health 2020 Zoonoses Report. EFSA Journal. 19 (12), 6971(2021).
- Fattinger, S. A., Sellin, M. E., Hardt, W. D. Salmonella effector driven invasion of the gut epithelium: breaking in and setting the house on fire. Current Opinion in Microbiology. 64, 9-18 (2021).
- Knodler, L. A., et al. Dissemination of invasive Salmonella via bacterial-induced extrusion of mucosal epithelia. Proceedings of the National Academy of Sciences of the United States of America. 107 (41), 17733-17738 (2010).
- Fulde, M., et al. Salmonella SPI2 T3SS mediates transcytosis in polarized enterocytes in vivo. Cell Host & Microbe. , (2019).
- Cooper, K. G., Chong, A., Starr, T., Finn, C. E., Steele-Mortimer, O. Predictable, tunable protein production in Salmonella for studying host-pathogen interactions. Frontiers in Cellular and Infection Microbiology. 7, 475(2017).
- Klein, J. A., Grenz, J. R., Slauch, J. M., Knodler, L. A. Controlled activity of the Salmonella invasion-associated injectisome reveals its intracellular role in the cytosolic population. mBio. 8 (6), 01931(2017).
- Schneider, C. A., Rasband, W. S., Eliceiri, K. W. NIH Image to ImageJ: 25 years of image analysis. Nature Methods. 9 (7), 671-675 (2012).
- Ibarra, J. A., et al. Induction of Salmonella pathogenicity island 1 under different growth conditions can affect Salmonella-host cell interactions in vitro. Microbiology. 156 (4), 1120-1133 (2010).
- Tambassi, M., et al. Mutation of hilD in a Salmonella Derby lineage linked to swine adaptation and reduced risk to human health. Scientific Reports. 10 (1), 21539(2020).
- Finn, C. E., Chong, A., Cooper, K. G., Starr, T., Steele-Mortimer, O. A second wave of Salmonella T3SS1 activity prolongs the lifespan of infected epithelial cells. PLoS Pathogens. 13 (4), 1006354(2017).
- Knodler, L. A., Nair, V., Steele-Mortimer, O. Quantitative assessment of cytosolic Salmonella in epithelial cells. PLoS One. 9 (1), 84681(2014).
- Chong, A., Starr, T., Finn, C. E., Steele-Mortimer, O. A role for the Salmonella Type III Secretion System 1 in bacterial adaptation to the cytosol of epithelial cells. Molecular Microbiology. 112 (4), 1270-1283 (2019).
Reprints and Permissions
