A microdialysis profiler is described to sample dissolved porewater solutes across an oxic-anoxic soil-water interface in situ with minimal disturbance. This device is designed to capture rapid changes in concentration-depth profiles induced by disturbances at the soil-water interface and beyond.
Method Article
Dissolved Solute Sampling Across an Oxic-Anoxic Soil-Water Interface Using Microdialysis Profilers
In This Article
Summary
Abstract
Biogeochemical processes shift rapidly in both spatial (millimeter scale) and temporal (hour scale to day scale) dimensions at the oxic-anoxic interface in response to disturbances. Deciphering the rapid biogeochemical changes requires in situ, minimally invasive tools with high spatial and temporal sampling resolution. However, the available passive sampling devices are not very useful in many cases either due to their disposable nature or the complexity and extensive workload for sample preparation.
To address this problem, a microdialysis profiler with 33 individual polyethersulfone nanomembrane tubes (semipermeable, <20 nm pore size) integrated into the one-dimensional skeleton (60 mm) was established to iteratively sample the dissolved compounds in porewater across the soil-water interface at a high resolution of 1.8 mm (outer diameter plus one spacing, i.e., 0.1 mm between probes). The sampling mechanism is based on the principle of concentration gradient diffusion. The automatic loading of degassed water allows minimal disturbance to the chemical species across the oxic-anoxic interface.
This paper describes the procedures of device setup and continuous porewater sampling across the soil-water interface on a daily basis. Concentration-depth profiles were selectively measured before (on Day 6) and after (on Day 7) disturbances induced by irrigation. The results showed that concentration-depth profiles were undergoing rapid changes, especially for redox-sensitive elements (i.e., iron and arsenic). These protocols can help investigate the biogeochemical responses across the soil-water interface under various disturbances caused by physical, chemical, and biological factors. The paper thoroughly discusses the advantages and disadvantages of this method for potential use in the environmental sciences.
Introduction
An oxic-anoxic interface is one general feature in the biosphere that is vital for the biogeochemical cycle1. This interface is highly heterogeneous, with the spatial range extending from millimeters in the sediment/soil-water interface1,2 to thousands of meters in the oceanic anoxic zone3,4. This interface is an ideal habitat for studying the complexity of elemental biogeochemistry.
Soil-water interfaces have a typical oxic-anoxic gradient feature within centimeters and are easily established in mesocosm experiments. Starting from the consumption of molecular oxygen from surface water, the stratified functional microbial communities drive the development of various gradients, such as O2, pH, and Eh gradients, at the millimeter scale1. Biogeochemical cycling at the oxic-anoxic interface is sensitive to various disturbances in nature5,6. In the case of sediments and paddy fields, the input of fresh organic matter such as litter and straw, periodic flooding and drainage, temperature fluctuations and extremes, and bioturbation can cause changes in the biogeochemical cycle at the oxic-anoxic interface, likely resulting in lasting impacts, such as greenhouse gas emissions, eutrophication, and contamination at a given location. Therefore, the oxic-anoxic gradient at the soil-water interface provides a window for the study of global, large-scale, biogeochemical cycles. The spatiotemporal sampling and analysis of dissolved substances along the soil-water interface in high resolution have always been of interest; however, there has been limited progress in the methodology.
Circumventing the drawbacks of destructive porewater extraction, non-destructive passive sampling is increasingly used to avoid changes in porewater chemistry and address the complexity of sample preparation7. Several devices that can perform high-precision, in situ sampling (from the micrometer to centimeter scale) have been widely used, including in situ dialysis samplers (known as peepers)8, diffusive equilibration in thin films (DET)9, and diffusive gradient in thin films (DGT)10. Dissolved substances are passively sampled via the mechanism of diffusion and adsorption processes. Although they have proven useful in describing oxic-anoxic chemical profiles, they are still single-use, which limits their broader application.
Recently, the microdialysis technique has emerged as a sensitive tool that can be used to monitor soluble compound dynamics in soil on temporal scales of minutes to days11,12,13,14. For a typical scenario using microdialysis in medical and environmental sciences, a miniature, concentric-type probe consisting of a semipermeable tubular membrane (i.e., a microdialyzer) is used to probe the interstitial fluid or soil solutions to prevent significant disturbances on, metabolic processes and chemical speciation15,16. One of the greatest inherent advantages of microdialysis is the in situ capture of time-dependent concentration changes in soil or biological tissues15,16.
Based on the microdialysis concept, we developed a more easy-to-use microdialysis profiler, previously called the integrated porewater injection (IPI) profiler, that can perform continuous equilibrium dialysis of porewater solutes based on the principle of concentration gradient diffusion2. The microdialysis device uses hollow nanomembrane tubes for active preloading of the perfusate and passive diffusion of the dissolved solutes, which is different from the bulk porewater diffusion used in peepers, pressure filters such as the Rhizon sampler, and accumulation-based DGT. The device has been tested and validated in the temporal and spatial sampling of both cationic and anionic elements in both highland and flooded soils (Figure 1A-1)13,15,16. Simple pump in-and-out microdialysis minimizes the number of steps in sample preparation2,15.
We fabricated a microdialysis profiler by integrating a set of samplers onto a one-dimensional support skeleton, and this profiler achieved high-resolution sampling at the soil-water interface and rhizosphere2,15,17. In this study, considerable modifications of the sampling device and sampling method were made to allow the collection of 33 pore water samples at the soil-water interface (60 mm vertical depth) with minimal disturbance for downstream elemental analysis. The whole sampling procedure takes ~15 min. Since the microdialysis profiler is new to the community of environmental science, we present details of the device components and sampling procedures to indicate the potential of microdialysis in monitoring the changes in chemical signals at the soil-water interface.
Description of the microdialysis profiler
The microdialysis profiler device, with proper modifications of the previous design2, is shown in Figure 1. The effective pore size of the nanomembrane (Figure 1C-1) is estimated to be only several nanometers to prevent the diffusion of large molecules and microbial cells. A previous test suggested that a 6 month flooded incubation did not result in any iron deposits on either the inside or the outside of the tube surface15. A curved, hollow skeleton was designed (Figure 1C-2) and 3D-printed using a stable nylon material. A total of 33 nanomembrane tubes (polyethersulfone; surface pore size: 0-20 nm; inner diameter x outer diameter x effective sampling length: 1.0 mm x 1.7 mm x 54 mm; theoretical volume: 42.4 µL) connected with matched polytetrafluoroethylene (PTFE) pipes (length: 18 cm x 2 cm diameter Figure 1C-1) were installed on the skeleton and across one side of a PVC container (Figure 1B). For this device, the sampling component (Figure 1B-1) is 2 cm away from the side wall of the PVC container. For the injection side (Figure 1B-4), all tubes were connected to a one-to-many connector, which was fixed into a buffering container in an airtight manner (Figure 1B-7). A medical infusion bag (Figure 1B-11) was used to connect with the buffering container by a three-way valve. The airtightness of the system was carefully examined in water before further experimental operations. The preloaded water (18.2 MΩ, 500 mL) in the medical infusion bag is always oxygen-free (Figure 1C-8). Detailed device setup and porewater sampling are described as follows.
Protocol
1. Individual microdialysis sampler preparation
- Accurately cut pristine nanomembrane tubes (inner diameter x outer diameter x length: 1.0 mm x 1.7 mm) into a total of 33 short tubes (58 mm in length).
- Accurately cut the PTFE pipe into 66 pipes (180 mm in length) with a ceramic knife.
NOTE: Do not use any metal-based knives to avoid any contamination. - Fully mix the two-part (AB) epoxy adhesive on any clean plastic plate, and let it stand for 30 min until it becomes sticky. Apply the AB epoxy adhesive carefully to the outer surface of the top of the PTFE pipe. Ensure that AB epoxy adhesive only covers the 4 mm length of the tube and that there are no additional adhesive blocking tubes.
- Connect the two PTFE pipes prepared in steps 1.2-1.4 with each nanomembrane tube prepared in step 1.1 by gently screwing the PTFE pipes into the nanomembrane tube.
NOTE: Do not allow excess adhesive to accumulate on the joint. Make sure that no adhesive contaminates the nanomembrane tube. - Repeat step 1.4 to fully assemble all 33 pristine microdialysis samplers.
- Let the samplers assembled in step 1.6 stand overnight to ensure the complete curing and stabilization of the adhesive.
- Enhance the hydrophilicity and clean the microdialysis samplers by soaking them in ethanol (99.5% purity) for 1 h, followed by ultrasonic cleaning (room temperature) with 2% diluted HNO3 and ultrapure water for 15 min each.
- Check the patency and airtightness of the microdialysis sampler by bubbling in water using a 5 mL syringe.
2. Assembly of the microdialysis profiler
- Use the attached CAD file (Supplemental File 1) to print out the predesigned skeleton using nylon material (Figure 1C-2).
- Hollow out a PVC container (acid-washed) with two parallel slots (5 cm interval) to match the skeleton size. Use the engraving module in the 3D printer for slotting.
- Construct a one-to-many connector by stabilizing epoxy adhesive in the shape of the cap of a 50 mL centrifuge tube. Insert 33 silicon caps (1 cm in length) into the epoxy adhesive before curing, and let stand overnight.
- Take out the one-to-many connector from the tube cap.
- Use a ceramic knife to cut the cured epoxy adhesive so that all the silicon cap ends are unobstructed.
- Rinse the one-to-many connector thoroughly with 2% diluted HNO3 and ultrapure water for 15 min each. Dry the one-to-many connector under ambient conditions.
- Connect a three-way valve to the bottom of the tube to serve as a buffering container.
- Assemble the buffering container by installing a one-to-many connector to a 50 mL centrifuge tube using AB epoxy adhesive.
- Assemble the individual microdialysis samplers prepared in section 1 on the skeleton (step 2.1). In this step, use hot melt adhesive to aid in fixing so that each sampler is parallel to the top/bottom edge of the skeleton.
- Repeat step 2.9 until all the microdialysis samplers (n = 33) are installed on the skeleton.
- Make sure that the 33 samplers on both sides of the skeleton pass through the PVC slots. Seal the gaps at the joints of the skeleton and the slots with AB epoxy adhesive.
- Connect the 33 samplers on one side of the skeleton to a buffering container in an airtight manner via a one-to-many connection valve preinstalled into a 50 mL centrifuge tube (step 2.8)
- Connect a medical infusion bag prefilled with water (18.3 MΩ) to the buffer container through the three-way valve.
- Use silicon caps to close the 33 samplers on the sampling side. Double-check the patency and airtightness of each microdialysis sampler by turning the three-way valve, allowing water to flow from the medical infusion bag to the sampler. After completing all the checks, close and turn off all the samplers and the valve on the buffering container.
3. Soil incubation
- Before the incubation of flooded soil, degas the water in the medical infusion bag to remove oxygen. Bubble nitrogen gas overnight in the pathway of the line of high-purity nitrogen gas to the medical infusion bag (Figure 1-C8).
- Use a three-way valve to close the connection between the profiler and the degassed bag.
- Carefully add 450 g of sieved, air-dried soil (particle size < 2 mm) into a PVC container, allowing five microdialysis samplers to remain above the soil surface.
- Use a tissue to cover the soil surface, and then pour ultrapure water (18.3 MΩ) onto the soil to flood it. Remove the tissue when the soil is fully flooded by 5 cm above the soil surface.
- Purge the system with the preloaded solution immediately once soil incubation has been initialized. Turn on the connection between the anaerobic bag and the dialysis sampler to flush the sampling system. Use 10-fold the total volume of the sampler when purging each sampler with water.
- When finishing the purging of one sampler, cap it using a clean silicon cap.
- Repeat step 3.6 until all the samplers have been purged. At this time, one flooded soil incubation and sampling system are established.
- Adjust the anaerobic bag to the height of the water surface.
- Make sure all the tubes are full of water. If not, remove the cap, and lower the tube top, allowing the water to flow out from the anaerobic bag.
- Close all the caps and valves.
- Turn off the connection between the anaerobic bag and the dialysis sampler during the incubation for 7 days.
4. Microdialysis profiler sampling
- Before sampling, adjust the water levels in the soil container, the sampling tops, and the anaerobic bag to a similar height to avoid markedly different water potentials. Always maintain this practice over the period of soil incubation.
- Turn on the connection between the anaerobic bag and the buffer container.
- Remove the cap of the first sampler from top to bottom.
- Use a pipette to accurately aspirate 133 µL from the sampler to a vial (0.6 mL) that is preloaded with 133 µL of 2% HNO3 for preservation.
- During the sampling process, observe a slow but uniform flow of water droplets toward the microdialysis sampler in the observation chamber (Figure 1A-9) of the anaerobic bag.
- Close the tube top with a silicon cap. Move to the next sampling tube.
NOTE: For the analysis of redox-sensitive elements such as ferrous Fe, a different preservation method such as degassed (10 mM) EDTA solution must be used, and the sampling should be performed under nitrogen purge conditions. - Repeat step 4.6 until all 33 samples have been collected. Turn off the connection between the anaerobic bag and the buffer container.
NOTE: The sampling can generally be finished in 15 min. With the current design, the sampling is carried out on a daily basis to avoid cross-contamination between tubes. Although the solute diffusion along the tube is slow, it would diffuse into the buffer container and contaminate other tubes. - Immediately after the sampling on Day 6, replenish the flooded water, which will cause a disturbance on the soil surface.
- Calculate the sample volume recovery by weighing the sample vial before and after the porewater sample is transferred.
- Use inductively coupled plasma mass spectrometry (ICP-MS) to measure the total dissolved concentrations of elements in the porewater.
NOTE: An external standard curve was used for the concentration quantification, while the internal standard Rh was used for monitoring the ICP-MS operational stability.
Results
Following this protocol, a microdialysis profiler system was established, as described in Figure 1. Soil incubation was performed under flooding conditions (24 °C, uncovered from light). Samples on Day 6 and Day 7 were selectively measured to indicate potential disturbance on the soil surface due to the practice of replenishing the flooded water.
During each sampling, a consistent number of water droplets in the observation chamber flowing toward the microdialysis sampler was observed, indicating that the transferred sample solution was continuously replenished by the solution in the anaerobic bag. As shown in Figure 2, the recovery percentage of the sample volume averaged 101.4% ± 0.9% and ranged from 100.2% to 103.6%. A slightly higher recovery of the sample volume might indicate that there was a water level difference between the anaerobic bag and the top of the sampling tube.
Using the samples across the soil-water interface collected on Day 6 and Day 7, the total dissolved concentrations of iron (Fe), manganese (Mn), arsenic (As), cadmium (Cd), copper (Cu), lead (Pb), nickel (Ni), and zinc (Zn) in the porewater were determined (Figure 3). The concentration-depth profiles varied greatly depending on the elemental type and before and after the practice of replenishing the flooded water. Although we did not perform replications here since this study used a gradient-based experimental design, our previous study demonstrated good replications of changes in depth-dependent chemical signals18.
On Day 6, the dissolved concentrations of Mn, Fe, and As increased along with the soil depth, whereas those of Cu and Pb decreased with increasing soil depth. The results are consistent with the general principles and observations in soil-water interfaces; specifically, a more reduced environment in deeper soil would cause an enhanced reductive release of Mn15, Fe, and As while inhibiting the release of cationic metals due to the formation of less soluble minerals. However, for Cd, Ni, and Zn, the concentration-depth profiles indicated a different pattern, since the dissolved concentrations had an increasing trend from a depth of around −20 mm to deeper locations.
Compared to the concentration-depth profiles of Fe (4.95 mg·L−1) and As (3.3 µg·L−1) at the depth of −12 mm on Day 6, the concentrations of Fe (1.46 mg·L−1) and As (0.8 µg·L−1) were significantly lower on Day 7; however, the Fe and As concentrations were significantly higher (depth-dependent slope, p < 0.001) from the depths of −18 mm to −50 mm. For most elements determined, except Mn, the dissolved concentrations in the surface water and the even surface soil at the depth of −15 mm were significantly lower, to varying degrees, after aerobic water replenishment. It was noted that there was a concentration peak for Pb at the depth of approximately −10 mm on Day 7, showing a contrasting pattern to that observed on Day 6. These inconsistent results are likely caused by the disturbance of water replenishment and the temporal evolution of biogeochemistry across the soil-water interface. In either case, the microdialysis profiler indicated its great potential to monitor the temporospatial changes in chemical profiles across the soil-water interface.
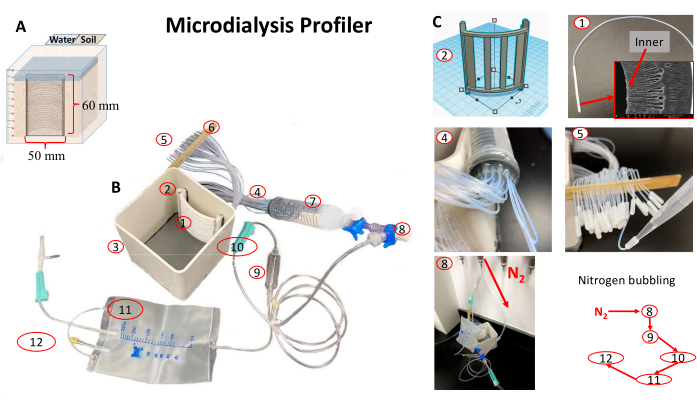
Figure 1: Microdialysis profiler setup for monitoring chemical dynamics at soil-water interfaces to the soil depth of 50 mm. (A) For a profiler in use at 50 mm depth, seealso Supplementary Figure S1. The main components include (B1,C1) 33 microdialysis samplers (B2,C2) installed on a 3D-printed skeleton, which is further installed on a (B3) incubation container (a 50 mL sample tube), (B4,B7,C4) a one-to-many buffering container, (B9-B12) a medical infusion bag used as the supplier of degassed water, and an (C5) offline sampling pipette. (B5) The sampling locations of all 33 samplers are aligned to the same height with (B6) a plastic strip. Deoxygenated water is prepared by (C8) nitrogen bubbling in a reverse direction to the water supply. Please click here to view a larger version of this figure.
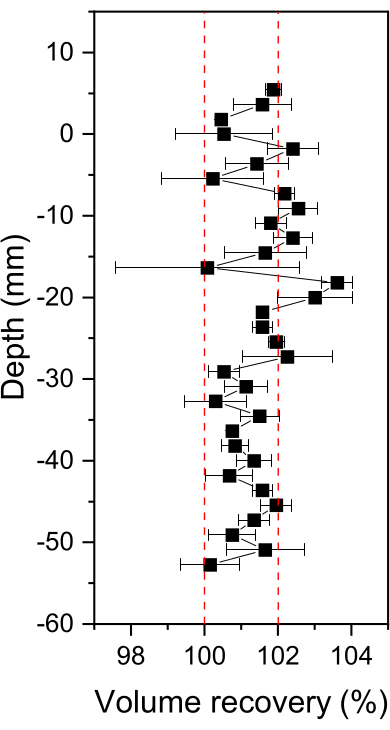
Figure 2: Sampling volume recovery using H2O as the perfusate. The error bars denote the standard deviation of two independent profiler samplings. Please click here to view a larger version of this figure.

Figure 3: Concentration-depth profiles. (A) Manganese, (B) iron, (C) arsenic, (D) cadmium, (E) copper, (F) lead, (G) nickel, and (H) zinc measured on Day 6 and Day 7. The negative tick labels on the Y-axis indicate the depths below the water-soil boundary. Please click here to view a larger version of this figure.
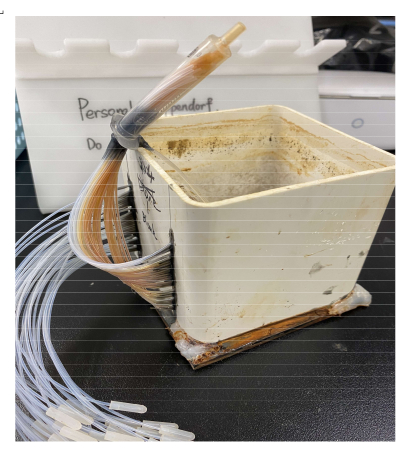
Figure 4: Failure case of leakage resulting in iron precipitation inside the samplers. Please click here to view a larger version of this figure.
Supplementary File 1: Computer-assisted design file for a printout of the predesigned skeleton. Please click here to download this File.
Supplementary Figure S1: The profiler in use. (A) On flooded soil. (B-E) Photos of top and side views and connection details are presented separately. (E) Three-way valves are used to connect the buffer container and the medical infusion bag. Please click here to download this File.
Discussion
Based on previous experiments and practices2, some considerations require special attention during the microdialysis profiler assembly and porewater sampling. First, the nanomembrane tube and the connecting tube should be carefully connected to avoid blockages or leakages at the connection. As the soil is incubated under flooded conditions, the introduction of oxygen will rapidly oxidize and precipitate ferrous iron in the dialysis tubing (Figure 4). For this reason, before assembling the microdialysis profiler, each microdialysis tube must be checked for integrity (no damage), the airtightness of the connections, and the patency of the tubing. Similarly, the connection of the support frame to the side wall of the incubation container needs to be done carefully to avoid leakage. Prior to formal experiments, leakage checks at the various connection locations are always a priority. Second, the perfusate in the anaerobic bag must be adequately deoxygenated. Otherwise, ferrous iron in porewater will react with the oxygen in the perfusate to form insoluble precipitates (Figure 4). This will severely alter the solute speciation and concentration and the diffusion processes toward the nanomembrane tubes. Third, a low sampling frequency (days and weeks) will cause the solute to diffuse into the buffer region. This may contaminate the entire profile sample. To address this problem, three possible solutions can be considered: (1) sampling at a high frequency, such as once a day (however, this may lead to solute depletion near the dialysis sampler when multiple samplings are performed); (2) extending the length of the connecting pipe in the injection area as required; (3) redesigning the sampling pipeline to achieve single control of a single pipeline. These are also directions for the improvement of the device in the future. Fourth, during the sampling process, it must be ensured that the level of the water surface in the anaerobic bag, the flooded soil, and the sampling pipe are approximately at the same height to balance the water pressure. Otherwise, a water potential difference inside and outside the membrane tube will result in a decrease or increase in solute diffusion.
Limitations
First, since the microdialysis profiler is not commercially available, the method remains time-consuming in terms of the preparation of the device. It took days to prepare a single dialysis tube, including printing the support skeleton, device assembly, and cleaning. But the subsequent reusable features completely bridge this gap. Second, there are certain limitations in applying the device to non-flooded soil scenarios, which peepers can be used for18. Due to the significant water potential difference between the inside and outside of the membrane tube in dry soil, the preloaded solution experiences diffusion loss; indeed, various sampling volume recoveries in the range of 10%-36% were observed in the preliminary test (detailed data not shown), which creates uncertainty about the results.
Comparison of the method to existing or alternative methods
The method partially addresses the fact that the existing passive samplers cannot sample repeatedly and minimizes the workload of sample preparation, especially for anoxic porewater sampling and preservation2. The instant changes in concentration and speciation of dialyzed solutes can sensitively reflect the response of the oxic-anoxic interface to any environmental disturbances. Theoretically, sampling at a frequency of minutes, hours, or days allows for the capture of the rapidly changing processes at the interface. For passive samplers that need to be in deployment for days, some hot moments and hotspots can be missed6,19.
Importance and potential applications in the environmental sciences
This approach could advance biogeochemistry studies at oxic-anoxic interfaces, for instance, to find hot moments and hotspots of biogeochemical processes under specific Eh-pH conditions. The redox process is the basic process of life activities1. Microorganisms, especially, require optimal living environment conditions and are very sensitive to environmental disturbances1. This results in a highly dynamic development of microbial communities and biogeochemical processes in heterogeneous environments20. Direct sampling, without considering the high heterogeneity, tends to obtain a mixed sample from various environmental conditions. This causes mismatches between the measured chemical information and key microorganisms20. Within a few centimeters of the surface layer of soil or sediment in a typical flooded paddy field, there are steep redox gradients, as well as various physical, chemical21, and biological gradients1. Technology must be able to capture millimeter-scale biogeochemical signals; otherwise, data that do not match the actual scale may lead to ambiguous conclusions. The microdialysis profiler is capable of monitoring millimeter-scale biochemical signals at the soil-water interface in days or hours with minimal disturbance. In this study, the spatiotemporal dynamics of different elements over a 48 h period were observed, possibly related to the disturbance of water replenishment. Therefore, a broader application of the microdialysis profiler may help to understand how disturbances affect key biogeochemical processes in a changing world.
Disclosures
The authors declare no conflicts of interest.
Acknowledgements
This work is funded by the National Natural Science Foundation of China (41977320, 41571305) and the Key Programme Special Fund of XJTLU (KSF-A-20).
Materials
| Name | Company | Catalog Number | Comments |
|---|---|---|---|
| 3D Printer | Snapmaker, United States | Snapmaker 2.0 | Model: A250 |
| 3M DP190 Scotch-Weld Gray | 3M United States | 489-483 | Gray |
| Centrifuge tube | Titan, China | SWLX-JZ050-ZX | 50 mL, Sterilized DNASE/RNASE/Protease/Pyrogen Free |
| Ceramic knife | R felngli, China | N.A. | General |
| EDTA FREE ACID | Sigma-Aldrich | CAS 60-00-4 | Sigma-Aldrich#EDS-1KG |
| Ethanol | Adamas | CAS 64-17-5 | Water ≤ 50 ppm (by K.F.), 99.5%, SafeDry, with molecular sieves, Safeseal |
| Hot melt adhesive | Magic Dragon, China | N.A. | JTWJRRJB001 |
| Inductively Coupled Plasma Mass Spectrometry | PerkinElmer, Inc., Shelton, CT USA | N.A. | Model: NexION 350X |
| Medical Infusion Bag | Hunan Kanglilai Medical Equipment Co., Ltd | N.A. | 250 Ml, Sterlized |
| Milli-Q water system | Mingche, Inc., China | N.A. | 18.3 MΩ, water purification system model: 24UV |
| Nanomembrane Tube (polyethersulfone) | Motimo Membrane Technology Co., Ltd., Tianjin, China | N.A. | Polyethersulfone, inner diameter 1 mm, poresize <20 nm, pretreated with ethanol (99.5%) |
| Nitrogen gas | Suzhou Gas, Chuina | N.A. | High puriety |
| Nitrotic acid (Concentrated) | Adamas | CAS 7697-37-2 | 69%,Single Metal < 50 ppt, PFA Bottle |
| Nylon Fiber | Soumiety | 10052076600273 | For 3D-printing |
| Pipette | Bond A3 Pipette | N.A. | 200 μL |
| Pipette Tip | Titan | T2-H-T0200 | 200 μL, 300 μL Tip Box Non-sterile|200 μL|Titan |
| Polytetrafluoroethylene Tube | ROHS, China | CJ-TTL | Out diameter 1 mm |
| Sample vial | Titan, China | EP0060-B-N | 0.6 mL, Sterilized DNASE/RNASE/Protease/Pyrogen Free |
| Silicon cap | Fuchenxiangsu, China | N.A. | Inner diameter 1 mm, length 1 cm |
| Sonicator | Elma | N.A. | model:E120H |
| Square PVC water pipe | Taobao.com | N.A. | hight x width, 12 cm x 15 cm |
| Three-way valve for infusion | OEM, China | N.A. | Medical level; Valve body: PC material; valve core: PE material; screw cap: ABS material |
References
- Brune, A., Frenzel, P., Cypionka, H. Life at the oxic-anoxic interface: Microbial activities and adaptations. FEMS Microbiology Reviews. 24 (5), 691-710 (2000).
- Yuan, Z. -F., et al. Tracing the dynamic changes of element profiles by novel soil porewater samplers with ultralow disturbance to soil-water interface. Environmental Science & Technology. 53 (9), 5124-5132 (2019).
- Henkel, S., et al. Diagenetic barium cycling in Black Sea sediments - A case study for anoxic marine environments. Geochimica et Cosmochimica Acta. 88, 88-105 (2012).
- Zhong, H., et al. Novel insights into the Thaumarchaeota in the deepest oceans: Their metabolism and potential adaptation mechanisms. Microbiome. 8 (1), 78(2020).
- Lueder, U., et al. Influence of physical perturbation on Fe(II) supply in coastal marine sediments. Environmental Science & Technology. 54 (6), 3209-3218 (2020).
- Sharma, N., Wang, Z., Catalano, J. G., Giammar, D. E. Dynamic responses of trace metal bioaccessibility to fluctuating redox conditions in wetland soils and stream sediments. ACS Earth and Space Chemistry. 6 (5), 1331-1344 (2022).
- Vrana, B., et al. Passive sampling techniques for monitoring pollutants in water. TrAC Trends in Analytical Chemistry. 24 (10), 845-868 (2005).
- VanOploo, P., White, I., Macdonald, B. C. T., Ford, P., Melville, M. D. The use of peepers to sample pore water in acid sulphate soils. European Journal of Soil Science. 59 (4), 762-770 (2008).
- Harper, M. P., Davison, W., Tych, W. Temporal, spatial, and resolution constraints for in situ sampling devices using diffusional equilibration: Dialysis and DET. Environmental Science & Technology. 31 (11), 3110-3119 (1997).
- Harper, M. P., Davison, W., Tych, W. Estimation of pore water concentrations from DGT profiles: a modelling approach. Aquatic Geochemistry. 5 (4), 337-355 (1999).
- Gao, S., DeLuca, T. H. Use of microdialysis to assess short-term soil soluble N dynamics with biochar additions. Soil Biology and Biochemistry. 136, 107512(2019).
- Buckley, S., Brackin, R., Jämtgård, S., Näsholm, T., Schmidt, S. Microdialysis in soil environments: Current practice and future perspectives. Soil Biology and Biochemistry. 143, 107743(2020).
- Miró, M., Jimoh, M., Frenzel, W. A novel dynamic approach for automatic microsampling and continuous monitoring of metal ion release from soils exploiting a dedicated flow-through microdialyser. Analytical and Bioanalytical Chemistry. 382 (2), 396-404 (2005).
- Maddala, S., Savin, M. C., Stenken, J. A., Wood, L. S. Nitrogen dynamics: Quantifying and differentiating fluxes in a riparian wetland soil. ACS Earth and Space Chemistry. 5 (5), 1254-1264 (2021).
- Yuan, Z. -F., et al. Simultaneous measurement of aqueous redox-sensitive elements and their species across the soil-water interface. Journal of Environmental Sciences. 102, 1-10 (2021).
- Hamilton, E. M., Young, S. D., Bailey, E. H., Humphrey, O. S., Watts, M. J. Online microdialysis-high-performance liquid chromatography-inductively coupled plasma mass spectrometry (MD-HPLC-ICP-MS) as a novel tool for sampling hexavalent chromium in soil solution. Environmental Science & Technology. 55 (4), 2422-2429 (2021).
- Yuan, Z. -F., et al. Distinct and dynamic distributions of multiple elements and their species in the rice rhizosphere. Plant and Soil. 471 (1), 47-60 (2022).
- Teasdale, P. R., Batley, G. E., Apte, S. C., Webster, I. T. Pore water sampling with sediment peepers. TrAC Trends in Analytical Chemistry. 14 (6), 250-256 (1995).
- Wey, H., Hunkeler, D., Bischoff, W. -A., Bünemann, E. K. Field-scale monitoring of nitrate leaching in agriculture: assessment of three methods. Environmental Monitoring and Assessment. 194 (1), (2021).
- Cai, Y. -J., et al. Microbial community structure is stratified at the millimeter-scale across the soil-water interface. ISME Communications. 2 (1), 53(2022).
- Jones, M. E., et al. Manganese-driven carbon oxidation at oxic-anoxic interfaces. Environmental Science & Technology. 52 (21), 12349-12357 (2018).
Reprints and Permissions
