

Summary
The present protocol describes the implantation and evaluation of melanoma in the murine choroid utilizing optical coherence tomography.
Abstract
Establishing experimental choroidal melanoma models is challenging in terms of the ability to induce tumors at the correct localization. In addition, difficulties in observing posterior choroidal melanoma in vivo limit tumor location and growth evaluation in real-time. The approach described here optimizes techniques for establishing choroidal melanoma in mice via a multi-step sub-choroidal B16LS9 cell injection procedure. To enable precision in injecting into the small dimensions of the mouse uvea, the complete procedure is performed under a microscope. First, a conjunctival peritomy is formed in the dorsal-temporal area of the eye. Then, a tract into the sub-choroidal space is created by inserting a needle through the exposed sclera. This is followed by the insertion of a blunt needle into the tract and the injection of melanoma cells into the choroid. Immediately after injection, noninvasive optical coherence tomography (OCT) imaging is utilized to determine tumor location and progress. Retinal detachment is evaluated as a predictor of tumor site and size. The presented method enables the reproducible induction of choroid-localized melanoma in mice and the live imaging of tumor growth evaluation. As such, it provides a valuable tool for studying intraocular tumors.
Introduction
Uveal melanoma (UM) is the most frequent intraocular primary malignancy in adults. Approximately 90% of ocular melanomas originate from melanocytes in the choroid region of the uveal tract1. UM is a major cause of morbidity and mortality, as it is estimated that close to 50% of patients develop metastatic disease, with the liver being the major site of metastasis2. Early treatment of primary lesions may reduce the chance of metastases, yet no effective treatment prevents metastases formation3.
The standard treatment of uveal melanoma includes irradiation therapy, which is associated with loss of vision due to optic neuropathy, retinopathy, dry eye syndrome, and cataract. Surgical resection is typically delayed until the growth of the lesion is recognized and characterized. However, such a delay may allow metastatic disease development4. In some cases, futile enucleation is required. Of course, this radical procedure compromises vision and results in dramatic aesthetic deterioration.
There have been many efforts dedicated to developing experimental models to study uveal melanoma. Preclinical animal models that allow accurate assessment of this malignancy are key for investigating novel diagnostic and therapeutic strategies for uveal melanoma. Experimental animal models of ocular melanoma are mainly based on the inoculation of tumor cells in mice, rats, and rabbits5,6. Mouse models are cost-effective and widely used for melanoma studies due to their rapid reproduction rate and high genome similarity to humans. The murine cutaneous melanoma cell line B16 is commonly utilized to inoculate C57BL6 mice and induce syngeneic tumors. When using this model to induce uveal melanoma, tumor-bearing eyes typically need to be enucleated 7-14 days after inoculation. Further, B16 is a highly invasive model. The immune-privileged nature of the eye supports metastasis, and metastases may typically be detected 3-4 weeks after tumor cell inoculation. Subcultures of the original B16 line display distinct metastatic properties6. For example, the Queens melanoma line has a high metastatic rate7,8. The B16LS9 cell line has dendritic cell morphology and was derived from liver metastases of C57BL/6 mice injected with the parental cutaneous melanoma line B16F19. When injected into the posterior compartment of the eye, these cells were shown to form intraocular tumors, which histologically resemble human uveal melanoma and form liver-specific metastases in C57BL/6, but not Balb/C, mice10,11,12. Genetically, the cells are characterized by higher expression of the c-met proto-oncogene, which acts as a cellular receptor for hepatocyte growth factor13. In contrast, B16F10, the 10th passage of the parental B16, primarily metastasizes to the lungs when inoculated intraocularly14. Both B16F10 and B16LS9 are pigmented12.
Several key challenges limit the success of murine uveal melanoma models. First, tumor cell reflux may lead to extraocular or subconjunctival melanoma. Second, tumor growth after intraocular inoculation of melanoma cells is often highly variable, posing difficulties in evaluating treatment and progress. Another major difficulty is the limited ability to follow tumor growth in vivo. While bioluminescent imaging, such as of luciferase expressing tumors, is commonly used to monitor ocular tumor growth15,16, it cannot provide information on the intraocular location of the tumor. Therefore, evaluation of the tumor is typically performed following enucleation of the eye10,17. This greatly limits the ability to characterize tumor progression and response to treatments extensively. Another major hurdle in studying uveal melanoma is the difficulty in monitoring lesions in pigmented mice. New approaches, which overcome these difficulties, are required to promote the research of uveal melanoma in animal models.
Optical coherence tomography (OCT) provides distinctive capabilities to image deep into the different sections of the eye in high resolution, which is unparalleled by other methodologies, including ultrasound18,19. OCT imaging has been used in animal models to study various ocular diseases20. Recently, OCT imaging was demonstrated as noninvasive means to evaluate intraocular tumor growth21. The protocol described here depicts the implantation of melanoma cells in the murine choroid and the utilization of OCT to predict intraocular tumor localization and size at the time of cell inoculation.
Subscription Required. Please recommend JoVE to your librarian.
Protocol
The experiments in the protocol were approved by the Israeli National Council on Animal Experimentation and comply with the ARVO Statement for using Animals in Ophthalmic and Vision Research. Female C57BL/6 mice, aged 8-10 weeks, were used for the present study and were exposed to 12/12 h light-dark cycles. The animals were obtained from a commercial source (see Table of Materials).
1. Cell culture
- Culture B16LS9 cells in RPMI 1640 medium, supplemented with 10% fetal bovine serum, 2 mM L-glutamine, 1 mM sodium pyruvate, 25 mM HEPES, 1% essential vitamin mixture, 200 U/mL penicillin, and 200 mg/mL streptomycin (see Table of Materials), in a humidified 37 °C incubator with 5% CO2.
- Harvest the cells for injection at 70%-80% confluence.
2. Animal preparation
- Prepare an anesthetic mixture of ketamine (75 mg/kg body weight) and medetomidine (0.5 mg/kg body weight). Anesthetize the mice by injecting the anesthetic mixture intraperitoneally in a single injection.
- Apply topical ophthalmic anesthetic oxybuprocaine (0.4%) to both eyes.
- Dilate the mouse pupils by topically applying tropicamide (0.5%).
3. Creating a conjunctival peritomy and scleral tract into sub-choroidal space
- Apply 1.4% hydroxyethylcellulose (see Table of Materials) as a lubricant to both eyes to avoid drying. Apply 0.5% tropicamide to the right eye.
- Observe the operated eye of the mouse under an operating microscope (see Table of Materials). Hold the eyelids open with sterile intraocular forceps.
- Using intraocular forceps, hold the supero-temporal limbal conjunctiva and pull toward an infra-nasal position22. Secure this position by holding it throughout the whole procedure (Figure 1A).
- Using a 30 G needle tip, make a small (1-2 mm) conjunctival peritomy in the dorsal-temporal area, approximately 1-2 mm posterior to the limbus.
NOTE: Using finer needles can prevent excessive puncture and allow better precision of tumor location. - Remove excess Tenon's capsule from the opening of the peritomy.
NOTE: Tenon's capsule is a layer of dense connective tissue that surrounds the globe of the eye22. - In this location, insert the needle tip to penetrate through the sclera. Make an excision to create a tract into the sub-choroidal space until the brown color of the choroid appears through the exposed white matter of the sclera (Figure 1B).

Figure 1: Tumor cell inoculation. (A) The supero-temporal limbal conjunctiva is held using intraocular forceps and pulled toward an infra-nasal position. (B) The tip of a 30 G needle is inserted to penetrate through the sclera, and excision is made to create a track into the sub-choroidal space. (C) A syringe loaded with cells and mounted with a 32 G needle is inserted into the track, and the cells are injected. Please click here to view a larger version of this figure.
4. Inoculation of melanoma cells
- Resuspend 70,000 B16LS9 cells in 2 µL of PBS. This amount is estimated per eye.
- Load the cells into a sterile 10 µL glass Hamilton syringe (see Table of Materials) mounted with a 32 G blunt needle twisted at a 45° angle.
- Insert the loaded syringe needle approximately 2 mm into the track created in step 3.
- Inject 2 µL of cell suspension.
- Hold the needle in place after injection for 2-3 s until all fluid has cleared.
- Remove the needle by pulling it out gently and slowly to avoid leakage from the track (Figure 1C).
NOTES: Adjusting the speed and force of injection can affect the pattern of tumor development. It is suggested that these parameters be calibrated by individuals experimenting to identify the right force and speed applied. A total of 70,000 cells was determined in preliminary experiments. However, as there may be variations in cell culture types or batches or between mouse strains, calibration of this number is necessary.
5. Assessing the location of the injection
- Observe the injected eye by OCT scans immediately after melanoma cell inoculation to identify the appearance of retinal detachment (RD), retinal damage, and/or cells at the vitreous23.
NOTES: Re-apply tropicamide, oxybuprocaine, and ethylcellulose as necessary. - Based on the OCT scans from step 5.1, classify the RD patterns21 according to: (1) local RD-one site of RD; (2) leakage into the vitreous-observing cell material in the vitreous; (3) extended RD-multiple sites of RD.
- Predict the tumor localization based on: (1) local RD-expected choroidal tumors; (2) leakage into the vitreous-expected tumors in the vitreous; (3) extended RD-expected variable and dispersed tumors (Figure 2).
NOTE: Only mice with local RD (about 50%) are expected to develop tumors that are limited to the choroid.
6. Predicting tumor size based on RD height
- Measure the height of local RD in the OCT scans using an OCT segmentation/analysis software (see Table of Materials) and classify according to the following groups: small = <300 µm; medium = 300-400 µm; large = >400 µm.
- Assess the volume that the tumors are expected to reach within 5 days from injection according to the following criteria:
A small RD height is typically observed in small-sized tumors (tumor volume ranging from 0.0059 mm3 to 0.07 mm3 with a mean volume of 0.027 ± 0.005 mm3).
A medium RD height is found in both small and medium-sized tumors (tumor volume ranging from 0.015 mm3 to 0.15 mm3 with a mean volume of 0.056 ± 0.016 mm3).
A large RD height is associated with a wide range of tumor volumes up to 0.36 mm3.
NOTE: The range of expected tumor sizes was obtained from the previous results and divided into three groups of small, medium, and large tumors.
7. Postoperative procedures
- Apply ophthalmic ofloxacin 0.3% topically.
- Reverse the anesthesia by injecting atipamezole hydrochloride (3 mg/kg) subcutaneously.
- Subcutaneously inject buprenorphine (0.05 mg/kg body weight) twice a day for 3 days to reduce the pain and suffering of animals.
- At 5 days after melanoma cell injection, evaluate tumor size by following the steps below.
- Anesthetize the mice as described in step 2.1. Apply tropicamide (0.5%).
- Examine the eyes by longitudinal and sagittal OCT scans and use OCT segmentation/analysis software to measure tumor volume and localization.
- Calculate tumor volume using the formula24: V = a*b*c*6/π (a, b, and c = length, width, and height, respectively).
- Examine tumor size every 2-3 days as described in steps 7.4.1-7.4.3.
NOTE: The procedure must be optimized if using different mouse strains or cell lines.
Subscription Required. Please recommend JoVE to your librarian.
Representative Results
Eyes were examined via OCT immediately after injection of the B16LS9 cells. Local retinal detachment was observed after injection. The mice exhibited three patterns of RD: focal (Figure 2, upper panel), leakage to the vitreous (Figure 2, middle panel), and extended RD (Figure 2, bottom panel). Extended RD is likely caused by damage from the injection. There was an association between the pattern of RD immediately after injection and the localization of the tumors 5-7 days after injection. As demonstrated in Figure 2, focal RD was associated with tumor cell growth that was limited to the choroid. However, observation of cells in the vitreous after injection in animals displaying focal RD indicated tumor growth in the vitreal cavity in addition to the choroid. Finally, when extended RD, or RD at multiple sites, was observed after injection, tumors were dispersed throughout the choroid and vitreous after 5 days. Previous studies demonstrated that the characterization of tumors by OCT fully correlated with the histological examination21.

Figure 2: OCT-based prediction of tumor growth following sub-choroidal cell injection. A total of 7 × 10⁴ B16LS9 cells in 2 µL of PBS were injected into the sub-choroid space of the mouse eyes. The injection site was visualized by OCT and fundus imaging immediately after cell injection (left). Dashed lines denote the detection of focal RD (top), cell material at the vitreous (middle), and extended RD (bottom). On the right, dashed lines indicate the tumor mass 5 days after injection. This figure is adapted from Zaks et al.21. Please click here to view a larger version of this figure.
The range of tumor sizes induced in this model may be divided into small, medium, and large (Figure 3). The height of the RD after injection was associated with the tumor size at 5 days post-injection, as measured by the horizontal and vertical OCT scans (Figure 4). The RD heights associated with the tumor sizes are shown in Table 1.
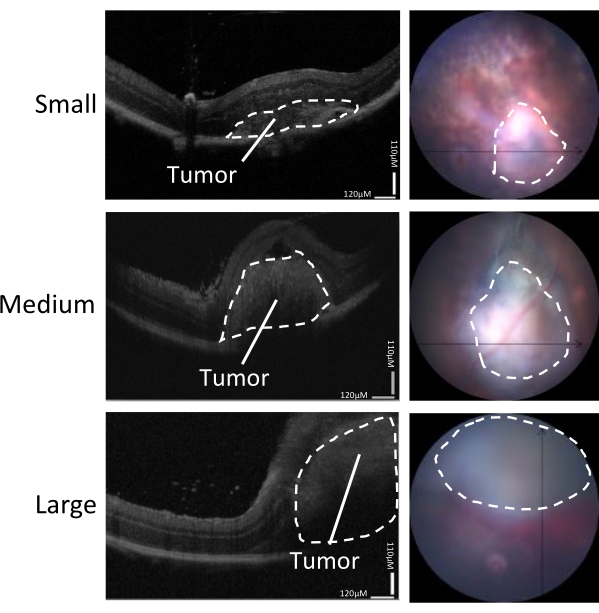
Figure 3: Determining tumor size. Tumor growth was evaluated by OCT scans (left) and real-time camera view of the fundus (right) 5-7 days following inoculation. Shown are representative images of small, medium, and large tumors. This figure is adapted from Zaks et al.21. Please click here to view a larger version of this figure.

Figure 4: Classification of tumor size based on OCT live imaging. Tumors were induced by sub-choroidal injection of 7 × 10⁴ B16LS9 cells. Tumor growth was evaluated in live OCT imaging immediately and 5 days following injection. (A) A representative OCT measurement of RD height after injection (day 0, left, yellow line indicates height), tumor height and width in a horizontal OCT scan (day 5, middle, yellow lines indicate height and width), and an H&E-stained eye section (right). Inset: fundus image of the RD area. (B) The range of tumor sizes induced was divided into three groups. Tumor volume measurements of mice that presented small (S, n = 15), medium (M, n = 9), or large (L, n = 7) RD immediately after cell injection is represented. *p < 0.05. This figure is adapted from Zaks et al.21. Please click here to view a larger version of this figure.
| RD height | Tumor volume |
| <300 μm (small) | 0.0059 mm3 to 0.07 mm3 (mean 0.027 ± 0.005 mm3) |
| 300-400 μm (medium) | 0.015 mm3 to 0.15 mm3 (mean 0.056 ± 0.016 mm3) |
| > 400 μm (large) | 0.05 mm3 to 0.36 mm3 (mean 0.017 ± 0.06 mm3) |
Table 1: The associated RD heights with the tumor size.
Subscription Required. Please recommend JoVE to your librarian.
Discussion
Uveal melanoma is a devastating disease for which novel therapeutic approaches are greatly needed. However, research on uveal melanoma and potential treatments is limited by the technical challenges of uveal melanoma animal models1,25. Ocular tumors, which are induced by intraocular injection of cancer cells, are highly variable in both localization and size, likely due to the small dimensions of the mouse eye. Such variability is an obstacle to the comprehensive evaluation of tumor progression. The experimental approach described herein allows one to assess intraocular tumor localization and predicted size immediately after sub-choroidal B16LS9 melanoma cell injection, based on live OCT imaging21. Over the years, the development of live imaging techniques provided advantages in cancer research by allowing to follow tumor progression throughout experiments, not just at pre-defined endpoints. Such methods include, for example, bioluminescent imaging utilizing reporter cells, which enables monitoring of the location of tumors and metastases in living animals, including identifying ocular tumors16. Another sophisticated method is photoacoustic imaging, which enables high-resolution imaging of cells and distinguishing melanoma cells from healthy cells26,27. However, the distinct advantage of OCT is the ability to identify the intraocular location of tumors and evaluate their size in live animals.
The protocol described here depicts the intraocular inoculation of melanoma cells by forming a peritomy and a tract into the sub-choroidal space, followed by the gentle insertion of a blunt needle to the tip of the tract and cell injection. This eliminates excessive puncture and directs the location of cell inoculation. The injection induces retinal detachment, which reflects the localization and size of the tumor that will be developed. Our observations suggest that tumors formed at the position of a local RD tend to be focal, and their size corresponds to the height of the RD after injection. In contrast, multiple RDs, or detecting cells at the vitreous after injection, typically result in dispersed tumors21.
It is plausible that focal RD reflects that the injection compacted most cells in a certain location, allowing for the formation of a localized tumor. On the other hand, multiple RD sites imply that the injection reached several locations across the retina, increasing the likelihood that tumor cells were implanted in numerous sites and formed dispersed tumors.
Evaluating the localization and predicted tumor size early after injection is particularly important when assessing tumor progressions, such as examining the effect of specific factors or potential treatments. Early determination can allow the inclusion of a homogenous study group, enhancing the model's reproducibility, thereby improving the study's accuracy, and saving valuable time and costs. Further, as OCT imaging of intraocular tumors provides accurate information on both the location and size of tumors in living animals, mice may be monitored for long-term experiments, for example, to evaluate metastases. Another difficulty in mouse models of melanoma is that mouse pigmentation, such as in C57BL/6 mice, often restricts the analysis of pigmented tumors. Therefore, another advantage of OCT imaging is that it is independent of pigmentation and may be applied to pigmented mice or lesions.
It must be noted that various parameters, such as the mouse strain, cell line, or injection technique, may affect tumor initiation and growth. Therefore, optimization of the model for specific strains or cells is advised. It must also be considered that secondary cataracts may develop over time1, limiting the ability to use OCT. While this is unlikely to occur in the short timeframe described herein, one should consider increasing the group size if performing longer experiments to allow for the exclusion of cataract eyes.
In summary, the described protocol utilizes a common model of B16LS9 melanoma, assessed by live OCT imaging, to develop a reproducible model for evaluating choroidal tumors in live animals. This approach may be utilized for future studies investigating the underlying mechanisms of uveal melanoma, new experimental models, and potential new therapies.
Subscription Required. Please recommend JoVE to your librarian.
Disclosures
Marcovich A.L.: Steba Biotech (P), Yeda Weizmann (P), EyeYon Medical (C, P), Mor Isum (P). (C) = Consultant; (P) = Patent. All other authors have no competing interests.
Acknowledgments
This study was supported in part by grant 1304/20 from the Israel Science Foundation (ISF), Israel, for Arie Marcovich. We thank Shahar Ish-Shalom and Ady Yosipovich, from the Department of Pathology, Kaplan Medical Center, Rehovot, Israel, for histology analysis.
Materials
| Name | Company | Catalog Number | Comments |
| 10 μL glass syringe (Hamilton Co., Bonaduz, Switzerland) | Hamilton | 721711 | |
| 30 G needles | BD Microbalance | 2025-01 | |
| Atipamezole hydrochloride | Orion Phrma | ||
| B16LS9 cells | from Hans Grossniklaus USA | ||
| Buprenorphine | richter pharma | 102047 | |
| C57BL/6 female mice | Envigo | ||
| Essential vitamin mixture | satorius | 01-025-1A | |
| Fetal bovine serum | rhenium | 10270106 | |
| HEPES | satorius | 03-025-1B | |
| Hydroxyethylcellulose 1.4% eye drops | Fisher Pharmaceutical | 390862 | |
| InSight OCT segmentation software | Phoenix Micron, Inc | ||
| Ketamine | bremer pharma GMBH (medimarket) | 17889 | |
| L-glutamine | satorius | 03-020-1B | |
| Medetomidine | zoetis (vetmarket) | 102532 | |
| Ofloxacin 0.3% eye drops | allergan | E92170 | |
| Optical coherence tomography | Phoenix Micron, Inc | ||
| Oxybuprocaine 0.4% | Fisher Pharmaceutical | 393050 | |
| Penicillin-streptomycin-amphoteracin | satorius | 03-033-1B | |
| Phosphate buffered saline (PBS) | satorius | 02-023-1a | |
| RPMI cell media | satorius | 01-104-1A | |
| Sodium pyruvate | satorius | 03-042-1B | |
| Surgical microscope | Zeiss | OPMI-6 CFC | |
| Tropicamide 0.5% | Fisher Pharmaceutical | 390723 |
References
- Jager, M. J., et al. Uveal melanoma. Nature Reviews Disease Primers. 6 (1), 1-25 (2020).
- Bustamante, P., Piquet, L., Landreville, S., Burnier, J. V. Uveal melanoma pathobiology: Metastasis to the liver. Seminars in Cancer Biology. 71, Academic Press. 65-85 (2021).
- Damato, B. Ocular treatment of choroidal melanoma in relation to the prevention of metastatic death-A personal view. Progress in Retinal and Eye Research. 66, 187-199 (2018).
- Jouhi, S., et al. The small fatal choroidal melanoma study. A survey by the European Ophthalmic Oncology Group. American Journal of Ophthalmology. 202, 100-108 (2019).
- Cao, J., Jager, M. J. Animal eye models for uveal melanoma. Ocular Oncology and Pathology. 1 (3), 141-150 (2015).
- Uner, O. E., Gandrakota, N., Azarcon, C. P., Grossniklaus, H. E. Animal models of uveal melanoma. Annals of Eye Science. 7, 21-30 (2022).
- Yang, H., Dithmar, S., Grossniklaus, H. E. Interferon alpha 2b decreases hepatic micrometastasis in a murine model of ocular melanoma by activation of intrinsic hepatic natural killer cells. Investigative Ophthalmology & Visual Science. 45 (7), 2056-2064 (2004).
- Yang, H., Grossniklaus, H. E. Combined immunologic and anti-angiogenic therapy reduces hepatic micrometastases in a murine ocular melanoma model. Current Eye Research. 31 (6), 557-562 (2006).
- Rusciano, D., Lorenzoni, P., Burger, M. M. Murine models of liver metastasis. Invasion & Metastasis. 14 (1-6), 349-361 (1994).
- Diaz, C. E., Rusciano, D., Dithmar, S., Grossniklaus, H. E. B16LS9 melanoma cells spread to the liver from the murine ocular posterior compartment (PC). Current Eye Research. 18 (2), 125-129 (1999).
- Rusciano, D., Lorenzoni, P., Burger, M. M. Murine models of liver metastasis. Invasion & Metastasis. 14 (1-6), 349-361 (1994).
- Ashur-Fabian, O., et al. Tetrac delayed the onset of ocular melanoma in an orthotopic mouse model. Frontiers in Endocrinology. 12, 632335 (2019).
- Elia, G., et al. Mechanisms regulating c-met overexpression in liver-metastatic B16-LS9 melanoma cells. Journal of Cellular Biochemistry. 81 (3), 477-487 (2001).
- Harning, R., Szalay, Z. Ocular metastasis of in vivo and in vitro derived syngeneic murine melanoma. Investigative Ophthalmology & Visual Science. 28 (9), 1599-1604 (1987).
- Ezra-Elia, R., et al. Can an in vivo imaging system be used to determine localization and biodistribution of AAV5-mediated gene expression following subretinal and intravitreal delivery in mice. Experimental Eye Research. 176, 227-234 (2018).
- Notting, I. C., et al. Whole-body bioluminescent imaging of human uveal melanoma in a new mouse model of local tumor growth and metastasis. Investigative Ophthalmology & Visual Science. 46 (5), 1581-1587 (2005).
- Yang, H., et al. In-vivo xenograft murine human uveal melanoma model develops hepatic micrometastases. Melanoma Research. 18 (2), 95-103 (2008).
- Murthy, R. K., Haji, S., Sambhav, K., Grover, S., Chalam, K. V. Clinical applications of spectral domain optical coherence tomography in retinal diseases. Biomedical Journal. 39 (2), 107-120 (2016).
- Drexler, W., et al. Ultrahigh-resolution ophthalmic optical coherence tomography. Nature Medicine. 7 (4), 502-507 (2001).
- Ochakovski, G. A., Fischer, M. D. Phenotyping of mouse models with OCT. Methods in Molecular Biology. 1834, 285-291 (2019).
- Zaks, O., et al. In-vivo imaging for assessing tumor growth in mouse models of ocular melanoma. Experimental Eye Research. 204, 108431 (2021).
- Brar, V. S. American Academy of Ophthalmology 2022-2023 BCSC. 2. Fundamentals and principles of ophthalmology. , (2022).
- Duker, J. S., Waheed, N. K., Goldman, D. Handbook of Retinal OCT: Optical Coherence Tomography, 2nd Edition. , Elsevier Health Sciences. (2021).
- Tomayko, M. M., Reynolds, C. P. Determination of subcutaneous tumor size in athymic (nude) mice. Cancer Chemotherapy and Pharmacology. 24 (3), 148-154 (1989).
- Richards, J. R., Yoo, J. H., Shin, D., Odelberg, S. J. Mouse models of uveal melanoma: Strengths, weaknesses, and future directions. Pigment Cell & Melanoma Research. 33 (2), 264 (2020).
- Chen, R., et al. Photoacoustic molecular imaging-escorted adipose photodynamic-browning synergy for fighting obesity with virus-like complexes. Nature Nanotechnology. 16 (4), 455-465 (2021).
- Yu, Q., et al. Label-free visualization of early cancer hepatic micrometastasis and intraoperative image-guided surgery by photoacoustic imaging. Journal of Nuclear Medicine. 61 (7), 1079-1085 (2020).
